Cardiac Conduction Physiology of Cardiac Conduction The excitatory


 node. 2.")
 means")
")
 • Results of")


 • Caused by cardiac arrest (no electrical")
- Slides: 14
Cardiac Conduction
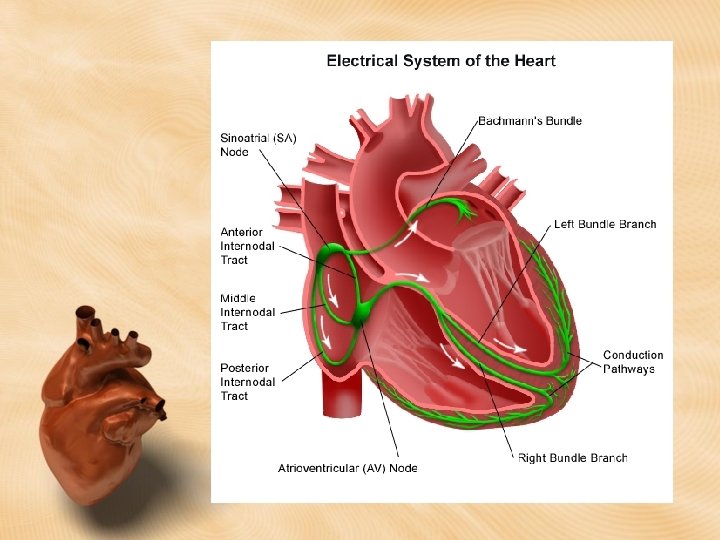
Physiology of Cardiac Conduction • The excitatory & electrical conduction system of the heart is responsible for the contraction and relaxation of the heart muscle. • The sinoatrial node (SA node) is the pacemaker where the electrical impulse is generated.
Steps of Cardiac Conduction 1. SA node fires to the atrioventricular (AV) node. 2. AV node delays for 0. 1 seconds while the atria contract (blood moves down into the ventricles 3. Impulse moves down the septum (space between R and L ventricles through the R and L bundle branches 4. Bundle branches carry impulse through Purkinje fibers to initiate ventricular contraction (blood is pumped out)
What an electrocardiogram (ECG or EKG) means
The ECG (or EKG)
Deflection waves P wave • Atrial systole • Atria squeeze (contract) • Results of depolarization from SA node throughout atria • Normal duration is 0. 08 to 0. 11 seconds
Deflection waves QRS complex • Results due to depolarization of ventricles • Ventricular systole & atrial diastole • R waves are deflected positively and the Q and S waves are negative • Lasts 0. 08 s (Normally not longer than 0. 10 s in duration)
Deflection waves T wave • Ventricular diastole • Ventricles relax and heart is “at rest” • Results due to repolarization of ventricles • Lasts 0. 16 s
Normal ECG Deflection Wave Pattern
Abnormal ECG Deflection Wave Patterns Sinus Bradycardia “Slow Heartbeat” Rate = 40 -59 b. p. m.
Abnormal ECG Deflection Wave Patterns Sinus Tachycardia Rate = 101 -160 b. p. m. • Caused by increased body temperature, stress or response to pain
Abnormal ECG Deflection Wave Patterns Ventricular Fibrillation • Caused by a heart attack (myocardial infarction or MI)
Abnormal ECG Deflection Wave Patterns Asystole (Flatline) • Caused by cardiac arrest (no electrical activity in the heart • Yer dead…