Continued Education Program Physiology 2 CARDIOVASCULAR PHYSIOLOGY Cardiac


: is the volume of blood pumped by each ventricle")


")
")
 6 -Muscle")


 • It is the fraction of the EDV that is ejected")
 • Ejection fraction is normally greater than 55% (or 0. 55).")
 Normal human heart consumes about 8 ml O 2/")


- Slides: 60
Continued Education Program Physiology 2 CARDIOVASCULAR PHYSIOLOGY Cardiac Output Presented by: Dr. Shaimaa Nasr Amin Lecturer of Medical Physiology
Cardiac Output
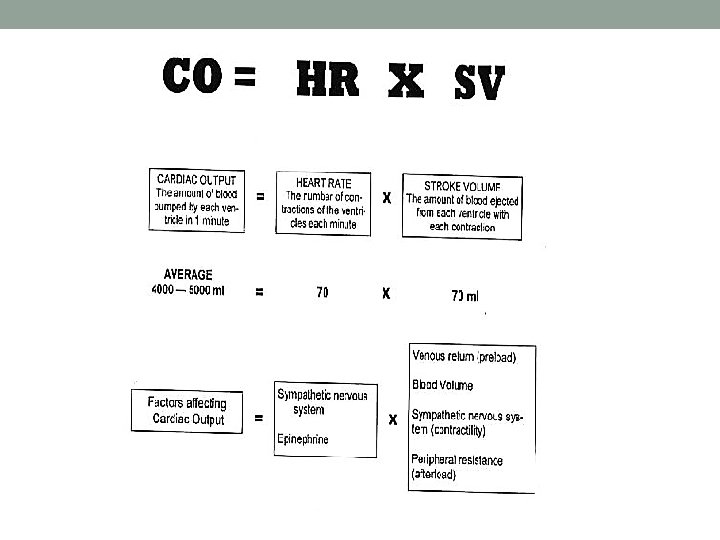
• Cardiac output (CO): is the volume of blood pumped by each ventricle per minute. • Average normal value for CO in adults is about 5 liters/minute.
• Cardiac Index: the value of CO depends on body size, being higher for people with large body size. • The cardiac index is calculated by dividing CO (L/min) by body surface area (m 2). Normal cardiac index is about 3. 2 L/min/m 2.
• Cardiac output increases in the following conditions: 1. Physical exercise (up to 700%). 2. Anxiety and excitement (up to 100%). 3. After meals (30%). 4. High environmental temperature. 5. Pregnancy.
• Cardiac output decreases in the following conditions: 1. Standing from supine position (30%) 2. Rapid cardiac arrhythmias and many other heart diseases.
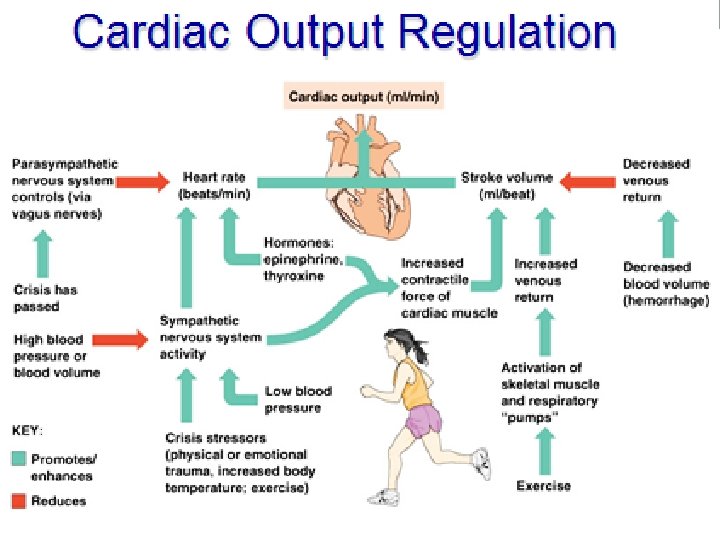
Determinants of Cardiac output • With each heart beat, each ventricle ejects a volume of blood known as the stroke volume (SV). • This stroke volume, multiplied by the number of beats per minute (known as the heart rate HR) equals the CO:
Determinants of Cardiac output is determined therefore by: • Heart rate. • Stroke volume.
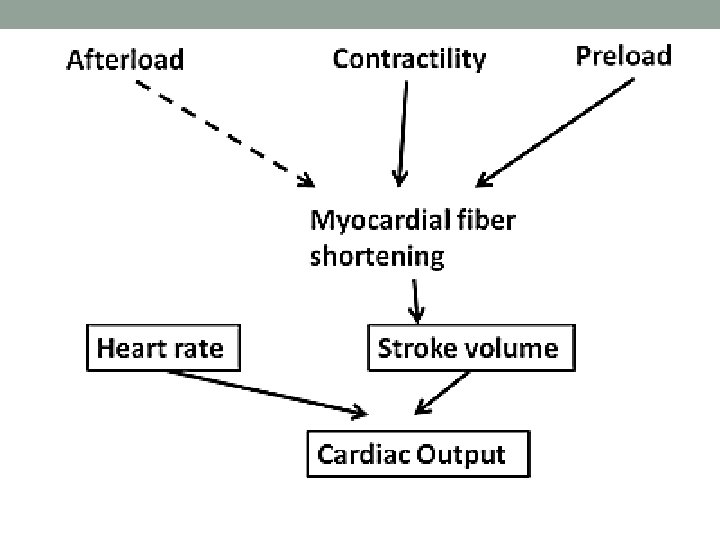
Control of Cardiac Output • Cardiac output is determined by heart rate and stroke volume. • Stroke volume depends on the degree of myocardial fiber shortening.
Control of Cardiac Output • The degree of shortening is increased when preload and inotropy increases, while an increase in afterload decreases the degree of shortening
Effect of changes in heart rate on cardiac output • Changes in heart rate are quantitatively more important than changes in stroke volume. In untrained person, HR can increase during muscular exercise by 100% to 200% while SV may increase by less that 50%.
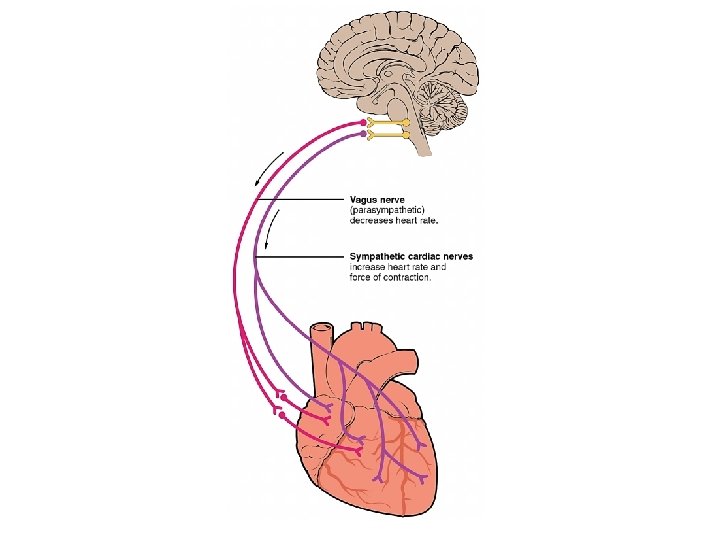
Effect of changes in heart rate on cardiac output • Heart rate normally represents the rate of discharge of the SA node. This is controlled mainly by autonomic nerve supply to the heart.
Effect of changes in heart rate on cardiac output • Changing HR alone from 70 to 140 beat/min does not double CO as expected. This is because increasing HR alone causes the SV to decrease to half its value and the CO will not change. The decrease in SV is due to shortening of diastole as the HR increase with consequent decrease in ventricular filling.
Effect of changes in heart rate on cardiac output • If the HR alone is increased above 150/min it will be accompanied by decreased CO. At such high rates, SV will be markedly decreased and the high HR will not compensate for the decrease in SV.
Effect of changes in heart rate on cardiac output • If the HR alone is slowed down below 60/min, CO will also decrease. At such slow rates, the increase in SV is limited by ventricular capacity and cannot compensate for the low heart rate.
Effect of changes in heart rate on cardiac output • However, under normal physiological conditions e. g. during muscular exercise, HR that is double the resting value can lead to more than double CO. This is because SV also increases.
Effect of changes in heart rate on cardiac output • Different physiological mechanisms are responsible for the increased SV during exercise even with high HR and short ventricular filling time.
Factors affecting heart rate 1 -Nervous factors
Factors affecting heart rate 2 -Mechanical (Baroreceptor reflex)
Factors affecting heart rate 3 -Chemical factors (chemoreceptor reflex)
Factors affecting heart rate 4 -Respiration 5 -Venous return (via volume receptors) 6 -Muscle proprioreceptors
ESV and EDV • By the time diastole ends, each ventricle has filled up with blood. This amount of blood is the end diastolic volume or EDV. • At the end of systole the volume of blood remaining in each ventricle is the end systolic volume or ESV.
ESV and EDV • Each ventricle normally contains about 120 ml of blood by the end of diastole. At the end of systole about 50 ml of blood are left in each ventricle. This means that 70 ml of blood were pumped out of each ventricle during systole.
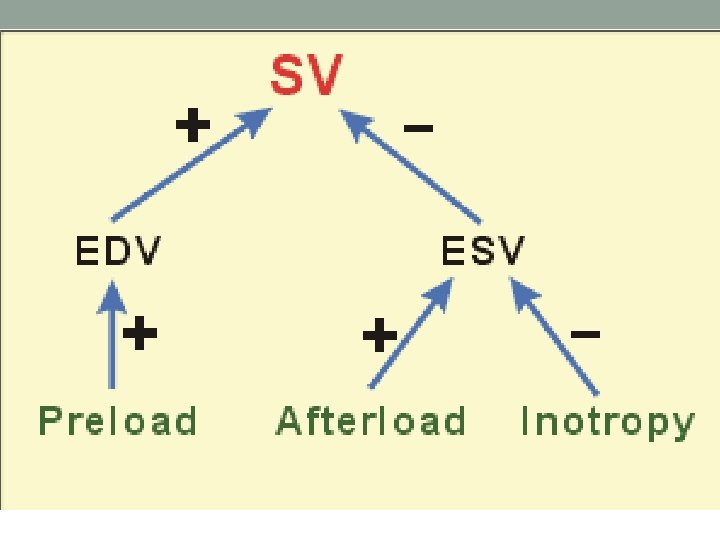
Regulation of Stroke Volume • Stroke volume is the difference between end-diastolic volume EDV and endsystolic volume ESV. • Any factor that affects EDV or ESV can regulate SV and consequently cardiac output.
Regulation of Stroke Volume • Three main factors can affect SV: 1. Preload: affects mainly EDV. 2. Afterload: affects mainly ESV. 3. Inotropy: affects mainly ESV.
Effect of changes in preload on stroke volume • Preload is the degree of stretching of cardiac myocytes before they start to contract, i. e. at the end of diastole.
Effect of changes in preload on stroke volume • The degree of stretching is measured by the sarcomere length. However, in intact heart the sarcomere length cannot be measured. Instead, the EDV is taken as an index of the sarcomere length, i. e. as an index of preload.
Effect of changes in preload on stroke volume • Ventricular preload is determined by EDV. The EDV depends on venous return. Increased venous return increases the EDV and consequently the preload.
Effect of changes in preload on stroke volume • Increased preload leads to increased SV. This relationship is explained according to Frank-Starling’s law.
• Frank-Starling law: The ability of the heart to change its force of contraction and therefore stroke volume in response to changes in venous return. It is sometimes described as “heterometric autoregulatory mechanism”.
Several factors can affect ventricular preload 1 -Venous return and venous pressure: increased venous pressure causes more ventricular filling and will increase preload. Factors that increase venous pressure and venous return.
Several factors can affect ventricular preload 2 -Atrial contraction: strong atrial contraction increases preload.
Several factors can affect ventricular preload 3 -Heart rate: increased heart rate can decrease preload (if the venous return remains constant). The reason for this is that high heart rate will shorten diastole and do not allow enough time for ventricular filling.
Several factors can affect ventricular preload 4 -Ventricular compliance: decreased ventricular compliance (e. g. due to hypertrophy or myocardial infarction) will decrease preload.
Effect of Afterload on Stroke Volume • The afterload against which the ventricle contracts to eject blood is represented by the aortic pressure (or pulmonary pressure for right ventricle). • Increased afterload leads to decreased SV
Effect of Inotropic State on Stroke Volume • Increased inotropy leads to increasing SV
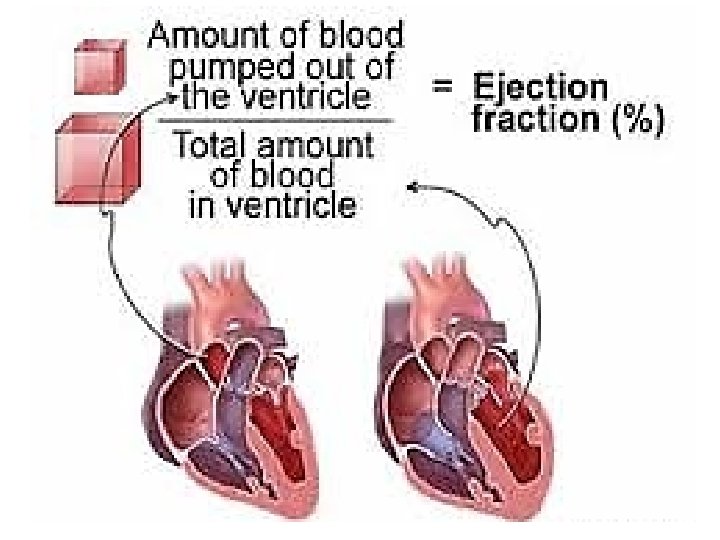
Ejection fraction (EF) • It is the fraction of the EDV that is ejected with each beat.
Ejection fraction (EF) • Ejection fraction is normally greater than 55% (or 0. 55). • Ejection fraction is used clinically as an index of contractility. Increasing inotropy increases EF, whereas decreasing inotropy decreases EF.
Myocardial Oxygen Consumption (MVO 2) Normal human heart consumes about 8 ml O 2/ min/100 : • 6 ml are consumed by the myocytes to regenerate ATP for contraction and relaxation. • 2 ml are consumed by other cellular activities and ionic pumps of the myocytes.
Factors affecting myocardial oxygen consumption 1 -Heart rate: increase in heart rate produces a proportionate increase in MVO 2, e. g. 50% increase in heart rate produces approximately 50% increase in MVO 2.
Factors affecting myocardial oxygen consumption 2 -Inotropy: similarly, increase in inotropy by positive inotropic stimulus produces a proportionate increase in MVO 2.
Factors affecting myocardial oxygen consumption 3 -Afterload: increase in afterload produces a proportionate increase in MVO 2.
Factors affecting myocardial oxygen consumption 4 -Preload: increase in preload produces a smaller increase in MVO 2.
Cardiac Reserve • It is the maximum percentage increase in cardiac output that can be achieved above normal in response to increased body demands.
Cardiac Reserve • In normal young adult cardiac reserve is 300% - 400%. This means that a cardiac output can be increased (e. g. during maximal exercise) from resting value of 5 l/min to 15 -20 l/min.
Cardiac Reserve • In elderly people, cardiac reserve decreases to 200% or even less. • In heart failure, cardiac reserve may decrease down to zero%.
Cardiac Reserve Cardiac reserve depends on: A-Heart rate reserve B-Stroke volume reserve
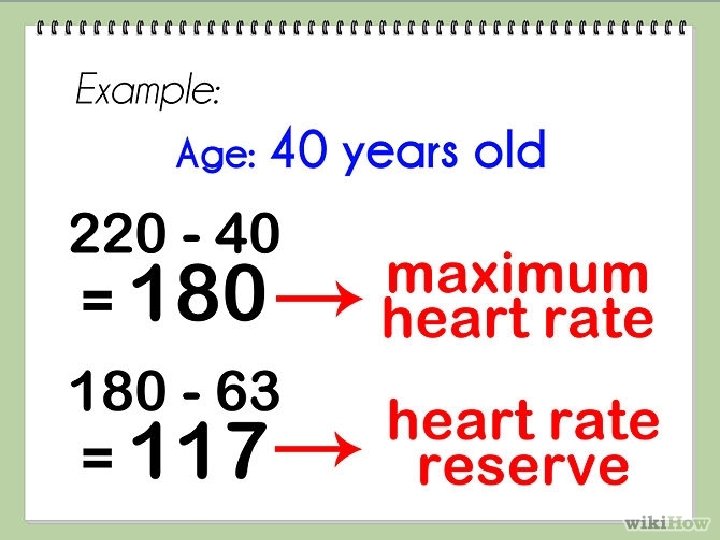
Cardiac Reserve A-Heart rate reserve • Maximal heart rate = 220 – age in years. This is approximately 180 -200 beats/min. • The normal resting heart rate is about 75 /min. So there is a reserve for the heart rate to increase during exercise from 75 to 180200 per min.
Cardiac Reserve B-Stroke volume reserve • SV can increase up to 200 ml during maximal exercise. This can be achieved by: 1. Increasing EDV 2. Decreasing ESV 3. Increased size of the heart (cardiac hypertrophy)
Cardiac hypertrophy • A-Eccentric hypertrophy: This type of cardiac hypertrophy is known as “volume overload hypertrophy”. This hypertrophy enables the heart to pump greater stroke volume.
Cardiac hypertrophy • B-Concentric hypertrophy: • This is known as “pressure overload hypertrophy”. The thickness of the ventricle increases. However, ventricular volume is not increased.
Cardiac hypertrophy