ECHOCARDIOGRAPHIC ASSESSMENT OF AORTIC STENOSIS Dr Julian Johny


 Thin discrete membrane consisting of endocardial fold and fibrous tissue")


")


 Aortic Sclerosis Mild Moderate")


 Vertical distance between right")


- Slides: 86
ECHOCARDIOGRAPHIC ASSESSMENT OF AORTIC STENOSIS Dr Julian Johny Thottian
Aorta - anatomy Eur J Echocardiogr 2009; 10: i 3 -10
Normal Aortic valve Three cusps, crescent shaped 3 commissures 3 sinuses supported by fibrous annulus 3. 0 to 4. 0 cm 2 Node of Arantius
PLAX
ZOOMED PLAX
The long-axis view of the left ventricle corresponding with the echocardiographic parasternal long-axis view, demonstrating the extent of the aortic root. Piazza N et al. Circ Cardiovasc Interv 2008; 1: 74 -81 Copyright © American Heart Association
M MODE
PSAX
VARIOUS MEASUREMENTS VS 2. 8+/- 0. 3 STJ 2. 4+/- 0. 4 AAo AA 2. 6+/- 0. 3 1. 9+/- 0. 2 Evangelista A, Flachskampf FA, Erbel R et al. Echocardiography in aortic diseases: EAE recommendations for clinical practice. Eur J Echocardiogr 2010; 11: 645 -58
2 D - Apical five chamber view
2 D – Suprasternal view
3 D ECHO
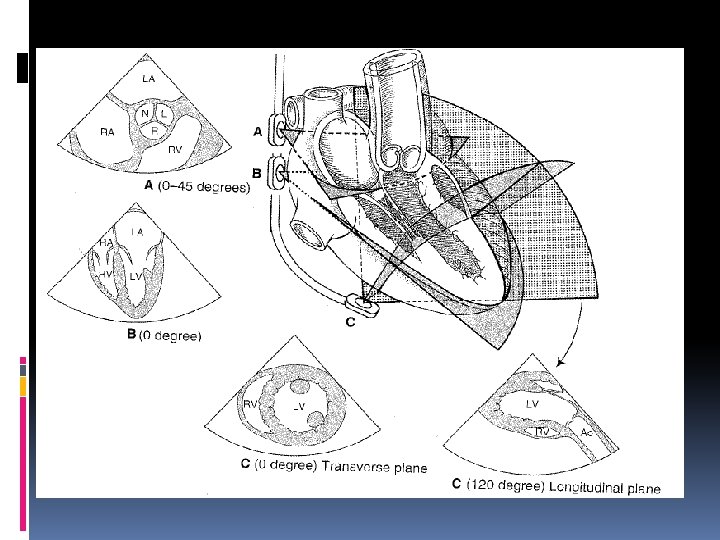
TEE
Aortic stenosis- Causes Most common : Bicuspid aortic valve with calcification Senile or Degenerative calcific AS Rheumatic AS Less common: Congenital Type 2 Hyperlipoproteinemia Oochronosis
ANATOMIC CONSIDERATIONS
Calcified aortic valve Most prominent in the central part of each cusp Commissural fusion absent Stellate-shaped systolic orifice. Valve calcification Mild - few areas of dense echogenicity with little acoustic shadowing Severe- extensive thickening and increased echogenicity with a prominent acoustic shadow. Valve calcification - predictor of clinical outcome.
Calcific Aortic Stenosis v Calcification of a bicuspid or tricuspid valve, the severity can be graded semi-quantitatively as 0 1+ 2+ 3+ 4+ Schaefer BM et al. Heart 2008; 94: 1634– 1638. v The degree of valve calcification is a predictor of clinical outcome. Rosenhek R et al. N Engl J Med 2000; 343: 611– 7.
Calcific Aortic Valve
Bicuspid Aortic Valve Fusion of the RCC & LCC -80% of cases. Fusion of the RCC & NCC-20% of cases. Fusion of the LCC and NCC is rare.
Bicuspid Aortic Valve
Rheumatic aortic stenosis Rheumatic AS - commissural fusion Triangular systolic orifice Thickening and calcification mostly along the edges of the cusps. Concomitant involvement of mitral valve seen
Subvalvular aortic stenosis (1) Thin discrete membrane consisting of endocardial fold and fibrous tissue (2) A fibromuscular ridge (3) Diffuse tunnel-like narrowing of the LVOT (4) accessory or anomalous mitral valve tissue.
Supravalvular Aortic stenosis v. Type I - Thick, fibrous ring above the aortic valve with less mobility and has the easily identifiable 'hourglass' appearance of the aorta.
Supravalvular Aortic stenosis v Type II - Thin, discrete fibrous membrane located above the aortic valve v The membrane usually mobile and may demonstrate doming during systole v Type III- Diffuse narrowing
AORTIC VALVE ASSESSMENT
There are many Echo criteria for assessment of Aortic stenosis
Let’s focus on the ones used in daily practice.
RECOMMENDATIONS FOR STANDARD CLINICAL PRACTICE LEVEL A- ESC 2009 ● AS jet velocity ● Mean trans aortic gradient ● Valve area by continuity equation.
AS JET VELOCITY
Jet Velocity This is measured with Continuous wave doppler Multiple windows and “non-standard views” to look for the highest Vmax Apical and Suprasternal or right parasternal most frequently yield the highest velocity; Subcostal or Supraclavicular windows may be required.
Aortic Jet Velocity Patient positioning Adjustment of transducer position Angle - velocity measurement assumes a parallel intercept angle between the ultrasound beam and direction of blood flow AS jet velocity is defined as the highest velocity signal obtained from any window
Aortic Jet Velocity Pitfalls Any deviation from a parallel intercept angle results in velocity underestimationdegree of underestimation is 5% or less if the intercept angle is within 15° of parallel. “Angle correction” should not be used.
Continuous-wave Doppler of severe aortic stenosis jet showing measurement of maximum velocity and tracing of the velocity curve to calculate mean pressure gradient.
Mean transvalvular gradient v The difference in pressure between the left ventricle and aorta in systole v Gradients are calculated from velocity information v It is the mean of different instantaneous velocities recorded
Mean transvalvular gradient v Bernoulli equations ΔP =4 v² v The maximum gradient is calculated from maximum velocity ΔP max =4 v² max v The mean gradient is calculated by averaging the instantaneous gradients over the ejection period
Mean transvalvular gradient v The simplified Bernoulli equation assumes that the proximal velocity can be ignored v When the proximal velocity is over 1. 5 m/s or the aortic velocity is <3. 0 m/s, the proximal velocity should be included in the Bernoulli equation ΔP max =4 (v² max- v 2 proximal)
Sources of error for pressure gradient calculations v Malalignment of jet and ultrasound beam. v Recording of MR jet
Other Sources of error for pressure gradient calculations v Neglect of an elevated proximal velocity. v Any underestimation of aortic velocity results in an even greater underestimation in gradients, due to the squared relationship between velocity and pressure difference v The accuracy of the Bernoulli equation to quantify AS pressure gradients is well established
Pressure recovery v The conversion of potential energy to kinetic energy across a narrowed valve results in a high velocity and a drop in pressure. v Distal to the orifice, flow decelerates again. Kinetic energy will be reconverted into potential energy with a corresponding increase in pressure, the so-called PR
Pressure recovery v Pressure recovery is greatest in stenosis with gradual distal widening v Aortic stenosis with its abrupt widening from the small orifice to the larger aorta has an unfavorable geometry for pressure recovery PR= 4 v²× 2 EOA/Ao. A (1 -EOA/Ao. A)
Cath Vs Echo
Comparing pressure gradients calculated from doppler velocities to pressures measured at cardiac catheterization. Currie PJ et al. Circulation 1985; 71: 1162 -1169
Continuity Equation Schematic diagram of continuity equation. The assumption is that SV LVOT = SV Aortic Valve
Continuity Equation Calculation of continuity-equation valve area requires three measurements: AS jet velocity by CWD LVOT diameter for calculation of a circular CSA LVOT velocity recorded with pulsed Doppler.
Continuity Equation LVOT diameter and PW of the LVOT needs to taken from the same location in the LVOT diameter measured- PLAX view LVOT velocity (or VTI) is measured apically – beware of distance error. The pulsed-Doppler sample volume is positioned just proximal to the aortic valve so that the location of the velocity recording matches the LVOT diameter measurement.
LVOT Diameter • Left ventricular outflow tract diameter is measured in the parasternal long-axis view in midsystole from the white–black interface of the septal endocardium to the anterior mitral leaflet, parallel to the aortic valve plane and within 0. 5– 1. 0 cm of the valve orifice.
Velocity or VTI measurement LVOT velocity is measured from the apical approach either in an apical long-axis view or an anteriorly angulated four-chamber view An optimal signal shows a smooth velocity curve with a narrow velocity range at each time point. Maximum velocity is measured as shown. The VTI is measured by tracing the modal velocity (middle of the dense signal)
Pitfalls of the Continuity Equation 1. Depends on the variability in each of the three measurements, including both the variability in acquiring the data and variability in measuring the recorded data. 2. AS jet and LVOT velocity measurements - intraand inter-observer variability (3– 4%) 3. The measurement variability for LVOT diameter ranges from 5% to 8%. 4. When trans-thoracic images are not adequate for the measurement of LVOT diameter then TEE used.
Pitfalls of the continuity Equation When subaortic flow velocities are abnormal, for example, with dynamic subaortic obstruction or a subaortic membrane, SV calculations at this site are not accurate. Another limitation of valve area as a measure of stenosis severity is the observed changes in valve area with changes in flow rate. In adults with AS and normal LV function, the effects of flow rate are minimal and resting effective valve area calculations are accurate. This effect may be significant when concurrent LV dysfunction results in decreased cusp opening and a small effective orifice area even though severe stenosis is not present.
ALTERNATE MEASURES OF STENOSIS SEVERITY (Level 2 EAE/ASE Recommendations )
Simplified continuity equation Considering the ratio of LVOT to aortic jet VTI is nearly identical to the ratio of the LVOT to aortic jet maximum velocity. AVA= CSA LVOT×VLVOT / VAV Less well accepted because results are more variable than using VTIs in the equation.
Velocity ratio v Another approach to reducing error related to LVOT diameter measurements is removing CSA from the simplified continuity equation. v This dimensionless velocity ratio expresses the size of the valvular effective area as a proportion of the CSA of the LVOT. Velocity ratio= VLVOT/VAV v In the absence of valve stenosis, the velocity ratio approaches 1, with smaller numbers indicating more severe stenosis.
Aortic valve area -Planimetry v Planimetry may be an acceptable alternative when Doppler estimation of flow velocities is unreliable v Planimetry may be inaccurate when valve calcification causes shadows or reverberations limiting identification of the orifice v Doppler-derived mean-valve area correlated better with maximal anatomic area than with meananatomic area. Marie Arsenault, et al. J. Am. Coll. Cardiol. 1998; 32; 1931 -1937
Planimetered Aortic VAvle
Aortic valve area - Planimetry
EXPERIMENTAL DESCRIPTORS OF STENOSIS SEVERITY (Level 3 EAE/ASE Recommendations -not recommended for routine clinical use)
Valve resistance v Relatively flow-independent measure of stenosis severity v Depends on the ratio of mean pressure gradient and mean flow rate Resistance = (ΔPmean /Qmean) × 1333 v There is a close relationship between aortic valve resistance and valve area v The advantage over continuity equation not established
Left ventricular stroke work loss v Left ventricle expends work during systole to keep the aortic valve open and to eject blood into the aorta SWL(%) = (100×ΔPmean)/ ΔPmean+SBP v A cutoff value more than 25% effectively discriminated between patients experiencing a good and poor outcome. Kristian Wachtell. Euro Heart J. Suppl. (2008) 10 ( E), E 16–E 22
Energy loss index Damien Garcia. et al. Circulation. 2000; 101: 765 -771. v Fluid energy loss across stenotic aortic valves is influenced by factors other than the valve effective orifice area. v An experimental model was designed to measure EOA and energy loss in 2 fixed stenoses and 7 bioprosthetic valves for different flow rates and 2 different aortic sizes (25 and 38 mm). v EOA and energy loss is influenced by both flow rate and AA and that the energy loss is systematically higher (15± 2%) in the large aorta. Damien Garcia. et al. Circulation. 2000; 101: 765 -771.
Energy loss index Damien Garcia. et al. Circulation. 2000; 101: 765 -771. v Energy loss coefficient (EOA × AA)/(AA - EOA) accurately predicted the energy loss. v It is more closely related to the increase in left ventricular workload than EOA. v To account for varying flow rates, the coefficient was indexed for body surface area in a retrospective study of 138 patients with moderate or severe aortic stenosis. v The energy loss index measured by Doppler echocardiography was superior to the EOA in predicting the end points v An energy loss index ≤ 0. 52 cm 2/m 2 was the best predictor of diverse outcomes (positive predictive value of 67%).
Classification of AS severity (a ESC & b AHA/ACC Guidelines) Aortic Sclerosis Mild Moderate 3. 0 - 4 Severe Aortic jet velocity (m/s) ≤ 2. 5 m/s 2. 6 -2. 9 >4 Mean gradient (mm Hg) < 20 b(<30 a) 20 – 40 b (30 -50 a) > 40 AVA (cm²) > 1. 5 1. 0 - 1. 5 < 1. 0 Indexed AVA (cm²/m²) > 0. 85 0. 60 – 0. 85 < 0. 6 Velocity ratio > 0. 50 0. 25 – 0. 50 < 0. 25
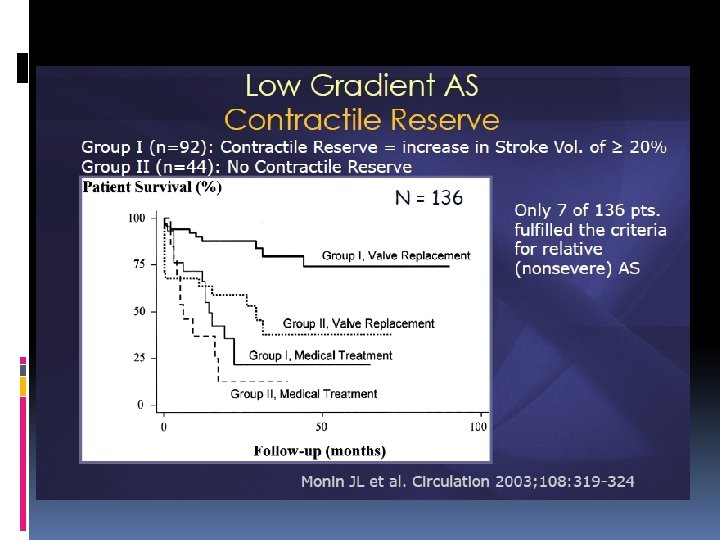
Effects of concurrent conditions ASSOCIATED LV SYSTOLIC DYSFUNCTION AS gradient becomes low, despite a small valve area- ‘low-flow low-gradient AS’ Defined as 1. Effective orifice area 1. 0 cm 2 2. LV ejection fraction< 40% 3. Mean pressure gradient <30– 40 mm. Hg
Dobutamine stress echo Measures 1. contractile response 2. changes in aortic velocity, mean gradient, and valve area as flow rate increases Helps to find out 1. Severe AS causing LV systolic dysfunction 2. Moderate AS with another cause of LV dysfunction
Protocol Low dose - 2. 5 or 5 mg/kg/min with an incremental increase in the infusion every 3– 5 min to a maximum dose of 10– 20 mg/kg/min. The infusion is stopped 1. As soon as a positive result is obtained 2. Heart rate begins to rise more than 10– 20 bpm over baseline or exceeds 100 bpm 3. Symptoms, blood pressure fall, or significant arrhythmias
RESULTS AS velocity, MG, valve area, and EF preferably at each stage (to judge reliability of measurements) but at least at baseline and peak dose An increase in valve area to a final valve area 1. 0 cm 2 suggests that stenosis is not severe. Severe stenosis is suggested by an AS jet 4. 0 or a mean gradient 40 mm. Hg provided that valve area does not exceed 1. 0 cm 2 at any flow rate. Absence of contractile reserve (failure to increase SV or EF by 20%) is a predictor of a high surgical mortality and poor long-term outcome although valve replacement may improve LV function and outcome even in this subgroup.
LVH Small ventricular cavity with thick walls and diastolic dysfunction Small LV ejects a small SV so that, even when severe stenosis is present, the AS velocity and mean gradient may be lower Continuity-equation valve area is accurate indexing valve area to body size
Hypertension Associated in 35 -40% HT increases LV pressure load may cause changes in ejection fraction and flow Mascherbauer J, Fuchs C, Stoiber M, Schima H, Pernicka E, Maurer G et al. Systemic pressure does not directly affect pressure gradient and valve area estimates in aortic stenosis in vitro. Eur Heart J 2008; 29: 2049 -57 presence of hypertension may therefore primarily affect flow and gradients but less AVA measurement.
Aortic regurgitation Severe AR accompanies AS, measures of AS severity remain accurate including maximum velocity, mean gradient, and valve area High transaortic volume flow rate, maximum velocity, and mean gradient will be higher than expected for a given valve area.
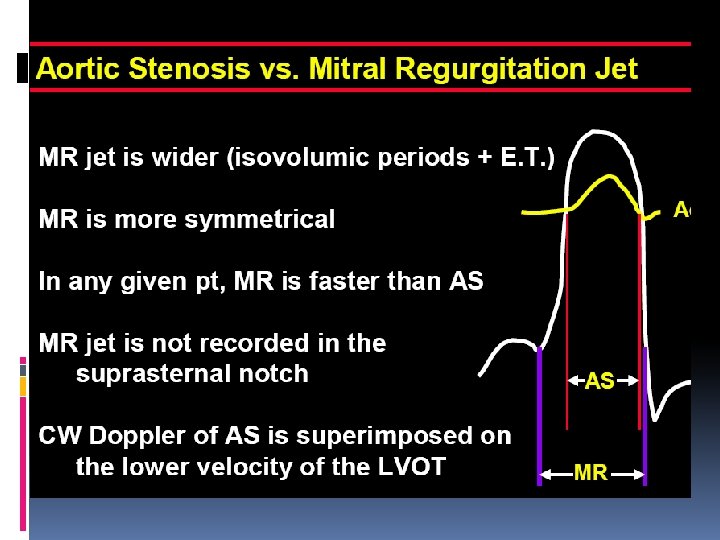
Mitral valve disease Severe MR, transaortic flow rate may be low resulting in a low gradient even when severe AS is present A high-velocity MR jet may be mistaken for the AS jet as both are systolic signals directed away from the apex.
v High cardiac output ØRelatively high gradients in the presence of mild or moderate AS ØThe shape of the CWD spectrum with a very early peak may help to quantify the severity correctly v Ascending aorta ØAortic root dilation ØCoarctation of aorta
M Mode- Aortic Stenosis v Maximal aortic cusp separation (MACS) Vertical distance between right CC and non CC during systole Aortic valve area MACS Measurement Predictive value Normal AVA >2 Cm 2 Normal MACS >15 mm 100% AVA>1. 0 > 12 mm 96% AVA< 0. 75 < 8 mm 97% Gray area 8 -12 mm …. . De. Maria A N et al. Circulation. Suppl II. 58: 232, 1978
THANK YOU
QUIZ
Question 1 1. 2. 3. 4. A patient with severe aortic stenosis has MR. Which one of the following statements is incorrect? The peak mitral regurgitation jet velocity is higher than the peak trans-aortic valve flow velocity. The aortic transvalvular flow duration is shorter than the MR jet duration. The LVOT flow duration is longer than the MR jet duration. MR signal is not obtained in suprasternal window
Question 2 Which of the following is not a marker of severe aortic stenosis? 1. Vmax across the Aortic valve is > 4 m/s 2. Calculated aortic valve area of 1. 34 cm 2 3. LVOT Vmx / AV Vmx ratio < 0. 25 4. Mean gradient = 55 mm. Hg
Question 3 Which is not recommended in level A in assessing aortic stenosis 1. AS jet velocity 2. Mean trans aortic gradient 3. Valve area by continuity equation. 4. Planimetry
Question 4 False about severe AS 1. Mean gradient above 30 mm Hg 2. Velocity ratio < 0. 25 3. Indexed valve area < 0. 6 cm/ m 2 4. Peak velocity > 4 m/sec
Question 5 At maximal dobutamine infusion, in an AS patient, the peak LVOT velocity increased from 50 to 90 cm / sec. , while the peak transaortic valve velocity increased from 2 to 2. 3 m/sec. The LVOT diameter is 2 cm. This study suggests that: 1. The baseline ejection fraction was < 20%. 2. There is significant AR. 3. AS is not severe. 4 LV motion did not improve.
Question 6 Which cannot be used for calculating area of aortic valve ? 1. MV annular diameter 2. MV annular VTI 3. AV VTI 4. LVOT diameter
Question 7 v False about Maximal aortic cusp separation? 1. MACS of normal aortic valve is >15 mm 2. AVA <0. 75 corresponds to MACS <8 mm 3. Vertical distance between left CC and non CC during systole 4. Gray area is 8 -12 mm
Question 8 v False about standard dobutamine stress echocardiography for evaluation of AS severity in setting of LV dysfunction 1 Uses low dose of dobutamine starting at 2. 5 or 5ủg/kg/min 2 Maximum dose of dobutamine used is 10– 20 ủg/kg/min 3 The infusion should be stopped when the heart rate begins to rise more than 10– 20 bpm over baseline 4 Failure of LVEF to ↑ by 40% is a poor prognostic sign
Question 9 Continuity equation obeys 1. Bernoulli`s principle 2. Ohm`s law 3. Law of conservation of energy 4. Poiseuille`s law
Question 10 v In a patient with aortic valve area of 0. 6 sq cm(not a low flow gradient AS) continuous wave Doppler velocity will be: a) 1 -2 m/sec b) 2 -3 m/sec c) 3 -4 m/sec d) > 4 m/sec