Hemodynamics of aortic stenosis Dr Sajeer K T


 is transduced into pressure versus volume overload hypertrophy.")


 - systolic pressure in the right")
 <3. 0 -4. 0 >4.")


")
 v adjusts the Doppler EOA for the size of the")
![Energy loss index (ELI) = [EOA x A A / AA- EOA] BSA Cut-off](https://slidetodoc.com/presentation_image/298ee0961271d388dc6197fb169d8fa0/image-18.jpg "Energy loss index (ELI) = [EOA x A A / AA- EOA] BSA Cut-off")
 -")


 = is the total cardiac output expressed in terms of the seconds")


 rise in pulse pressure by > 5")
 LVEF> 50% b) Indexed")
 Peak stress Mean")
 More in females b) Prevalence")
 Hypertension mask AS severity b)")
 Increase in stroke volume of ≥ 30%")
")
 except? a) Cut-off value for severe AS")


- Slides: 65
Hemodynamics of aortic stenosis Dr Sajeer K T Department of Cardiology, Govt. Medical College, Kozhikode
Aortic stenosis Etiology based on - level of obstruction to LVOT - Supravalvular - Valvular - Congenital AS - BAV ± calcification - Rheumatic - Senile degenerative - Subvalvular
Pressure gradient across the AV ⇈es exponentially with ⇊ing AVA # Severe AS: - small changes in AVA can lead to large changes in hemodynamics
Framework for how mechanical stress (σ) is transduced into pressure versus volume overload hypertrophy. (Grossman W, Jones D, Mc. Laurin LP: Wall stress and patterns of hypertrophy in the human left ventricle. J Clin Invest 1975; 53: 332 -341)
Compensatory Mechanisms Chronic pressure overload ➨ concentric LV hypertrophy increased wall thickness normal chamber size ⇈ed myocardial cell mass and ⇈ed interstitial fibrosis - diastolic dysfunction Women ➨ normal LV function small, thick walled LV concentric LVH diastolic dysfunction Men ➨ eccentric LV hypertrophy excessive systolic wall stress systolic dysfunction & chamber dilation
v Mild AS - intracardiac pressures & CO - normal v As the valve becomes more stenotic - unable to increase CO during exercise v Progressive narrowing of the valve - decreased SV and CO even at rest v Moderate to severe AS - patients may develop elevated filling pressures to compensate for the increase in LV EDP v Minority of patients LV systolic failure - further elevation in intracardiac pressures
Pulse wave
Valvular AS # Slow systolic rise # prominent anacortic notch # late peak HOCM # rapid upstroke # absence of anacortic notch # early systolic dip
Supra valvular AS - pulse disparity (Coanda effect) - systolic pressure in the right arm > left arm. - relate to the tendency of a jet stream to adhere to a vessel wall selective streaming of blood into the innominate artery Streaming of the jet toward the innominate, RCCA, and right SCA
Aortic Stenosis- severity Mild Moderate Severe Jet velocity (m/sec) <3. 0 -4. 0 >4. 0 Mean gradient (mm Hg) <25 25 -40 >40 Valve area (cm 2) >1. 5 1. 0 -1. 5 <1. 0 Valve area index (cm 2/m 2) <0. 6
Clinical Spectrum of Severe AS
Factors involved in generation and interpretation of a pressure gradient # PLV 1 exceeds PLV 2 # VC – (2) - maximum velocity - site of minimal pressure # pressure recovery (3) # pressure P 1 < P 2
Pressure recovery - a source of error in the assessment of AS severity v Severity of AS 1. pressure gradient across the valve or 2. effective orifice area (EOA) of the valve - preferable - less flow dependent v EOA measurement : 1. Doppler echocardiography (continuity equation) 2. Left heart catheterization ( Gorlin formula) v Discrepancies between Doppler and catheter measurements of EOA
Pressure recovery phenomenon
Valvulo-arterial impedance Zva = LV systolic pressure / SVI SAP : systolic arterial pressure ▲ Pmean : mean systolic transaortic gradient SVI : stroke volume index. Values of Zva > 4. 5 mm Hg. ml-1. m -2 ➲ severe AS “ cost in mm. Hg for each ml of blood indexed for BSA pumped by LV”
v Doppler : maximal pressure drop from the maximal velocity recorded at valve (EOA) level v Catheterization : measures the net gradient between the left ventricle v due to pressure recovery phenomenon: and the ascending aorta : net gradient recorded at catheterization is less than the maximum pressure gradient measured by Doppler (Ao < 3 cm) : EOA by catheterization with Gorlin formula is higher than v Doppler method : actual area occupied by flow at the measured by Doppler valvular level v EOA by Gorlin formula: is a coefficient of the energy lost due to the
Energy loss coefficient (ELCo) v adjusts the Doppler EOA for the size of the aorta (AA) ELCo = (EOA×AA) / (AA-EOA) AA : CSA of the aorta measured at 1 cm downstream of the STJ v excellent agreement between catheter EOA and ELCo by Doppler v pressure recovery is a clinically relevant in patients with - moderate to severe AS (Doppler EOA between 0. 8 - 1. 2 cm 2) - small aortas (diameter at the sinotubular junction
Energy loss index (ELI) = [EOA x A A / AA- EOA] BSA Cut-off value for severe AS using the energy loss index < 0. 55 cm 2/ m 2 1. 2. 3. 4. 5. Less flow dependent than gradient or peak velocity Takes into account pressure recovery Equivalent to EOA measured by catheter Reflects true LV energy loss caused by stenosis Measured in patients with small aortas
Low-Flow, Low-Gradient Aortic Stenosis With Normal and Depressed LVEF # Decreased EF (<40%) - Low Flow –Low Gradient AS # Normal EF ( ≥ 50%) - Paradoxical Low Flow –Low Gradient AS ⇊ in gradient ➨ ⇊ in trans-valvular flow.
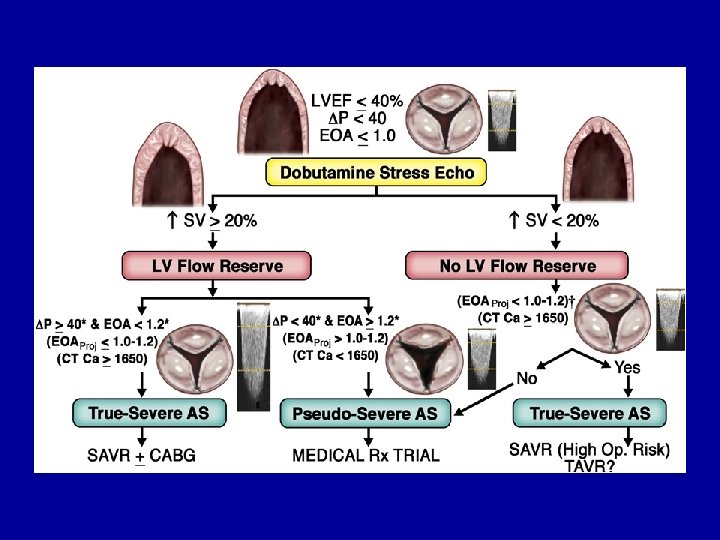
Low-flow, Low-Gradient severe AS with decreased LVEF # valve area <1 cm 2 # mean aortic valve gradient < 40 mm Hg # ejection fraction <40% # pseudo aortic stenosis ➨ medications that increase cardiac output will usually increase the calculated AVA # Intravenous dobutamine - 5 μg/kg/min ➔➔ 20 μg/kg/min
Effects of dobutamine infusion in patients with and without valvular AS # Pseudo severe As Peak stress - MG < 30 mm Hg - EOA >1. 0 -1. 2 cm 2 - ab. in EOA> 0. 3 cm 2 # true severe aortic stenosis (1) a mean aortic valve gradient greater than 30 mm Hg (2) an aortic valve area ≤ 1. 2 cm 2
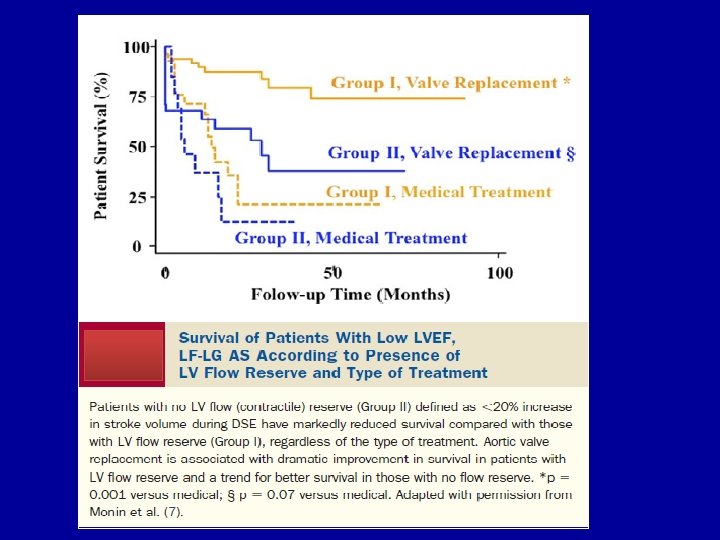
Contractile reserve or flow reserve # Definition: Increase in stroke volume of ≥ 20% above baseline # Post AVR : lower peri-operative mortality (5% v/s 32%) ( n=136) # Post AVR: mean improvement in In LVEF Improvement in NYHA class : similar in CR <20 or >20%
Paradoxical Low flow –low Gradient Severe AS: - indexed AVA < 0. 6 cm 2/m 2 - Gradient < 40 mm. Hg - EF > 50% - Stroke volume index (SVi) : < 35 m. L/m 2
Paradoxical Low Flow –Low Gradient AS Features : v Increased global LV hemodynamic load -⇈ed Zva v Smaller and relatively thicker LV v ⇊ed LV mid-wall radius shortening (pronounced intrinsic myocardial dysfunction) v lower LVEF Poor prognosis if treated medically rather than treated surgically
Physiopathology : paradoxical LF- AS despite preserved EF Pronounced concentric LV remodelling and smaller LV cavity size ≈ restrictive # Decrease in SV is due to deficient ventricular filling physiology # smaller LV cavity size # deficient ventricular emptying # Intrinsic myocardial dysfunction causing EF lower than expected (50 -60%) # Prevalence increases with - older age - female gender - concomitant systemic HTN
Impact of AVR on Survival in Patients With Paradoxical LF-LG AS Tarantini G, Covolo E, Razzolini R, et al. Valve replacement for severe aortic stenosis with low transvalvular gradient and left ventricular ejection fraction exceeding 0. 50. The Annals of Thoracic Surgery, Volume 91(6), 1808– 1815, 2011
Role of cardiac catheterization AS v Cardinal indications: - left ventricular failure, angina pectoris, or syncope. v Discrepancy between echo findings and patient symptoms v What information can be obtained in AS ? - estimation of gradient - estimation of valve area - level of stenosis - valve resistance
Methods of measuring a transvalvular gradient in AS 1. LV via transseptal, AO catheter retrograde above AO valve 2. LV retrograde with pressure wire, AO catheter retrograde above AO valve 3. LV retrograde with pigtail, AO catheter retrograde above AO valve 4. LV and AO retrograde with dual lumen pigtail 5. LV retrograde with pigtail, AO pressure from side arm of long sheath 6. LV retrograde with pigtail, AO pressure from side is of
Simultaneous LV and central Aortic pressures in severe AS Ideal method
METHOD EASE OF USE DISADVANTAGE PULLBACK +++++ LEAST ACCURATE FEMORAL SHEATH +++++ PRESSURE AMPLIFICATION ILIAC ARTERY STENOSIS DOUBLE ARTERIAL PUNCTURE +++ EXTRA VASCULAR ACCESS RISK PIG TAIL- DOUBLE LUMEN +++ DAMPING TRANSEPTAL ++ RISK
Artifacts can result when a multiple-side-hole pigtail catheter is incompletely advanced into the LV chamber
Peripheral amplification # increase in peak systolic pressure and pulse pressure in peripheral arteries as compared to the central aorta Simultaneous measurement of aortic and FA pressure demonstrating peripheral amplification
A. The tracings demonstrating the significant time delay for the pressure waveform to reach the RFA. B. Realignment using tracing paper.
v Peak aortic pressure and LV pressures are temporarily separated v Gradient described as # Peak-peak # Peak instantaneous # Mean gradient v Peak-peak gradient: - absolute difference between peak Ao systolic pressure and peak LVSP v Peak instantaneous gradient: - max. gradient between Ao and LV at single point in time v Mean Gradient :
peak-to-peak gradient measured by catheterization is lower than the peak instantaneous gradient measured by echo v Doppler data # Peak instantaneous gradient over time v Cath data # Peak to peak data v calculated mean pressure Gradients are comparable
Carabello Sign v rise in arterial blood pressure during left heart catheter pullback in patients with severe aortic stenosis v Mechanism : related to partial obstruction of an already narrowed aortic orifice by the retrograde catheter & relief of this obstruction when the catheter is withdrawn AVA<0. 6 c m 2
Aorta pull back tracing- level of stenosis Supra Valvular AS Sub valvular AS
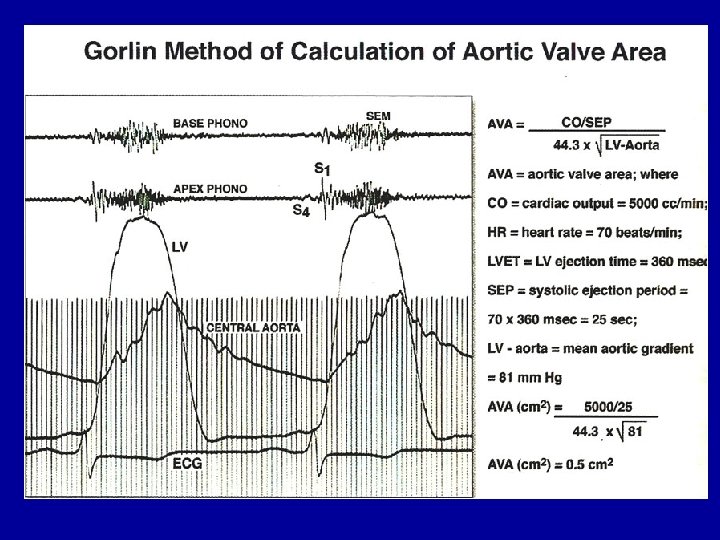
Calculation of stenotic valve area v GORLIN FORMULA: 1. Torricelli's law: flow across a round orifice F = AV CC A = F VC C F = flow rate A = orifice area V = velocity of flow C C = coefficient of orifice contraction 2. relates pressure gradient and velocity of flow - Torricelli's law V = velocity of flow Cv = coefficient of velocity - correcting for energy loss as pressure energy is converted to kinetic or velocity energy h = pressure gradient in cm H 2 O g = gravitational constant (980 cm/sec 2) for converting cm H O to units of
v GORLIN FORMULA: C = empirical constant accounting for CV and CC h = mm Hg (rather than cm H 2 O) C - empirical constant ( 0. 85 for mitral valve, 1. 0 for Aortic valve)
Flow (F) = is the total cardiac output expressed in terms of the seconds per minute during which there is actually forward flow across the valve. F= CO (ml or cm 3/min) SEP (sec/min) x HR cm 3 x min Min x Sec cm 3 /sec
Hakki formula Heart rate x SEP or DFP x constant ≈1
Mean GD Automated computerized analysis
Hypertension + aortic stenosis Ø Concomitant hypertension mask the signs of AS severity Ø Evaluation of AS severity - performed when BP control is optimal Ø Progression of valvulo-arterial disease - pseudo-normalization of BP due to a reduction in SV v LV : faces a double pressure overload - develop symptoms at an earlier age
Conclusion # Pressure recovery : Catheterization v/s Doppler gradient # Newer parameters for severity of AS - Energy loss index - Valvulo-arterial impedance # diagnosis of severe AS should be based on results for AVA and indexed AVA rather than on gradients # Paradoxical low flow-low gradient AS : better prognosis if treated surgically than medically
References 1. Braunwald's Heart Disease: A Textbook Of Cardiovascular Medicine 9 th Edition 2. Grossman's Cardiac Catheterization, Angiography, & Intervention, 7 th Edition 3. Otto And Bonow : Valvular Heart Diseases 4. Kern- Hemodynamics 5. George A. Stouffer Cardiovascular Hemodynamics For The Clinician 6. Yang-hemodynamics 7. Morton G Kern-cardiac Catherization 8. Kanu-chaterjee-text Book Of Cardiovascular Medicine 9. Hemodynamic Rounds –Kern 10. Regosta- Hemodynamics 11. Uptodate – aortic stenosis Journals 1. Jaac 2. Circulation 3. Can J Cardiol 4. Europian Heart Journal 5. Bmj Heart 6. Chest Journal
Thank you
1. What is the calculated aortic valve area by Gorlins formula from the following parameters? # CO-4400 ml/min, # SEP- 0. 5 sec, # HR-50 beat/min # Mean aortic gradient =100 mm. Hg a) 0. 7 cm 2 b) 0. 2 cm 2 c) 0. 9 cm 2 d) 0. 4 cm 2
2. common pitfalls in the estimation of aortic valve area in the catheterization lab all except? a) Peripheral amplification b) Aortoiliac stenosis c) Aortic regurgitation d) Low gradient AS e) Alignment match
3. True regarding Carabello’s sign except? a) rise in pulse pressure by > 5 mm Hg when a catheter is removed from the LV b) Phenomenon is seen in aortic valve area < 0. 6 cm 2 c) Not seen when AVA> 0. 7 cm 2 d) Mechanism: additional occlusive effect of the catheter across the valve – decreasing aortic pressure
4. True about paradoxical low flow-low gradient AS except? a) LVEF> 50% b) Indexed AVA <0. 6 cm 2/m 2 c) Stroke volume index< 35 ml/m 2 d) Mean Gradient < 50 mm. Hg
5. In Dobutamine SE- pseudo severe AS is identified by a) Peak stress Mean gradient <30 mm. Hg b) Peak stress EOA > 0. 6 cm 2 c) absolute increase in EOA > 0. 3 cm 2 d) Stroke volume < 35 ml/m 2
6. True about Paradoxical LF-LG severe AS except? a) More in females b) Prevalence decreases with age c) Prevalence Increases with concomitant systemic HTN d) AVR (class II a recommendation ) is better than Medical treatment
7. True regarding hypertension and aortic stenosis except? a) Hypertension mask AS severity b) Pseudo normalization of blood pressure occurs c) HTN + AS – vary late onset of AS symptoms d) LV faces more global LV hemodynamic load
8. True regarding contractile reserve except? a) Increase in stroke volume of ≥ 30% above baseline b) Lower contractile reserve –higher peri-operative mortality after AVR c) mean improvement in In LVEF more in higher contractile reserve patients with severe AS after AVR d) Improvement in NYHA class- similar in high and low contractile reserve groups with severe AS
9. All are features of paradoxical low- flow , low gradient AS except? a) Increased global LV hemodynamic load -⇈ed Zva b) Smaller and relatively thicker LV c) intrinsic myocardial dysfunction d) Survival better after medical management than AVR
10. True about Energy loss index (ELI) except? a) Cut-off value for severe AS < 0. 55 cm 2/ m 2 b) Less flow dependent than gradient or peak velocity c) Takes into account pressure recovery d) Equivalent to EOA measured by catheter e) Measured in patients with large aorta ( size >35 mm)
Valve resistance v mean pressure gradient divided by the flow rate ratio. v UNIT = dyne-seconds cm− 5 v > 300 dyne-seconds cm− 5 ➨ severe aortic stenosis
Hypertrophic cardiomyopathy v dynamic intraventricular pressure gradient v no systolic pressure gradient at rest v gradient - provoked with : Valsalva maneuver : extra systole : systemic vasodilator (amyl nitrate) : inotropic stimulation
HOCM : spike-and- dome configuration of pulse wave v dynamic outflow obstruction ➨ characteristic arterial pressure waveform “spike-and-dome v early spike ➨ rapid LV ejection by the hypercontractile configuration myocardium v pressure dip & doming ➨ reflect the dynamic outflow obstruction
LV and FA pressure tracings in HCM Valsalva maneuver : produces a marked increase in the gradient : change in the FA pressure waveform to a spike-and-
Brokenbrough-Braunwald-Morrow sign v Post PVC potentiation in HOCM v PVC ➨⇈in intracavitary gradient ➨⇈ed contractility (⇈ed Ca 2+) # Post PVC beat is associated with a reduction in aortic systolic pressure and pulse pressure ≈ B-B-M sign