Mechanical Properties Of Metals II 6 1 Plastic


![• Calculate the resolved shear stress on the (111) [0 1 1] slip](https://slidetodoc.com/presentation_image_h/0e7746547b59ab96960548278c045504/image-12.jpg "• Calculate the resolved shear stress on the (111) [0 1 1] slip")


 • Brittle fractures are due to defects like Ø")

 • Also used to find the temperature range for ductile to")


.")


")


 • Creep rupture test is same as creep test")


- Slides: 66
Mechanical Properties Of Metals - II 6 -1
Plastic Deformation in Single Crystals • Plastic deformation of single crystal results in step markings on surface slip bands. • Atoms on specific crystallographic planes (slip planes) slip to cause slip bands. Slip bands 6 -29
Slip Bands and Slip Planes • Slip bands in ductile metals are uniform (occurs in many slip planes). • In single crystals of ductile FCC metals like copper and aluminum, slip occurs on multiple slip planes, as a result the slipband pattern on the surface of metal is more uniform. 6 -30
Slip Bands and Slip Planes • Slip has occurred on many slip planes within the slipbands. • These fine steps are called slip lines and are usually about 50 to 500 atoms apart, whereas slipbands are commonly separated by 10, 000 atom diameters.
Slip Mechanism • During shear, atoms do not slide over each other in large perfect metal crystals. • The slip occurs due to movement of dislocations. Wall of high dislocation density Dislocation cell structure in lightly deformed Aluminum 6 -31
Slip in Crystals • Slip occurs in densely or close packed planes. • Lower shear stress is required for slip to occur in densely packed planes. • If slip is restricted in close-packed planes due to local high stress, then less dense planes Close packed plane become operative. • Less energy is required to move atoms along denser planes. Non-close-packed plane 6 -32
Slip Systems • Slip systems are combination of slip planes and slip direction. • Each crystal has a number of characteristic slip systems. • In FCC crystal, slip takes place in {111} octahedral planes and <110> directions. 4 (111) type planes and 3 [110] type directions. 4 x 3 = 12 slip systems. 6 -33
Slip Systems in BCC Crystal • BCC crystals are not close packed. The slip predominantly occurs in {110} planes that has highest atomic density. • Higher shear stress is necessary for BCC than in FCC. 6 -34
Slip Systems in HCP Crystal • If HCP crystals have high c/a ratio, slip occurs along basal planes {0001}. For crystals with low c/a ratio, slip also occurs in {1010} and {1011} planes. 6 -35
Critical Resolved Shear Stress • Critical resolved shear stress is the stress required to cause slip in pure metal single crystal. • Depends upon Ø Ø 6 -36 Crystal Structure Atomic bonding characteristics Temperature Orientation of slip planes relative to shear stress • Slip begins when shear stress in slip plane in slip direction reaches critical resolved shear stress. • This is equivalent to yield stress. • Example : - Zn HCP 99. 999% pure 0. 18 MPa Ti HCP 99. 99% pure 13. 7 MPa Ti HCP 99. 9% pure 90. 1 Mpa Ag FCC 99. 99% pure 0. 48 MPa
Schmid’s Law • The relationship between uniaxial stress action on a single cylinder of pure metal single crystal and resulting resolved shear stress produced on a slip system is give by τr= τ r= Shear Force Shear Area Normal to Slip plane A 1=Area of Slip plane 6 -37 Slip direction
• Calculate the resolved shear stress on the (111) [0 1 1] slip system of a unit cell in an FCC nickel single crystal if a stress of 13. 7 MPa is applied in the [001] direction of a unit cell.
Solution: By geometry the angle between the applied stress and the slip direction is 45 , as shown in Fig. EP 6. 9 a. In the cubic system the direction indices of the normal to a crystal plane are the same as the Miller indices of the crystal plane. Therefore, the normal to the (111) plane that is the slip plane is the [111] direction. From Fig. EP 6. 9 b,
Solution: By geometry the angle between the applied stress and the slip direction is 45 , as shown in Fig. EP 6. 9 a. In the cubic system the direction indices of the normal to a crystal plane are the same as the Miller indices of the crystal plane. Therefore, the normal to the (111) plane that is the slip plane is the [111] direction. From Fig. EP 6. 9 b,
Twinning • In twinning, a part of atomic lattice is deformed and forms mirror image of lattice next to it. • Distance moved by atoms is proportional to their distance from twinning plane. • Deformation from twinning is small. • Twinning reorient the slip system. • Twining is important for deformation in HCP crystals due to its small number of slip systems. 6 -38
Twinning slip twinning
Effects of Grain Boundaries on Strength • Grain boundaries stop dislocation movement and hence strengthen the metals. • Fine grain size is desirable, and hence metals are produced with finer grains. Figure 5. 40 Stress-strain curve of single and polycrystalline copper 6 -39 Figure 5. 40 Slip bands in polycrystalline aluminum grains Figure 5. 40 Dislocations piled up against grain boundaries in stainless steel
Hall Petch Equation • Finer the grains, superior are the mechanical properties (at room temperature). Ø More isotropic properties Ø Less resistant to corrosion and creep Hall-Petch equation - Empirical sy = so + k / (d)1/2 sy = Yield strength d = average grain diameter so and k are constants for a metal. so = 70 Mpa and k = 0. 74 Mpa. m 1/2 for mild steel. • Hall-Petch equation does not apply to (1) extremely fine or coarse grain size and (2) metals used at elevated temperature.
Effects of Plastic Deformation • Plastic deformation results in shearing of grains relative to each other. • The grains elongate in rolling direction. • Dislocations get rearranged. Grain structure at different regions of cartridge brass rolled into a wedge 6 -40
Effects of Plastic Deformation • Grain shape changes with plastic deformation. E. g. With the increase of cold rolling, the grains are more elongated in the rolling direction. Cold-rolled 30% Cold-rolled 50%
Effect of Cold Work on Tensile Strength • Number of dislocations are increased by cold work. • Dislocation movements are hindered by both grain Strain Hardening boundaries and other dislocations • In cold working, new dislocations are created by the cold deformation and interact with those already existing, create “forest of dislocations”. Cold working is used for strengthening some metals. 6 -41
We wish to produce a 0. 040 -in thick sheet of oxygen free copper with a tensile strength of 45 ksi. What percent cold work must the metal be given? What must the starting thickness of the metal be before cold rolling?
Solid Solution Strengthening • Addition of one or more metals can increase the strength of metals. • Solute atoms, on case of substitutional solid solution, create stress fields around themselves and hinder the dislocation movement. • Distortion of lattice and clustering of like atoms also impede dislocation movement. • Example: Solid solution of 70 wt % Cu & 30 wt % Zn (cartridge brass) has tensile strength of 500 MPa. Tensile strength of unalloyed copper is 330 MPa 6 -42
Recovery and Recrystallization of Plastically Deformed Metal • The reduced ductility of the cold-worked metal is undesirable, thus, a softer metal is required through reheating. • When metal is reheated in a sufficiently high temperature for a long enough time, the coldworked metal will go through a series of changes : (1) recovery, (2) recrystallization, (3)grain growth • This reheating treatment that softens a cold-worked metal is called annealing.
Recovery and Recrystallization of Plastically Deformed Metal
Recovery and Recrystallization of Plastically Deformed Metal Stress-relieved at 302 degree Celsius for 1 hour Annealed at 316 degree Celsius for 1 hour
Recovery and Recrystallization of Plastically Deformed Metal • When cold-worked metal is heated in the recovery temperature, internal stress in the metal are relieved. • During recovery, thermal energy is supplied to allow dislocations to rearrange themselves into lower energy configurations. • Upon heating at high temperature, new strain-free grains are nucleated in the recovered metal structure and begin to grow recrystallized structure. • Important factors that affect recrystallization process are: (1) amount of prior deformation of the metal, (2) temperature, (3) time, (4) initial grain size, (5) composition of the metal or alloy.
Recovery and Recrystallization of Plastically Deformed Metal • A minimum amount of deformation of metal is necessary for recrystallization to be possible. • Increase of temperature for recrystallization decreases the time necessary to complete it. • The larger the original gain size, the greater the amount of deformation required to produce an equivalent recrystallization structure. • The recrystallization temperature decreases with increasing purity of the metal.
Recovery and Recrystallization of Plastically Deformed Metal 1018 -Cold Rolled 1018 -Annealed Stress-Strain curves of 1018 steel 6 -41
Superplasticity in Metals • At elevated temperature and slow loading rate, some alloys deform 2000%. • Annealed Ti alloy Ø Elongates 12% at room temperature Ø Elongates up to 1170% at 870 o. C and 1. 3 x 10 -4/s loading rate. • Conditions: very fine grain size (5 -10 microns) * Highly strain sensitive * Temperature above 0. 5 Tm * Slow strain rate
Mechanism of Superplasticity • Very limited dislocation activity • Deformation mechanism: Ø Grain boundary sliding Ø Grain boundary diffusion Ø Sliding and rotation of individual grains. • Applications: Metal forming operations. Ø Blow forming to produce automobile hoods. Grains before and after deformation
Superplasticity in Metals
Nanocrystalline Metals • Average grain diameter < 100 nm • Results in high strength and hardness, and Superplasticity • If grain diameter reduces from 10 microns to 10 nm, yield strength of copper increases 31 times. • Very difficult to produce nanocrystalline metals. • If d < 5 nm, elastic modulus drops as more atoms are in grain boundary • Hall-Petch equation is invalid in lower nanocrystalline range.
Material Failure • Failure may be defined as the inability of a material to (1) perform the intended function , (2) meet performance criteria although it may still be operational (3) perform safely and reliably even after deterioration. • Fracture of material and its potential effect on productivity, safety, and other economical issues are important aspects for material design and selection. • Safety factor are used in analysis and essentially overdesigning the component or machine.
Fracture of Metals – Ductile Fracture • Fracture results in separation of stressed solid into two or more parts. • Ductile fracture : High plastic deformation & slow crack propagation. • Three steps : Ø Specimen forms neck and cavities within neck. Ø Cavities form crack and crack propagates towards surface, perpendicular to stress. Ø Direction of crack changes to 450 resulting in cup-cone fracture. 7 -7
Fracture of Metals – Ductile Fracture
Brittle Fracture • No significant plastic deformation before fracture. • Common at high strain rates and low temperature. • Three stages: Ø Plastic deformation concentrates dislocation along slip planes. Ø Microcracks nucleate due to shear stress where dislocations are blocked. Ø Crack propagates to fracture. SEM of ductile fracture • Example: HCP Zinc ingle crystal under high stress along {0001} plane undergoes brittle fracture. SEM of brittle fracture 7 -8
Ductile and Brittle Fractures Ductile fracture Brittle Fracture
Brittle Fractures (cont. . ) • Brittle fractures are due to defects like Ø Folds Ø Undesirable grain flow Ø Porosity Ø Tears and Cracks Ø Corrosion damage Ø Embrittlement due to atomic hydrogen • At low operating temperature, ductile to brittle transition takes place.
Toughness and Impact Testing • Toughness is a measure of energy absorbed before failure. • Impact test measures the ability of metal to absorb impact. Toughness is measured using impact testing machine Place a Charpy V-notch specimen across parallel jaws in the machine, then release a heavy pendulum from a known height. 7 -9
Impact testing (Cont…) • Also used to find the temperature range for ductile to brittle transition. Figure 6. 15 Figure 6. 16 • Sinking of Titanic: Titanic was made up of steel which has ductile brittle transition temperature 320 C. On the day of sinking, sea temperature was – 20 C which made the structure highly brittle and susceptible to more damage. 7 -10 (After J. A. Rinebolt and W. H. Harris, Trans. ASM, 43: 1175(1951))
How is the Charpy Impact Energy used? • The charpy impact test can be used to assess the relative toughness of different materials, e. g. steel and aluminum, as a tool for materials selection in design. It may also be used for quality control, to ensure that the material being produced reaches a minimum specified toughness level. • Difficulties arise when you attempt to answer questions such as "What impact toughness must my steel have if I'm to make an oil rig which will be subjected to have impact in the North Sea at sub-zero temperatures? " • Design problems such as this can be tackled by the use of a minimum impact energy for the service temperature, which is based on previous experience. For example, it was found that fractures of the steel plate in Liberty ships in the 1940's only occurred at sea temperatures for which the impact energy of the steel was 20 J. This data was used to select steels for future ship designs. This approach is often still used to specify minimum impact energy for material selection, though the criteria are also based on correlations with fracture mechanics measurements and calculations. » It's interesting to note that the impact energy of steel recovered from the Titanic was found to be very low (brittle) at -2°C. This was the estimated sea temperature at the time of the iceberg impact.
Design Strategy: Stay above the DBTT! • Pre-WWII: The Titanic Reprinted w/ permission from R. W. Hertzberg, "Deformation and Fracture Mechanics of Engineering Materials", (4 th ed. ) Fig. 7. 1(a), p. 262, John Wiley and Sons, Inc. , 1996. • WWII: Liberty ships Reprinted w/ permission from R. W. Hertzberg, "Deformation and Fracture Mechanics of Engineering Materials", (4 th ed. ) Fig. 7. 1(b), p. 262, John Wiley and Sons, Inc. , 1996. • Problem: Used a type of steel with a Ductile to Brittle Transition Temperature ~ Room temp
Fracture Toughness • Cracks and flaws cause stress concentration. K 1 = Stress intensity factor. σ = Applied stress. a = edge crack length Y = geometric constant. KIc = critical value of stress intensity factor. (Fracture toughness) 7 -11 Example: Al 2024 T 851 26. 2 MPam 1/2 4340 alloy steel 60. 4 MPam 1/2
Measuring Fracture Toughness A notch is machined in a specimen of sufficient thickness B. B>>a plain strain condition. B = 2. 5(KIc/Yield strength)2 Specimen is tensile tested. Higher the KIc value, more ductile the metal is. • Used in design to find allowable flaw size. • • • Figure 6. 18 7 -12 Courtesy of White Shell research)
Fatigue of Metals • Metals often fail at much lower stress at cyclic loading compared to static loading. • Crack nucleates at region of stress concentration and propagates due to cyclic loading. • Failure occurs when cross sectional area of the metal too small to withstand applied Fracture started here load. Fatigue fractured surface of keyed shaft Final rupture 7 -13 (After “Metals Handbook, ” vol 9, 8 th ed. , American Society of Metals, 1974, p. 389)
Fatigues Testing • Alternating compression and tension load is applied on metal piece tapered towards center. Figure 6. 21 Figure 6. 20 • Stress to cause failure S and number of cycles required N are plotted to form SN curve. 7 -14 (After H. W. Hayden, W. G. Moffatt, and J. Wulff, “The structure and Properties of Materials, ” vol. III, Wiley, 1965, p. 15. )
Cyclic Stresses • Different types of stress cycles are possible (axial, torsional and flexural). Figure 6. 24 Mean stress = Stress range = 7 -15 Stress amplitude = Stress range =
Structural Changes in Fatigue Process • Crack initiation first occurs. • Reversed directions of crack initiation caused surface ridges and groves called slipband extrusion and intrusion. • Crack growth changes direction to be perpendicular to maximum tensile stress (rate microns/sec). • Sample ruptures when Persistent slip bands remaining cross-sectional area In copper crystal is small to withstand the stress. Figure 6. 26 7 -16 Courtesy of Windy C. Crone, University of Wisconsin
Factors Affecting Fatigue Strength • Stress concentration: Fatigue strength is reduced by stress concentration. • Surface roughness: Smoother surface increases the fatigue strength. • Surface condition: Surface treatments like carburizing and nitriding increases fatigue life. • Environment: Chemically reactive environment, which might result in corrosion, decreases fatigue life. 7 -17
Fatigue Crack Propagation Rate • • • Notched specimen used. Cyclic fatigue action is generated. Crack length is measured by change in potential produced by crack opening. 7 -18(After “Metals Handbook, ” Vol 8, 9 th ed. , American Society of Metals, 1985, p. 388. )
Stress & Crack Length Fatigue Crack Propagation. σ2 ΔN σ1 Δa α f(σ, a) ΔN Δa • When ‘a’ is small, da/d. N is also small. • da/d. N increases with increasing crack length. • Increase in σ increases crack growth rate. = fatigue crack growth rate. ΔK = Kmax-Kmin = stress intensity factor range. A, m = Constants depending on material, environment, frequency temperature and stress ratio. 7 -19
Fatigue Crack Growth rate Versus ΔK Straight line with slope m Limiting value of ΔK below Which there is no measurable Crack growth is called stress intensity factor range threshold ΔKth Figure 6. 29 7 -20 (After P. C. Paris et al. Stress analysis and growth of cracks, STP 513 ASTM, Philadelphia, 1972, PP. 141 -176
Fatigue Life Calculation But Therefore Integrating from initial crack size a 0 to final crack size af at number of fatigue cycles Nf Integrating and solving for Nf (Assuming Y is independent of crack length) 7 -21
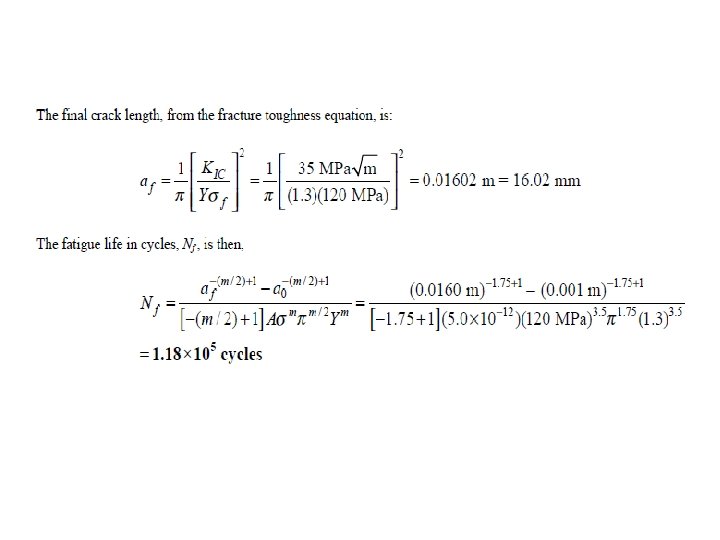
• A large flat plate is subjected to constantamplitude uniaxial cyclic tensile and compressive stresses of 120 and 35 MPa, respectively. If before testing the largest surface crack is 1. 00 mm and the plain-strain fracture toughness of the plate is 35 , estimate the fatigue life of the plate in cycles to failure. Assume for the plate, m = 3. 5, A =5. 0 X 10 -12, and Y = 1. 3.
Creep in Metals • Creep is a progressive deformation under constant stress over a period of time. • Important in high temperature applications. • Primary creep: creep rate • decreases with time due to strain hardening. • Secondary creep: Creep rate is constant due to simultaneous strain hardening and recovery process. • Tertiary creep: Creep rate increases with time leading to necking and fracture. 7 -22
Creep Test • Creep test determines the effect of temperature and stress on creep rate. • Metals are tested at constant stress at different temperature & constant temperature with different stress. High temperature or stress Medium temperature Creep rate= or stress Creep strength: Stress to produce Low temperature Minimum creep rate of 10 -5%/h or stress At a given temperature. 7 -23
Creep Test (Cont. . ) • Creep rupture test is same as creep test but aimed at failing the specimen. • Plotted as log stress versus log rupture time. • Time for stress rupture decreases with increased stress and temperature. 7 -24 (After H. E. Mc. Gannon [ed]. “ The making, shaping and Treating of Steel, ” 9 th ed. , United States Steel, 1971, p. 1256
Larsen Miller Parameter • Larsen Miller parameter is used to represent creep-stress rupture data. P(Larsen-Miller) = T[log tr + C] T = temperature(K), tr = stress-rupture time h C = Constant (order of 20) Also, or P(Larsen-Miller) = [T(0 C) + 273(20+log tr)] P(Larsen-Miller) = [T(0 F) + 460(20+log tr)] • At a given stress level, the log time to stress rupture plus constant multiplied by temperature remains constant for a given material. 7 -25
Larsen Miller Parameter If two variables of time to rupture, temperature and stress are known, 3 rd parameter that fits L. M. parameter can be determined. Example: For alloy CM, at 207 MPa, LM parameter is 27. 8 x 10³ K Then if temperature is known, time to rupture can be found. 7 -26 (After “Metals Handbook, ” vol 1, 10 th ed. , ASM International, 1990, p. 998. )
L. M. Diagram of several alloys Example: Calculate time to cause 0. 2% creep strain in gamma Titanium aluminide at 40 KSI and 12000 F. Given P=38000, Larsen Miller Equation: P(Larsen-Miller) = [T(0 F) + 460(20+log tr)] 38000 = (1200 + 460) (log t 0. 2% + 20) t=776 h 7 -27 After N. R. Osborne et. al. , SAMPE Quart, (4)22; 26(1992)
Case Study – Analysis of Failed Fan Shaft • Requirements Ø Ø Function – Fan drive support Material 1045 cold drawn steel Yield strength – 586 Mpa Expected life – 6440 Km (failed at 3600 km) • Visual examination (avoid additional damage) Ø Failure initiated at two points near fillet Ø Characteristic of reverse bending fracture
Failed Shaft – Further Analysis • Tensile test proved yield strength to be 369 MPa (lower than specified 586 MPa). • Metallographic examination revealed grain structure to be equiaxed ( cold drawn metal has elongated grains). • Conclusion: Material is not cold drawn – it is hot rolled !. Ø Lower fatigue strength and stress raiser caused the failure of the shaft.
Recent Advances: Strength + Ductility A schematic of the stress strain diagrams for microcrystalline (curve A), nanocrystalline (curve B), and mixed grain (curve C) pure copper
Recent Advances: Strength + Ductility • Coarse grained – low strength, high ductility • Nanocrystalline – High strength, low ductility (because of failure due to shear bands). • Ductile nanocrystalline copper : Can be produced by Ø Cold rolling at liquid nitrogen temperature Ø Additional cooling after each pass Ø Controlled annealing • Cold rolling creates dislocations and cooling stops recovery • 25 % microcrystalline grains in a matrix of nanograins.