Making motor vehicle accident reconstruction work for you


![Estimating deceleration factors Situation Deceleration [m/s 2] High performance tires on dry asphalt and Estimating deceleration factors Situation Deceleration [m/s 2] High performance tires on dry asphalt and](https://slidetodoc.com/presentation_image_h/1755aaa22f18632785204f5690c947c3/image-32.jpg)


- Slides: 51

Making motor vehicle accident reconstruction work for you

Learning objectives Participants will be able to. Identify the basic elements and appreciate the limitations for conducting a scientific accident reconstruction Apply a strategy that will help ensure that all potential parties are included in the process of fault determination Ask crucial questions for the selection of an appropriate experts

An accident causation model Road Vehicle Behavior

Haddon matrix The Haddon Matrix Phase Exemplar factors Human Vehicles and Equipment Environment Pre-Crash Prevention Information Attitudes Impairment Enforcement Road worthiness Lighting Braking Stability Speed management Road design Speed limits Pedestrian facilities Crash Injury Prevention during the crash Use of restraints Out-of-position Occupant restraints Other safety devices Crash protective Roadside objects Post-crash Life-sustaining First aid skill Access to medics Ease of access Fire risk Rescue facilities Congestion

Human behavior as the cause Speeding: - Reduces the time and space for taking corrective actions Impairment including fatigue: - Reduces the driver’s ability to follow an appropriate path - Increases the driver’s reaction time Distraction: - Reduces the driver’s ability to follow an appropriate path - Reduces the time and space for taking corrective actions - Increases the driver’s reaction time

Manifestations of technical defects Tire blow-out: - Increases the rolling resistance of the affected wheel - Decreases the available side force on that wheel Brake failure: - Decreases the deceleration rate - Can introduce a steering moment Steering failure: - Decreases the response to steering input Sticking throttle: - Decreases rolling resistance and deceleration rate when simultaneously braking Structural collapse or wheel separation: - Introduces a steering moment at the affected corner

Technical defects as the cause Collision damage can obscure or may be mistaken for a vehicle defect: - Collision forces are high enough to bend or separate suspension parts and rip off a wheel - Brake hoses and tires can be punctured by damaged sheet metal

Road and environmental factors Glare, fog and other visual obstructions: - Reduces the driver’s ability to see the appropriate travel path and recognize traffic Road debris, oil spill, black ice, etc. : - Can introduce a steering moment - Decreases deceleration rate when braking Hydroplaning: - Decreases the available side force on the affected wheels

Injury causation Crashworthiness: - For impact directions that can be anticipated for common traffic situations and roadway designs, and for an impact severity that is high enough to cause injuries, but not catastrophically high, the vehicle structure should afford maximum occupant protection Restraints and their use: - The proper use and functioning of occupant protection systems, including seat belts, air bags, child seats, head rests, and seat backs should be evaluated by technical inspection under consideration of medical records and witness marks Pre-existing medical conditions: -The analysis of applicable research and statistical data correlating traffic accident injuries to the collision type and severity predicts if pre-existing medical conditions were present

Crash responsibility matrix Vehicle Precrash At Occupant(s) Road and Environ ment Technical Inappropriat Unpredicta defects e behavior ble at and posted impairme speed, nt road defects Crashwort Restraint Incompatib

Anatomy of a motor vehicle crash Environmental conditions Driver actions and condition Technical state of the vehicles Road conditions and control devices Collision Speed and approach of vehicles, cycles or pedestrians Collision Precrash: Postcrash: Path of vehicles and cyclists or pedestrian trajectories including secondary collisions Occupant, cyclist and pedestrian injuries Vehicle damages including fire or flood damage Evidence of rescue efforts

Collision phase Outside the vehicle: Magnitude and direction of force Overlap between collision partners Over- or under-ride Rate of vehicle deformation Glancing blows In the passenger compartment: Occupant interaction with seat belts, air bags, interior trim, child restraints, and with each other Intrusion of vehicle structural parts and foreign objects into passenger compartment Out-of-position occupants

Scene photo and vehicle damages

Vehicle damage is an indicator for the position of the vehicles at impact Matching and analysis of the structural deformations establishes the point of momentum exchange

Crush measurement methods Crush jigs, 3 -D scanners and total stations provide accuracy and high resolution of deformation profiles

Photogrammetry Geometrical dimensions of objects and locations of road marks can be approximated from photos with computer programs

Collision Deformation Classification Police accident reports typically employ some form of the CDC scheme Overlay sheets for police accident reports can be found on the ACTAR website

Repair estimates Dollar figures on repair estimates don’t indicate the collision severity because part prices and labor rates vary widely by manufacturer

Point of momentum exchange To determine the point of momentum exchange the vehicle structure and the collision damage have to be evaluated This point is never the first point of contact

Vehicle damage is a measure of deformation energy The “Conservation of Energy” theorem dictates that kinetic energy of the vehicles is transformed into deformation energy EES catalogues and crash test data are used to compare the actual vehicle crush to deformations on vehicles or cycles with comparable structures that were created under known conditions With further consideration of the collision circumstances the speed loss (Δv) at impact can be determined

Deformation energy Energy grids for a 4 -cylinder and a 6 -cylinder M-B model 123 illustrate the influence of stiff aggregates on overall deformation characteristics

EES values Published formulas for the calculation of approximate EES values for selected Mercedes-Benz vehicle models

EES catalogues

Tire marks and vehicle rest positions indicate vehicle paths Distances, surface friction characteristics and the status of the wheels and brakes establish the post-collision speed

Tire mark tracing Tracing of tire marks from rest to the collision position establishes how far the center of gravity (CG) travelled and where the vehicle was headed in interim positions

Marks on the road. Collision scrubs and gouge marks Collision scrubs are short, usually wide, dark marks made on the pavement by the tires of a vehicle due to the sudden change in travel direction caused by a collision A gouge mark is a mark in the pavement, deep enough to be felt with the fingers, caused by a metal portion of the vehicle digging into the roadway

Marks on the road. Skid marks and yaw marks A friction mark on the pavement made by a tire that is sliding without rotation Skid marks typically start out light, become progressively darker and end abruptly A tire mark on the pavement created by a rotating tire which is slipping sideways

Marks on the road. Acceleration scuffs A mark made when sufficient power is applied to the driving wheels to make at least one of them spin on the road surface Acceleration scuffs typically start out as a dark spot and gradually disappear

Instantaneous center of rotation The instantaneous center of rotation at any point along the vehicle path after the collision can be constructed from a minimum of two tire marks Center of gravity Instantaneous center of rotation The slip angle β is formed between the velocity vector and the longitudinal axis of the vehicle

Sources for vehicle dimensions Transport Canada Vehicle Specification Database FORD TRUCKS EDGE 4 DR SUV FWD SEL/LIMITED EXPLORER SPORT TRAC P/U 4 DR 4 X 2 A 106 132 B 218 273 C 41 47 D 84 78 The TC database is free, while AAMA charges about $50. 00 per vehicle, and the Mitchell catalog covering domestic vehicles goes for about $450. 00 E 113 109 F 96 91 G 98 112 WB 282 331 OL 475 534 OW 190 187 OH 168 183 CW 1853 2048 TF 163 154 TR 167 157 WD 60/40 56/44

Determining deceleration factors In collisions where the vehicle is still drivable (E. g. low-speed impacts, pedestrian, and bicycle collision) the drag factor can be measured with an accelerometer or a fifth wheel Drag sleds are widely used
![Estimating deceleration factors Situation Deceleration ms 2 High performance tires on dry asphalt and Estimating deceleration factors Situation Deceleration [m/s 2] High performance tires on dry asphalt and](https://slidetodoc.com/presentation_image_h/1755aaa22f18632785204f5690c947c3/image-32.jpg)
Estimating deceleration factors Situation Deceleration [m/s 2] High performance tires on dry asphalt and concrete 6. 5 … 9. 0 High performance tires on wet asphalt 5. 0 … 7. 0 High performance tires on new, wet concrete 6. 0 … 8. 0 High performance tires on old, wet concrete 5. 0 … 7. 0 M+S tires on dry asphalt and concrete 6. 0 … 8. 0 M+S tires on wet asphalt 5. 0 … 6. 0 Tires on dry cobble stone 6. 0 … 8. 0 Tires on wet cobble stone 4. 0 … 7. 0 Tires on dry compacted sand gravel surfaces 5. 0 … 6. 0 Tires on wet compacted sand gravel surfaces 4. 0 … 5. 0 Tires on dry grass on supportive underground 4. 5 … 6. 0 Tires on wet grass on supportive underground 3. 0 … 4. 0 Tires on wet supportive underground 2. 0 … 3. 0 Tires on snow covered road surfaces 1. 0 … 3. 0 Tires on icy road surface (depending on ice temperature) 0. 5 … 3. 0 Tires rolling on dry surface (depending on selected gear) 0. 5 … 2. 5

Deceleration and acceleration factor adjustments for vertical curves Downhill braking: ares = a - tanα g Uphill braking: ares = a + tanα g Downhill acceleration: ares = a + tanα g Uphill acceleration: ares = a - tanα g

Deceleration and acceleration factor adjustments for slip angle β a’ = amax [PB cos β + (1 – PB) sin β] a’ = amax [-PB cos β (1 – PB) sin β] a’ = amax [PB cos β (1 – PB) sin β] These formulas are not valid for partially braked vehicles at slip angles of around 90º and 270º: -When sliding sideways a’ will always approach amax regardless of the partial braking factor PB

Friction circle Available side force is limited by used circumferential force

Partial braking factors Approximations for one-wheel model 1 - PB Free rolling wheels: Fs/FS, max 0. 1 1 wheel deflated: 0. 15 1 wheel locked: 0. 25 2 wheels deflated : 0. 3 2 wheels locked on one side: 0. 5 2 front wheels locked: 0. 7 4 wheels locked: 1. 0 PB FU/FU, max

Conservation of linear and angular momentum I = mv D = θω Application of theorem to vehicle- or cycle paths into and out of the collision calculates the impact speed when the speed and directions after the impact is known

Model limitations Motions are projected onto a flat plane and don’t consider vertical motion components The assumption of infinitely small impact time doesn’t allow any motions or directional changes during the impact phase Tire forces are neglected (Small compared to impact forces) The point of momentum exchange between the collision partners needs to be determined based on damage and structural characteristics (Usually not the first or last contact point)

Straight central impact ε is the ratio of the speed differences after and before the collision: ε = 1: -elastic impact (no deformation) ε = 0: -plastic impact (no rebound)

Drive-balance diagram I 1’= m 1 v 1’ II 1= m 1 v 1 m = I 2 ’ The directions of the vehicles before the collision are estimated from road features or tire marks 2 v 2’ The directions and amounts of the speeds after the collision are known from tracing the marks on the road I 2 = m 2 v 2

Constructing the drive-balance diagram After selecting an appropriate scale: 1. Draw the vectors for the post-collision speed arrow to arrow 2. Draw lines parallel to the direction vectors of the vehicles that intersect at the ends of the post-collision speed vectors 3. Balance about the post-collision speed vectors until the distances to the direction vectors of the vehicles are equal 4. Calculate impact speeds from length of I 1 and I 2

Rotational speed control Θ can be approximated from the wheelbase R and overall length of the vehicle: ω’ has to be close to ω*

Calculation inputs and results for examplar crash

Presentation of reconstruction results (“So, und nicht anders, ist es gewesen”) Verbal reports, written reports, diagrams, animations, and results of simulation computer programs should always include or be accompanied by the following information: - Vehicle, cycle or pedestrian direction and speed before impact - Speed change (Δv) during impact - References for EES assumptions - Vehicle and cycle direction and speed after impact - Maximum acceleration values employed along post-collision travel paths and distances travelled - Vehicle data, including length, width, wheelbase, and weight - Assumed weight of occupants and cargo

Simulation Employs equations of motions and mathematical vehicle- and occupant models for matching damage, injuries and tire marks

Time-distance analysis At standstill Braking Speed loss from impact Braking Driving Accelerating At standstill Helps to evaluate reaction times and what-if scenarios for the preventability of the collision

Time, distance, speed equations

Crash data retrieval systems Downloading data from Event Data Recorders (EDRs) currently requires multiple adapter tools and extensive training If the direction and speed of one vehicle are known the construction of the drive-balance diagram gets more simple

Automatic Collision Notification ACN will drive the implementation of Event Data Recorders (EDRs) in the future, likely trumping privacy concerns of some manufacturers

Automatic Collision Notification

Questions?
 Accident reconstruction formula sheet
 Cosmic superclass in java
 Provision for depreciation
 Bumper height
 Canadian motor vehicle safety standards
 Massachusetts department of motor vehicles
 What fracture
 International motor vehicle inspection committee
 2020 motor vehicle deaths
 World motor vehicle production
 Georgia motor carrier compliance division
 One direction songs with alliteration
 Three phase synchronous generator
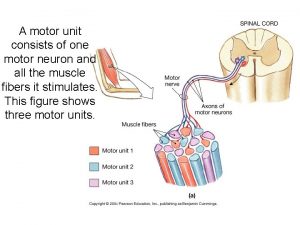
 A motor unit is
 Pony motor starting synchronous motor
 Motor parts name
 Pony motor starting synchronous motor
 Works simple present
 Making inferences
 War making and state making as organized crime
 Fspos vägledning för kontinuitetshantering
 Typiska drag för en novell
 Tack för att ni lyssnade bild
 Vad står k.r.å.k.a.n för
 Varför kallas perioden 1918-1939 för mellankrigstiden?
 En lathund för arbete med kontinuitetshantering
 Särskild löneskatt för pensionskostnader
 Personlig tidbok
 Sura för anatom
 Vad är densitet
 Datorkunskap för nybörjare
 Stig kerman
 Att skriva debattartikel
 Delegerande ledarskap
 Nyckelkompetenser för livslångt lärande
 Påbyggnader för flakfordon
 Formel för lufttryck
 Svenskt ramverk för digital samverkan
 Jag har gått inunder stjärnor text
 Presentera för publik crossboss
 Teckenspråk minoritetsspråk argument
 Kanaans land
 Klassificeringsstruktur för kommunala verksamheter
 Fimbrietratt
 Bästa kameran för astrofoto
 Centrum för kunskap och säkerhet
 Verifikationsplan
 Bra mat för unga idrottare
 Verktyg för automatisering av utbetalningar
 Rutin för avvikelsehantering
 Smärtskolan kunskap för livet
 Ministerstyre för och nackdelar

