
Healthy People 2020 Progress Review Violence Across the
- Slides: 89
Healthy People 2020 Progress Review: Violence Across the Lifespan April 18, 2013
Howard K. Koh, MD, MPH Assistant Secretary for Health U. S. Department of Health and Human Services
Progress Review Overview ■ Summarize the impact of violence across the lifespan, including the in effects on health and workplace ■ Provide an update on the progress of Healthy People 2020 objectives ■ Examine what is being done to achieve the Healthy People 2020 objectives
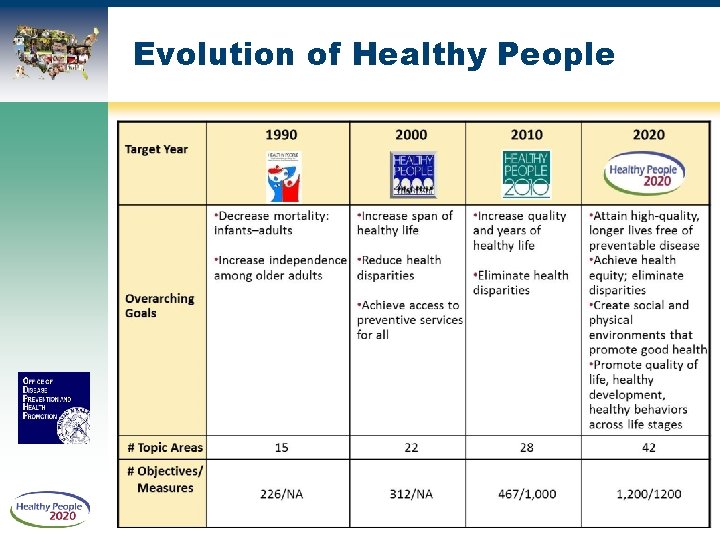
Evolution of Healthy People
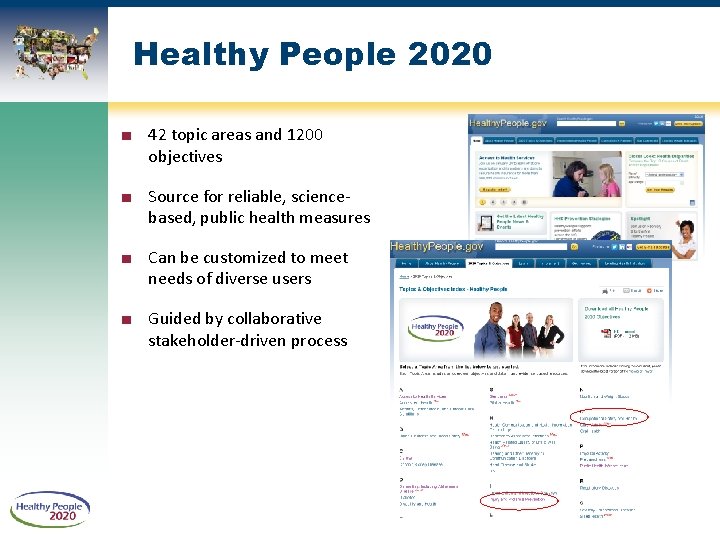
Healthy People 2020 ■ 42 topic areas and 1200 objectives ■ Source for reliable, sciencebased, public health measures ■ Can be customized to meet needs of diverse users ■ Guided by collaborative stakeholder-driven process
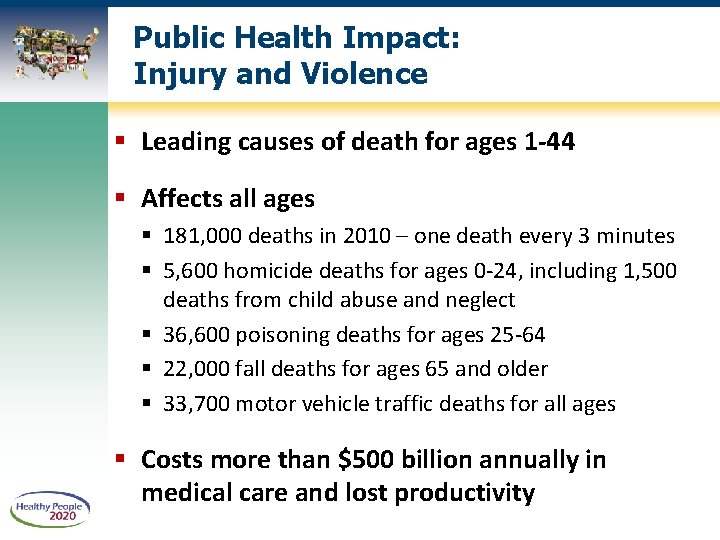
Public Health Impact: Injury and Violence Leading causes of death for ages 1 -44 Affects all ages 181, 000 deaths in 2010 – one death every 3 minutes 5, 600 homicide deaths for ages 0 -24, including 1, 500 deaths from child abuse and neglect 36, 600 poisoning deaths for ages 25 -64 22, 000 fall deaths for ages 65 and older 33, 700 motor vehicle traffic deaths for all ages Costs more than $500 billion annually in medical care and lost productivity
Public Health Impact: Occupational Safety and Health 49, 000 deaths from work-related illnesses (e. g. , respiratory disease, cancer) in 2010 2. 9 million workers injured in 2010 110, 000 hospitalized 4, 690 died 137, 400 work-related assaults seen in emergency departments in 2009 Each year, work-related deaths, injuries, and illnesses cost $250 billion Work-related homicides cost nearly $3 billion in 2003 -2006
Presenters Chair ■ Howard K Koh, MD, MPH Assistant Secretary for Health, HHS Data Presentation ■ Edward Sondik, Ph. D Director, National Center for Health Statistics, CDC Injury and Violence Prevention Topic Area ■ Linda Degutis, Dr. PH, MSN Director, National Center for Injury Prevention and Control, CDC Occupational Safety and Health Topic Area ■ Dawn Castillo, MPH Director of the Division of Safety Research National Institute for Occupational Safety and Health Community Highlight ■ Matt London, MS Health and Safety Specialist New York State Public Employees Federation
Edward J. Sondik, Ph. D Director, National Center for Health Statistics Centers for Disease Control and Prevention
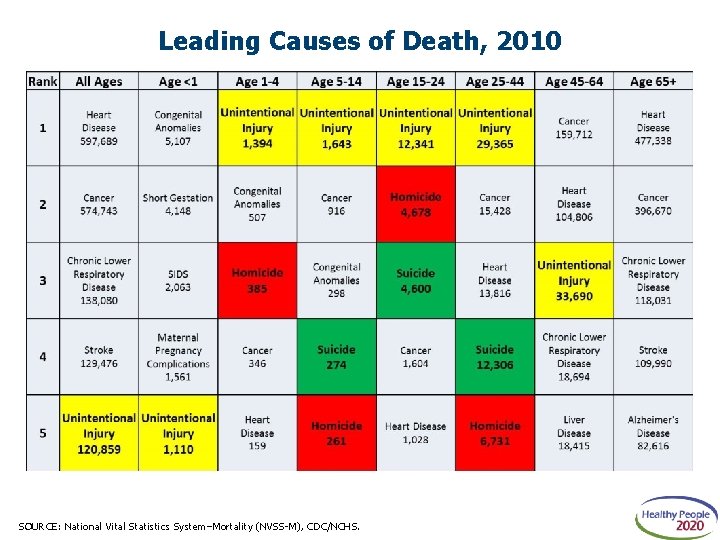
Leading Causes of Death, 2010 SOURCE: National Vital Statistics System–Mortality (NVSS-M), CDC/NCHS.
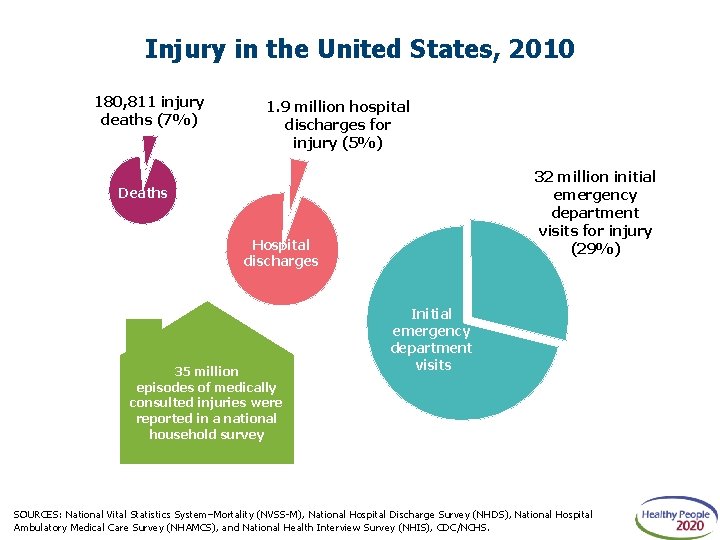
Injury in the United States, 2010 180, 811 injury deaths (7%) 1. 9 million hospital discharges for injury (5%) 32 million initial emergency department visits for injury (29%) Deaths Hospital discharges 35 million episodes of medically consulted injuries were reported in a national household survey Initial emergency department visits SOURCES: National Vital Statistics System–Mortality (NVSS-M), National Hospital Discharge Survey (NHDS), National Hospital Ambulatory Medical Care Survey (NHAMCS), and National Health Interview Survey (NHIS), CDC/NCHS.
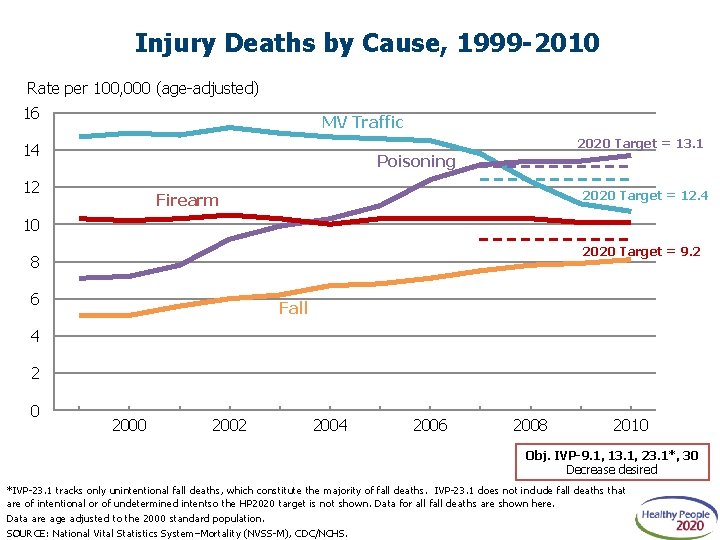
Injury Deaths by Cause, 1999 -2010 Rate per 100, 000 (age-adjusted) 16 MV Traffic 2020 Target = 13. 1 14 Poisoning 12 2020 Target = 12. 4 Firearm 10 2020 Target = 9. 2 8 6 Fall 4 2 0 2002 2004 2006 2008 2010 Obj. IVP-9. 1, 13. 1, 23. 1*, 30 Decrease desired *IVP-23. 1 tracks only unintentional fall deaths, which constitute the majority of fall deaths. IVP-23. 1 does not include fall deaths that are of intentional or of undetermined intentso the HP 2020 target is not shown. Data for all fall deaths are shown here. Data are age adjusted to the 2000 standard population. SOURCE: National Vital Statistics System–Mortality (NVSS-M), CDC/NCHS.
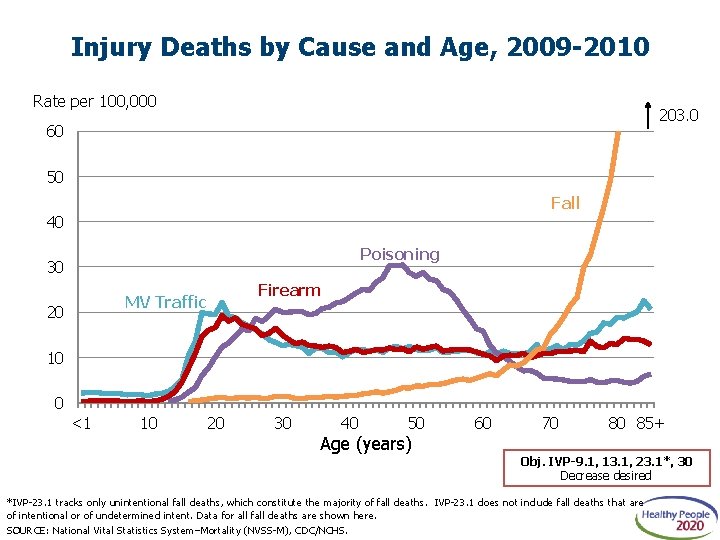
Injury Deaths by Cause and Age, 2009 -2010 Rate per 100, 000 203. 0 60 50 Fall 40 Poisoning 30 MV Traffic 20 Firearm 10 0 <1 10 20 30 40 50 Age (years) 60 70 80 85+ Obj. IVP-9. 1, 13. 1, 23. 1*, 30 Decrease desired *IVP-23. 1 tracks only unintentional fall deaths, which constitute the majority of fall deaths. IVP-23. 1 does not include fall deaths that are of intentional or of undetermined intent. Data for all fall deaths are shown here. SOURCE: National Vital Statistics System–Mortality (NVSS-M), CDC/NCHS.
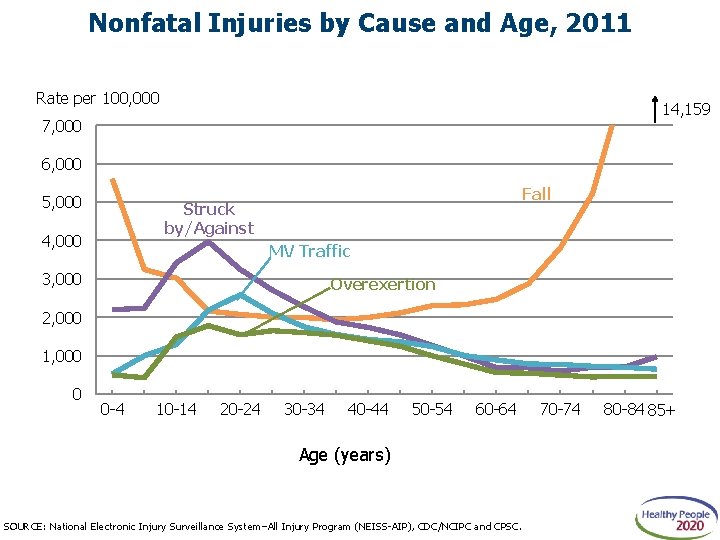
Nonfatal Injuries by Cause and Age, 2011 Rate per 100, 000 14, 159 7, 000 6, 000 5, 000 Fall Struck by/Against 4, 000 MV Traffic 3, 000 Overexertion 2, 000 1, 000 0 0 -4 10 -14 20 -24 30 -34 40 -44 50 -54 60 -64 Age (years) SOURCE: National Electronic Injury Surveillance System–All Injury Program (NEISS-AIP), CDC/NCIPC and CPSC. 70 -74 80 -84 85+
Work-related Injuries
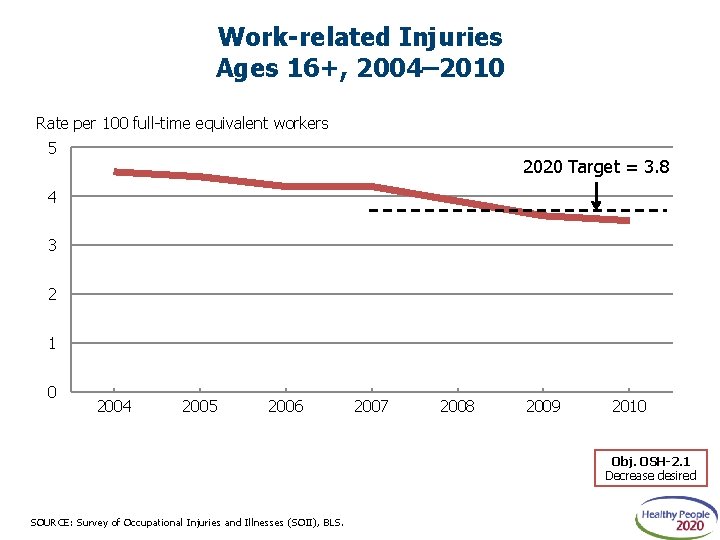
Work-related Injuries Ages 16+, 2004– 2010 Rate per 100 full-time equivalent workers 5 2020 Target = 3. 8 4 3 2 1 0 2004 2005 2006 2007 2008 2009 2010 Obj. OSH-2. 1 Decrease desired SOURCE: Survey of Occupational Injuries and Illnesses (SOII), BLS.
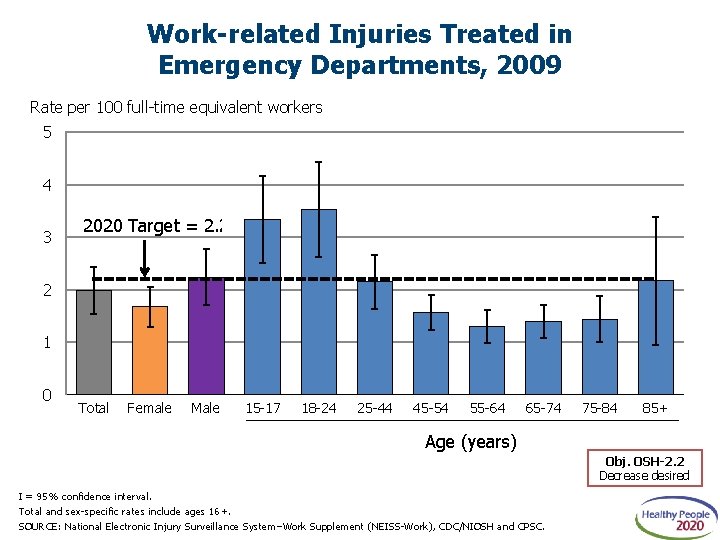
Work-related Injuries Treated in Emergency Departments, 2009 Rate per 100 full-time equivalent workers 5 4 3 2020 Target = 2. 2 2 1 0 Total Female Male 15 -17 18 -24 25 -44 45 -54 55 -64 65 -74 75 -84 85+ Age (years) Obj. OSH-2. 2 Decrease desired I = 95% confidence interval. Total and sex-specific rates include ages 16+. SOURCE: National Electronic Injury Surveillance System–Work Supplement (NEISS-Work), CDC/NIOSH and CPSC.
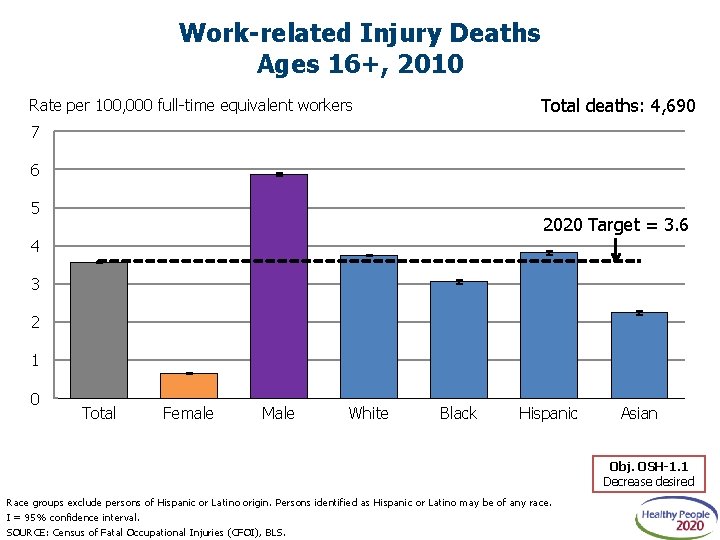
Work-related Injury Deaths Ages 16+, 2010 Total deaths: 4, 690 Rate per 100, 000 full-time equivalent workers 7 6 5 2020 Target = 3. 6 4 3 2 1 0 Total Female Male White Black Hispanic Asian Obj. OSH-1. 1 Decrease desired Race groups exclude persons of Hispanic or Latino origin. Persons identified as Hispanic or Latino may be of any race. I = 95% confidence interval. SOURCE: Census of Fatal Occupational Injuries (CFOI), BLS.
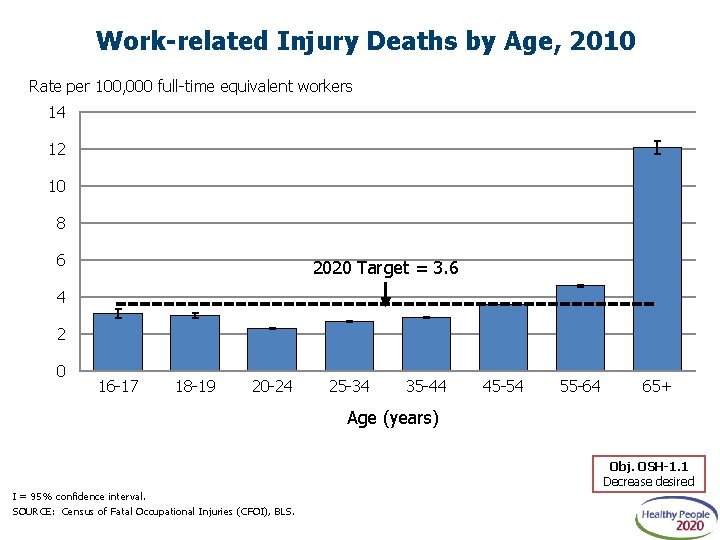
Work-related Injury Deaths by Age, 2010 Rate per 100, 000 full-time equivalent workers 14 12 10 8 6 2020 Target = 3. 6 4 2 0 16 -17 18 -19 20 -24 25 -34 35 -44 45 -54 55 -64 65+ Age (years) Obj. OSH-1. 1 Decrease desired I = 95% confidence interval. SOURCE: Census of Fatal Occupational Injuries (CFOI), BLS.
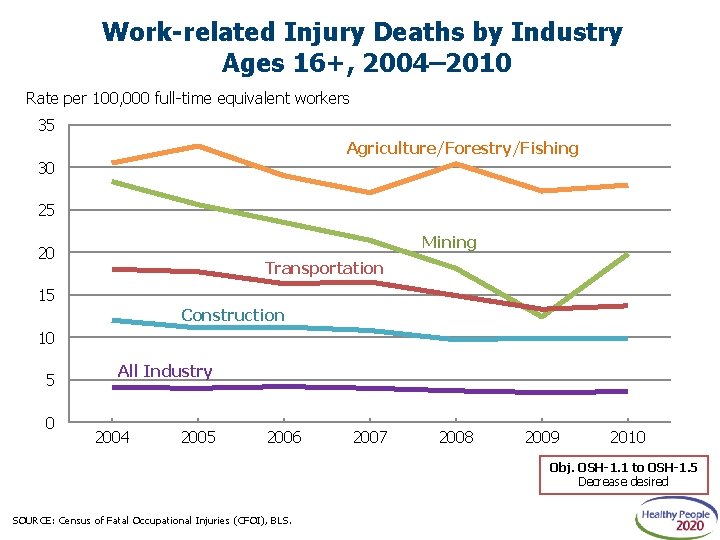
Work-related Injury Deaths by Industry Ages 16+, 2004– 2010 Rate per 100, 000 full-time equivalent workers 35 Agriculture/Forestry/Fishing 30 25 Mining 20 Transportation 15 Construction 10 5 0 All Industry 2004 2005 2006 2007 2008 2009 2010 Obj. OSH-1. 1 to OSH-1. 5 Decrease desired SOURCE: Census of Fatal Occupational Injuries (CFOI), BLS.
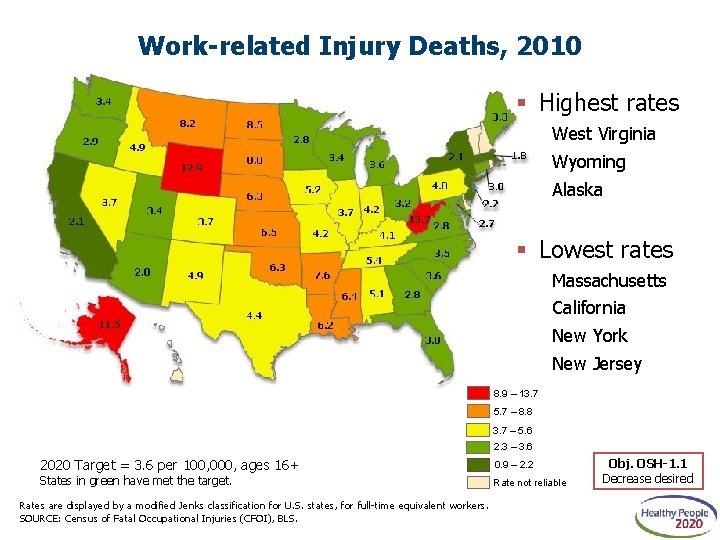
Work-related Injury Deaths, 2010 Highest rates West Virginia Wyoming Alaska Lowest rates Massachusetts California New York New Jersey 8. 9 – 13. 7 5. 7 – 8. 8 3. 7 – 5. 6 2. 3 – 3. 6 2020 Target = 3. 6 per 100, 000, ages 16+ States in green have met the target. Rates are displayed by a modified Jenks classification for U. S. states, for full-time equivalent workers. SOURCE: Census of Fatal Occupational Injuries (CFOI), BLS. 0. 9 – 2. 2 Rate not reliable Obj. OSH-1. 1 Decrease desired
Violence-related Injuries: Assaults and Homicides
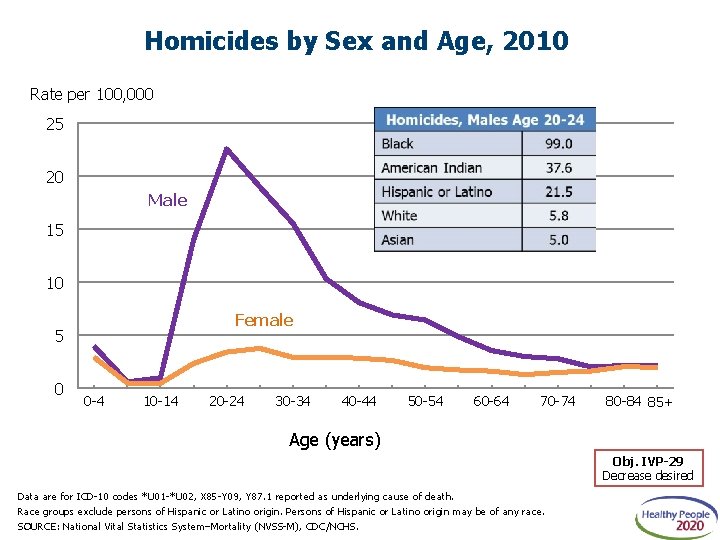
Homicides by Sex and Age, 2010 Rate per 100, 000 25 20 Male 15 10 Female 5 0 0 -4 10 -14 20 -24 30 -34 40 -44 50 -54 60 -64 70 -74 80 -84 85+ Age (years) Obj. IVP-29 Decrease desired Data are for ICD-10 codes *U 01 -*U 02, X 85 -Y 09, Y 87. 1 reported as underlying cause of death. Race groups exclude persons of Hispanic or Latino origin. Persons of Hispanic or Latino origin may be of any race. SOURCE: National Vital Statistics System–Mortality (NVSS-M), CDC/NCHS.
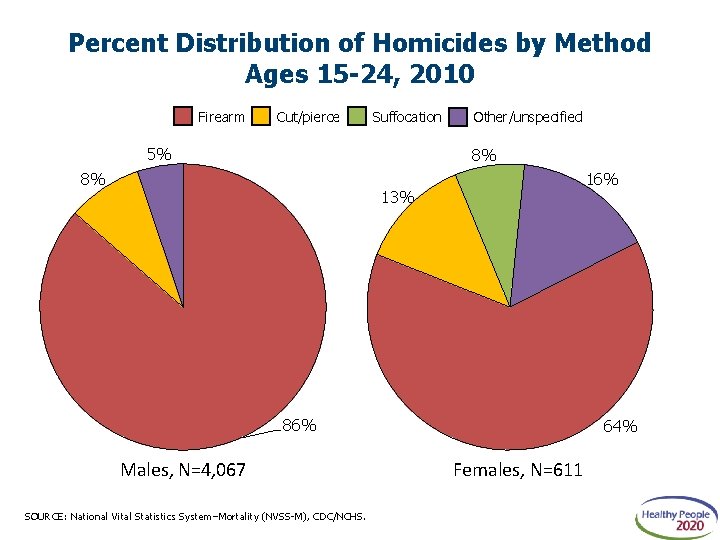
Percent Distribution of Homicides by Method Ages 15 -24, 2010 Firearm Cut/pierce Suffocation 5% Other/unspecified 8% 8% 16% 13% 86% Males, N=4, 067 SOURCE: National Vital Statistics System–Mortality (NVSS-M), CDC/NCHS. 64% Females, N=611
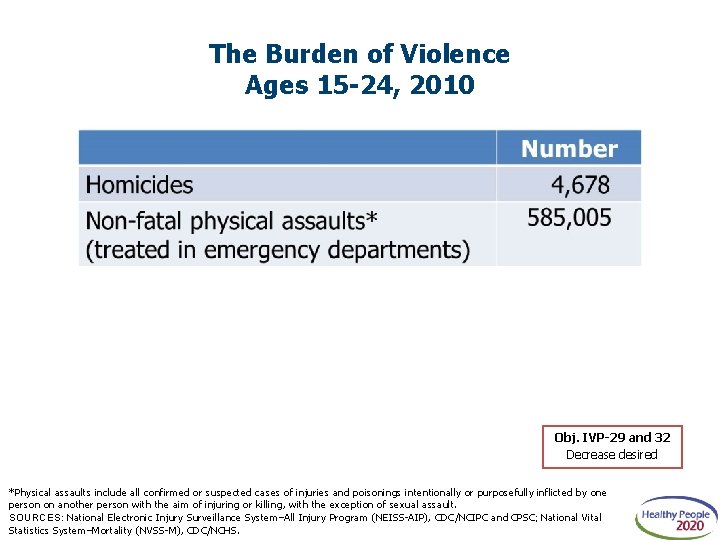
The Burden of Violence Ages 15 -24, 2010 Obj. IVP-29 and 32 Decrease desired *Physical assaults include all confirmed or suspected cases of injuries and poisonings intentionally or purposefully inflicted by one person on another person with the aim of injuring or killing, with the exception of sexual assault. SOURCES: National Electronic Injury Surveillance System–All Injury Program (NEISS-AIP), CDC/NCIPC and CPSC; National Vital Statistics System–Mortality (NVSS-M), CDC/NCHS.
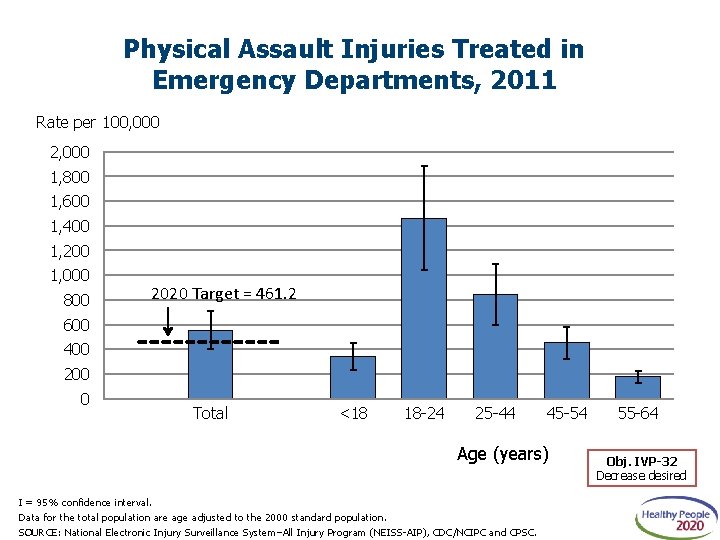
Physical Assault Injuries Treated in Emergency Departments, 2011 Rate per 100, 000 2, 000 1, 800 1, 600 1, 400 1, 200 1, 000 800 2020 Target = 461. 2 600 400 200 0 Total <18 18 -24 25 -44 45 -54 Age (years) I = 95% confidence interval. Data for the total population are age adjusted to the 2000 standard population. SOURCE: National Electronic Injury Surveillance System–All Injury Program (NEISS-AIP), CDC/NCIPC and CPSC. 55 -64 Obj. IVP-32 Decrease desired
Violence Against Children and Adolescents
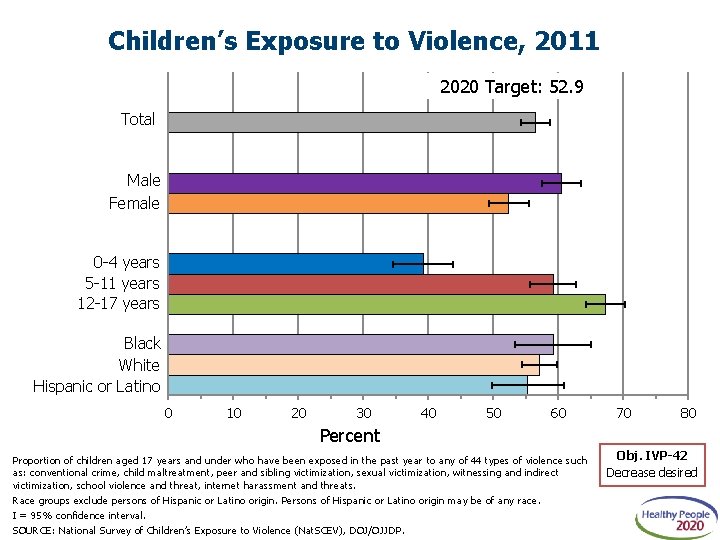
Children’s Exposure to Violence, 2011 2020 Target: 52. 9 Total Male Female 0 -4 years 5 -11 years 12 -17 years Black White Hispanic or Latino 0 10 20 30 40 50 60 70 80 Percent Proportion of children aged 17 years and under who have been exposed in the past year to any of 44 types of violence such as: conventional crime, child maltreatment, peer and sibling victimization, sexual victimization, witnessing and indirect victimization, school violence and threat, internet harassment and threats. Race groups exclude persons of Hispanic or Latino origin. Persons of Hispanic or Latino origin may be of any race. I = 95% confidence interval. SOURCE: National Survey of Children’s Exposure to Violence (Nat. SCEV), DOJ/OJJDP. Obj. IVP-42 Decrease desired
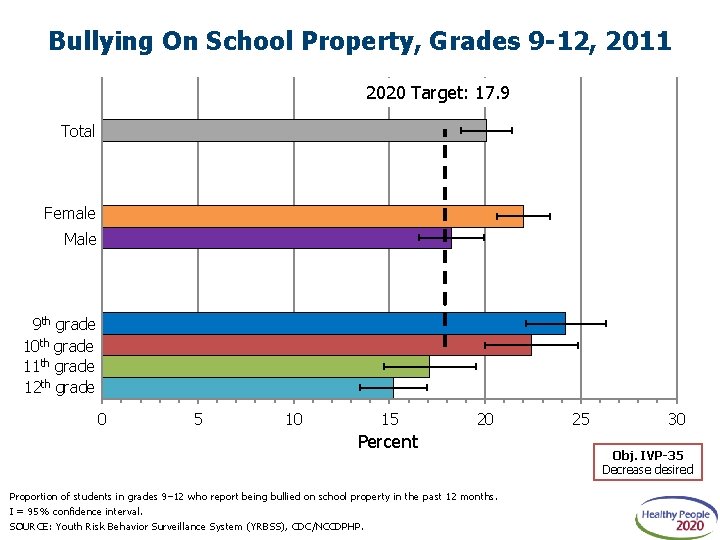
Bullying On School Property, Grades 9 -12, 2011 2020 Target: 17. 9 Total Female Male 9 th grade 10 th grade 11 th grade 12 th grade 0 5 10 15 20 Percent Proportion of students in grades 9– 12 who report being bullied on school property in the past 12 months. I = 95% confidence interval. SOURCE: Youth Risk Behavior Surveillance System (YRBSS), CDC/NCCDPHP. 25 30 Obj. IVP-35 Decrease desired
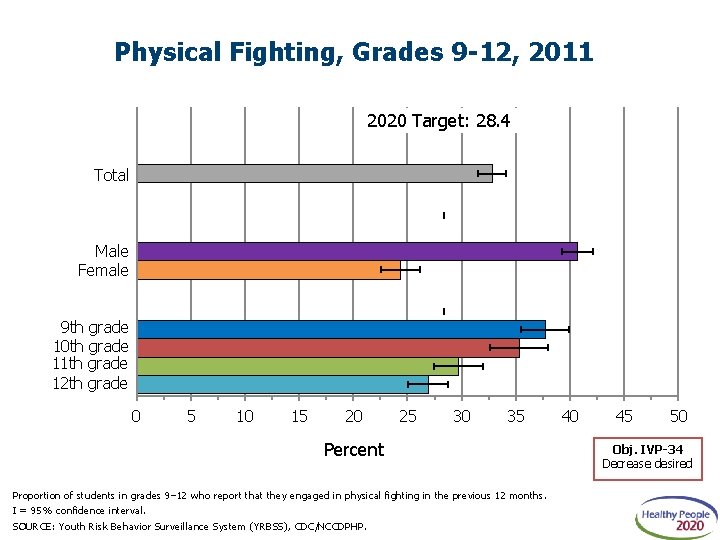
Physical Fighting, Grades 9 -12, 2011 2020 Target: 28. 4 Total Male Female 9 th grade 10 th grade 11 th grade 12 th grade 0 5 10 15 20 25 30 35 Percent Proportion of students in grades 9– 12 who report that they engaged in physical fighting in the previous 12 months. I = 95% confidence interval. SOURCE: Youth Risk Behavior Surveillance System (YRBSS), CDC/NCCDPHP. 40 45 50 Obj. IVP-34 Decrease desired
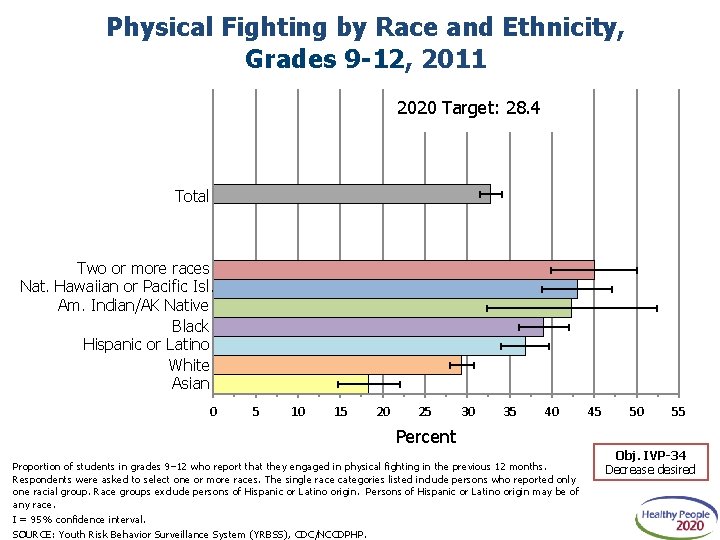
Physical Fighting by Race and Ethnicity, Grades 9 -12, 2011 2020 Target: 28. 4 Total Two or more races Nat. Hawaiian or Pacific Isl. Am. Indian/AK Native Black Hispanic or Latino White Asian 0 5 10 15 20 25 30 35 40 45 50 55 Percent Proportion of students in grades 9– 12 who report that they engaged in physical fighting in the previous 12 months. Respondents were asked to select one or more races. The single race categories listed include persons who reported only one racial group. Race groups exclude persons of Hispanic or Latino origin. Persons of Hispanic or Latino origin may be of any race. I = 95% confidence interval. SOURCE: Youth Risk Behavior Surveillance System (YRBSS), CDC/NCCDPHP. Obj. IVP-34 Decrease desired
Work-related Violence: Assaults and Homicides
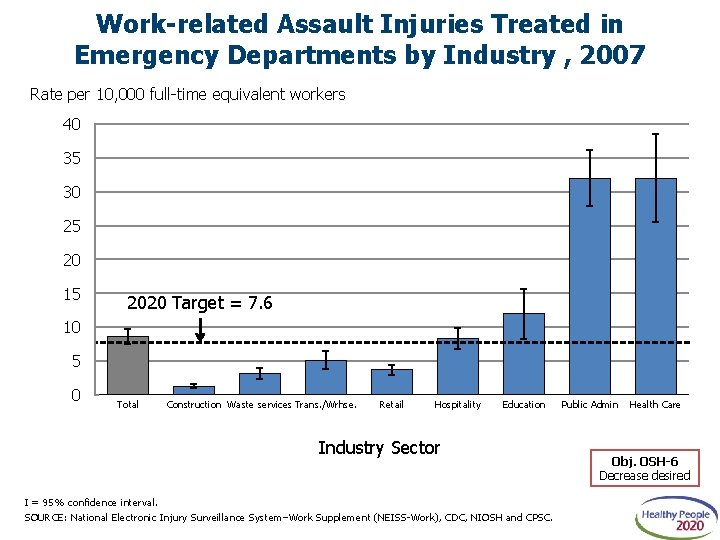
Work-related Assault Injuries Treated in Emergency Departments by Industry , 2007 Rate per 10, 000 full-time equivalent workers 40 35 30 25 20 15 2020 Target = 7. 6 10 5 0 Total Construction Waste services Trans. /Wrhse. Retail Hospitality Education Industry Sector I = 95% confidence interval. SOURCE: National Electronic Injury Surveillance System–Work Supplement (NEISS-Work), CDC, NIOSH and CPSC. Public Admin Health Care Obj. OSH-6 Decrease desired
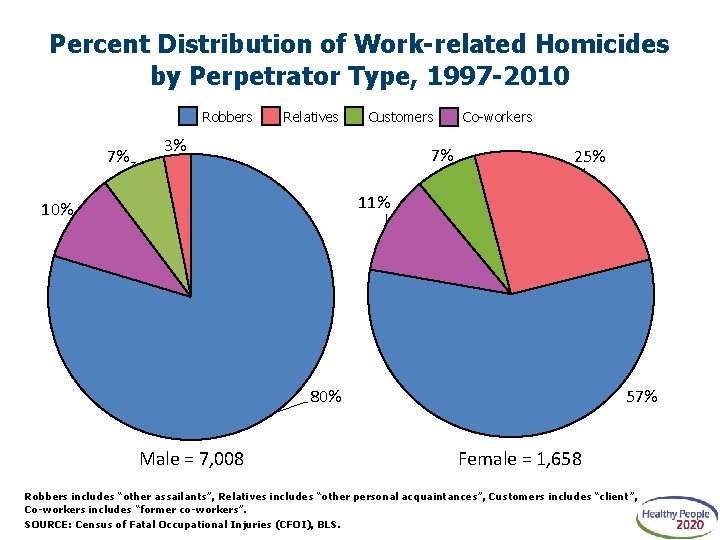
Percent Distribution of Work-related Homicides by Perpetrator Type, 1997 -2010 Robbers 7% Relatives Customers 3% 7% Co-workers 25% 11% 10% 80% Male = 7, 008 57% Female = 1, 658 Robbers includes “other assailants”, Relatives includes “other personal acquaintances”, Customers includes “client”, Co-workers includes “former co-workers”. SOURCE: Census of Fatal Occupational Injuries (CFOI), BLS.
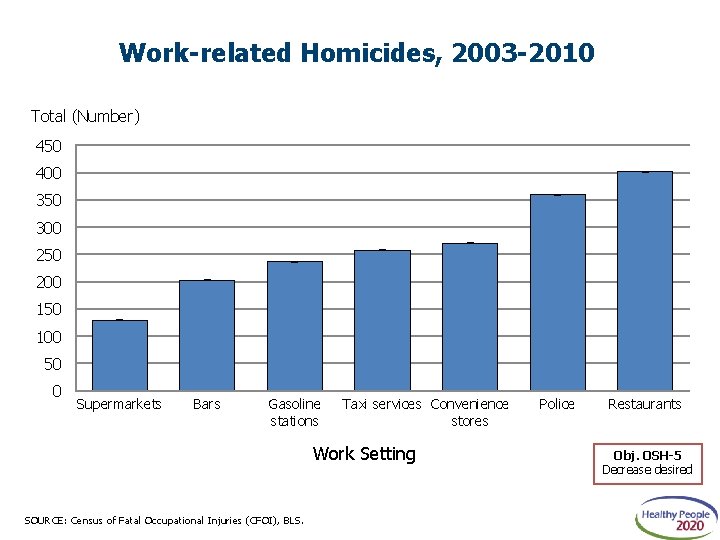
Work-related Homicides, 2003 -2010 Total (Number) 450 400 350 300 250 200 150 100 50 0 Supermarkets Bars Gasoline stations Taxi services Convenience stores Work Setting SOURCE: Census of Fatal Occupational Injuries (CFOI), BLS. Police Restaurants Obj. OSH-5 Decrease desired
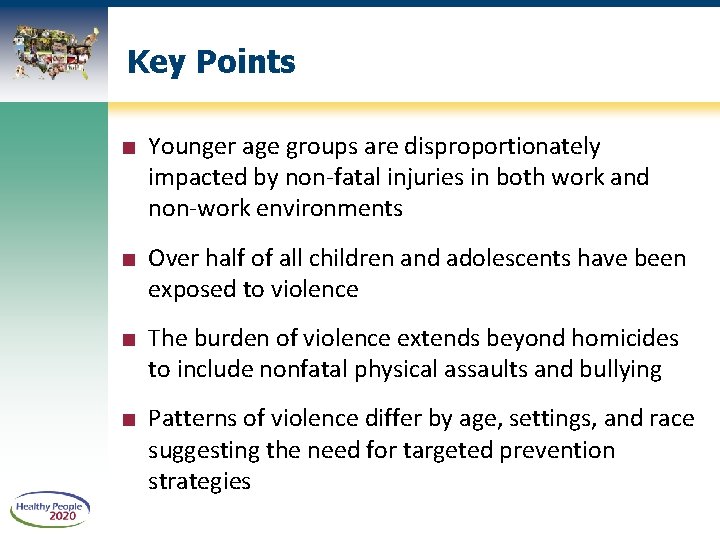
Key Points ■ Younger age groups are disproportionately impacted by non-fatal injuries in both work and non-work environments ■ Over half of all children and adolescents have been exposed to violence ■ The burden of violence extends beyond homicides to include nonfatal physical assaults and bullying ■ Patterns of violence differ by age, settings, and race suggesting the need for targeted prevention strategies
APPENDIX
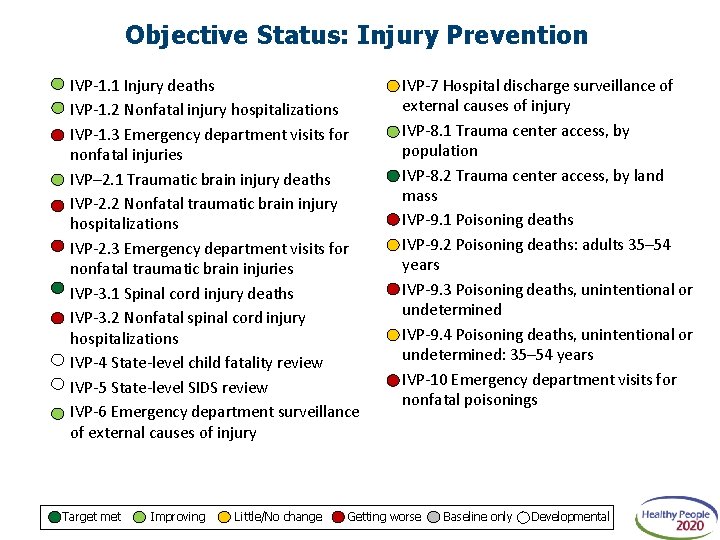
Objective Status: Injury Prevention IVP-1. 1 Injury deaths IVP-1. 2 Nonfatal injury hospitalizations IVP-1. 3 Emergency department visits for nonfatal injuries IVP– 2. 1 Traumatic brain injury deaths IVP-2. 2 Nonfatal traumatic brain injury hospitalizations IVP-2. 3 Emergency department visits for nonfatal traumatic brain injuries IVP-3. 1 Spinal cord injury deaths IVP-3. 2 Nonfatal spinal cord injury hospitalizations IVP-4 State-level child fatality review IVP-5 State-level SIDS review IVP-6 Emergency department surveillance of external causes of injury Target met Improving Little/No change IVP-7 Hospital discharge surveillance of external causes of injury IVP-8. 1 Trauma center access, by population IVP-8. 2 Trauma center access, by land mass IVP-9. 1 Poisoning deaths IVP-9. 2 Poisoning deaths: adults 35– 54 years IVP-9. 3 Poisoning deaths, unintentional or undetermined IVP-9. 4 Poisoning deaths, unintentional or undetermined: 35– 54 years IVP-10 Emergency department visits for nonfatal poisonings Getting worse Baseline only Developmental
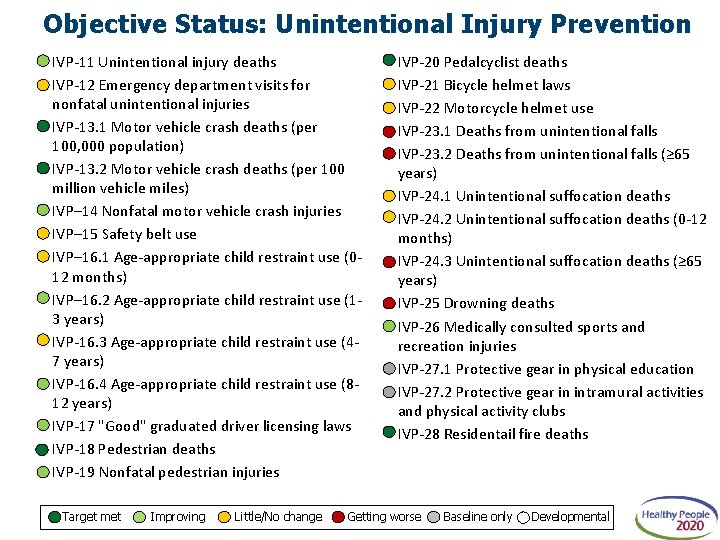
Objective Status: Unintentional Injury Prevention IVP-11 Unintentional injury deaths IVP-12 Emergency department visits for nonfatal unintentional injuries IVP-13. 1 Motor vehicle crash deaths (per 100, 000 population) IVP-13. 2 Motor vehicle crash deaths (per 100 million vehicle miles) IVP– 14 Nonfatal motor vehicle crash injuries IVP– 15 Safety belt use IVP– 16. 1 Age-appropriate child restraint use (012 months) IVP– 16. 2 Age-appropriate child restraint use (13 years) IVP-16. 3 Age-appropriate child restraint use (47 years) IVP-16. 4 Age-appropriate child restraint use (812 years) IVP-17 "Good" graduated driver licensing laws IVP-18 Pedestrian deaths IVP-19 Nonfatal pedestrian injuries Target met Improving Little/No change IVP-20 Pedalcyclist deaths IVP-21 Bicycle helmet laws IVP-22 Motorcycle helmet use IVP-23. 1 Deaths from unintentional falls IVP-23. 2 Deaths from unintentional falls (≥ 65 years) IVP-24. 1 Unintentional suffocation deaths IVP-24. 2 Unintentional suffocation deaths (0 -12 months) IVP-24. 3 Unintentional suffocation deaths (≥ 65 years) IVP-25 Drowning deaths IVP-26 Medically consulted sports and recreation injuries IVP-27. 1 Protective gear in physical education IVP-27. 2 Protective gear in intramural activities and physical activity clubs IVP-28 Residentail fire deaths Getting worse Baseline only Developmental
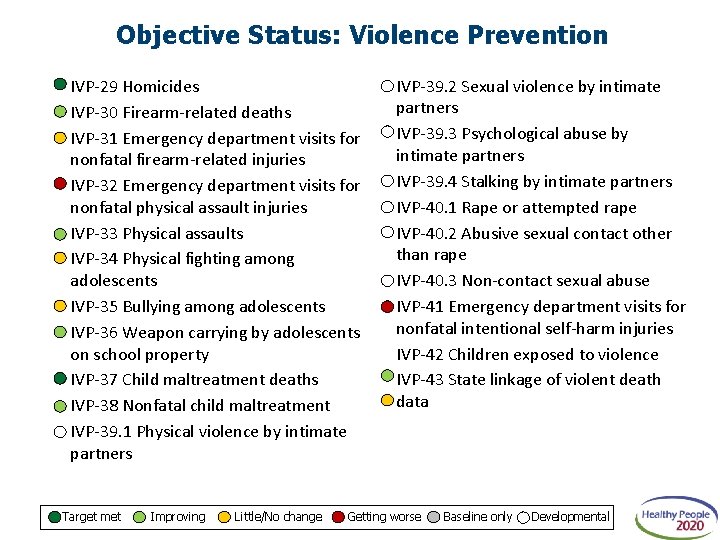
Objective Status: Violence Prevention IVP-29 Homicides IVP-30 Firearm-related deaths IVP-31 Emergency department visits for nonfatal firearm-related injuries IVP-32 Emergency department visits for nonfatal physical assault injuries IVP-33 Physical assaults IVP-34 Physical fighting among adolescents IVP-35 Bullying among adolescents IVP-36 Weapon carrying by adolescents on school property IVP-37 Child maltreatment deaths IVP-38 Nonfatal child maltreatment IVP-39. 1 Physical violence by intimate partners Target met Improving Little/No change IVP-39. 2 Sexual violence by intimate partners IVP-39. 3 Psychological abuse by intimate partners IVP-39. 4 Stalking by intimate partners IVP-40. 1 Rape or attempted rape IVP-40. 2 Abusive sexual contact other than rape IVP-40. 3 Non-contact sexual abuse IVP-41 Emergency department visits for nonfatal intentional self-harm injuries IVP-42 Children exposed to violence IVP-43 State linkage of violent death data Getting worse Baseline only Developmental
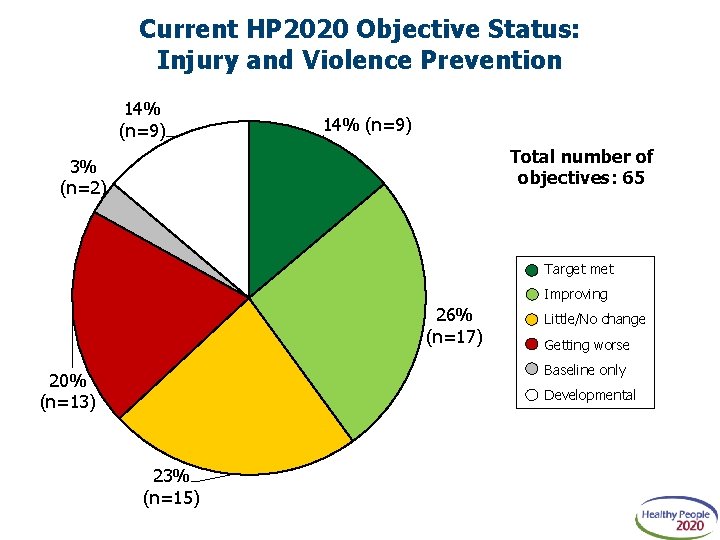
Current HP 2020 Objective Status: Injury and Violence Prevention 14% (n=9) Total number of objectives: 65 3% (n=2) Target met Improving 26% (n=17) Little/No change Getting worse Baseline only 20% (n=13) Developmental 23% (n=15)
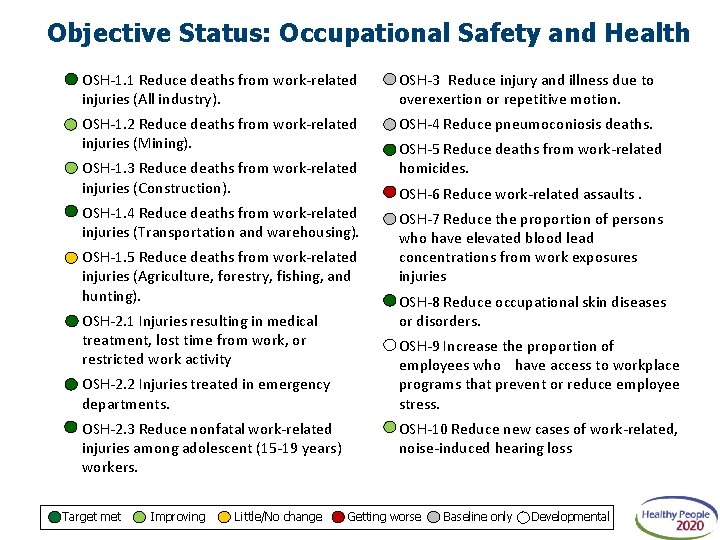
Objective Status: Occupational Safety and Health OSH-1. 1 Reduce deaths from work-related injuries (All industry). OSH-3 Reduce injury and illness due to overexertion or repetitive motion. OSH-1. 2 Reduce deaths from work-related injuries (Mining). OSH-4 Reduce pneumoconiosis deaths. OSH-1. 3 Reduce deaths from work-related injuries (Construction). OSH-1. 4 Reduce deaths from work-related injuries (Transportation and warehousing). OSH-1. 5 Reduce deaths from work-related injuries (Agriculture, forestry, fishing, and hunting). OSH-2. 1 Injuries resulting in medical treatment, lost time from work, or restricted work activity OSH-2. 2 Injuries treated in emergency departments. OSH-2. 3 Reduce nonfatal work-related injuries among adolescent (15 -19 years) workers. Target met Improving Little/No change OSH-5 Reduce deaths from work-related homicides. OSH-6 Reduce work-related assaults. OSH-7 Reduce the proportion of persons who have elevated blood lead concentrations from work exposures injuries OSH-8 Reduce occupational skin diseases or disorders. OSH-9 Increase the proportion of employees who have access to workplace programs that prevent or reduce employee stress. OSH-10 Reduce new cases of work-related, noise-induced hearing loss Getting worse Baseline only Developmental
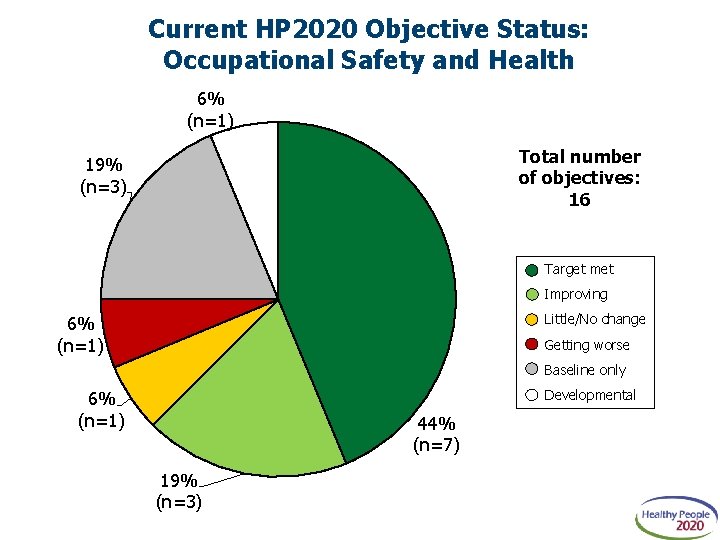
Current HP 2020 Objective Status: Occupational Safety and Health 6% (n=1) Total number of objectives: 16 19% (n=3) Target met Improving Little/No change 6% (n=1) Getting worse Baseline only Developmental 6% (n=1) 44% (n=7) 19% (n=3)
Public Health Impact: Injury and Violence Leading causes of death for ages 1 -44 Affects all ages 181, 000 deaths in 2010 – one death every 3 minutes 5, 600 homicide deaths for ages 0 -24, including 1, 500 deaths from child abuse and neglect 36, 600 poisoning deaths for ages 25 -64 22, 000 fall deaths for ages 65 and older 33, 700 motor vehicle traffic deaths for all ages Costs more than $500 billion annually in medical care and lost productivity
Public Health Impact: Occupational Safety and Health 49, 000 deaths from work-related illnesses (e. g. , respiratory disease, cancer) in 2010 2. 9 million workers injured in 2010 110, 000 hospitalized 4, 690 died 137, 400 work-related assaults seen in emergency departments in 2009 Each year, work-related deaths, injuries, and illnesses cost $250 billion Work-related homicides cost nearly $3 billion in 2003 -2006
Linda C. Degutis, Dr. PH, MSN Director, National Center for Injury Prevention and Control Centers for Disease Control and Prevention
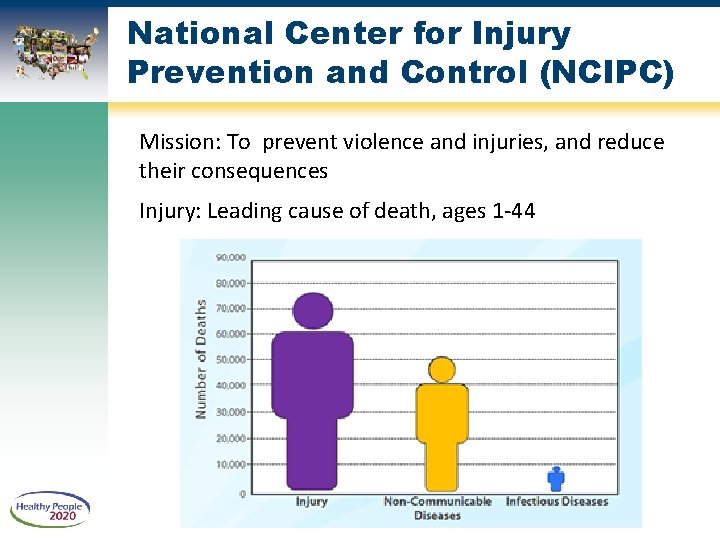
National Center for Injury Prevention and Control (NCIPC) Mission: To prevent violence and injuries, and reduce their consequences Injury: Leading cause of death, ages 1 -44
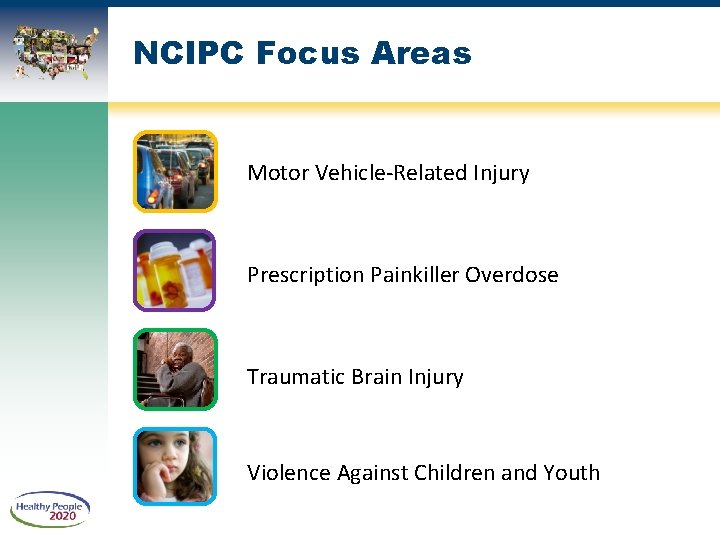
NCIPC Focus Areas Motor Vehicle-Related Injury Prescription Painkiller Overdose Traumatic Brain Injury Violence Against Children and Youth
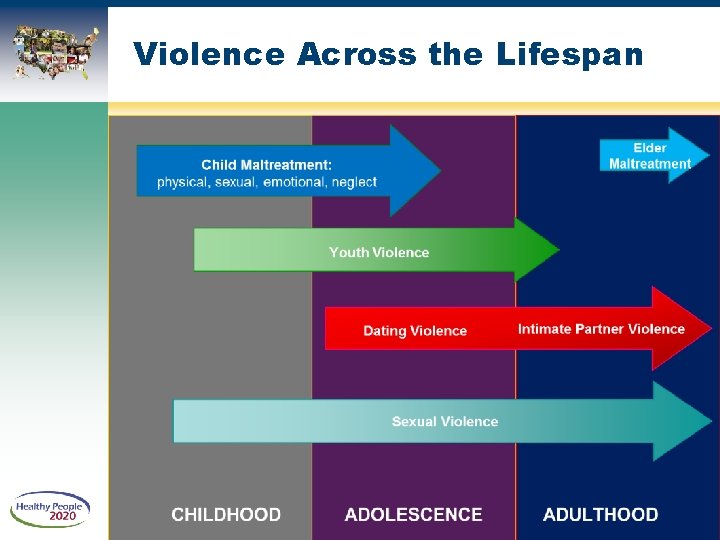
Violence Across the Lifespan
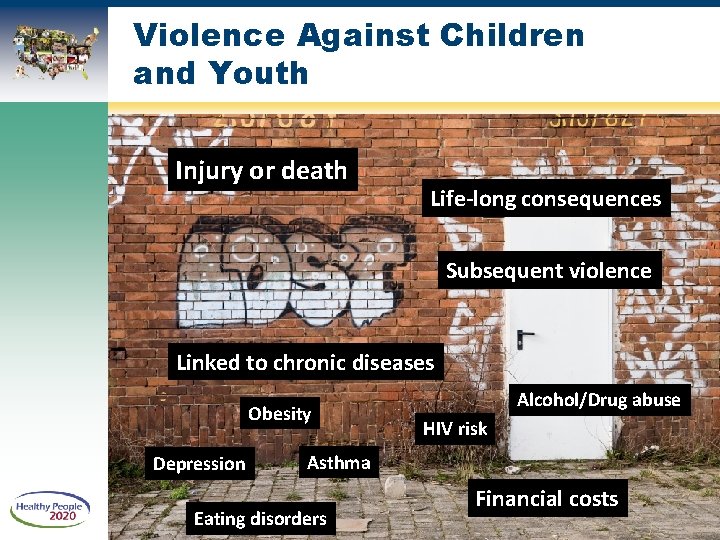
Violence Against Children and Youth Injury or death Life-long consequences Subsequent violence Linked to chronic diseases Obesity Depression Alcohol/Drug abuse HIV risk Asthma Eating disorders Financial costs
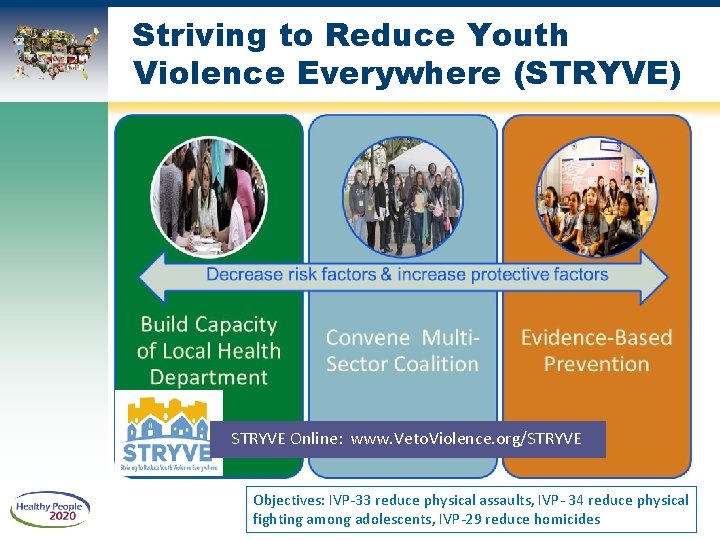
Striving to Reduce Youth Violence Everywhere (STRYVE) STRYVE Online: www. Veto. Violence. org/STRYVE Objectives: IVP-33 reduce physical assaults, IVP- 34 reduce physical fighting among adolescents, IVP-29 reduce homicides
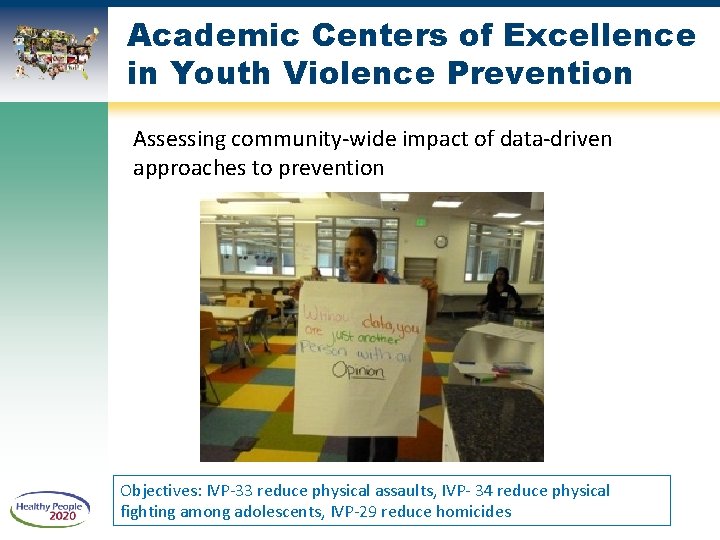
Academic Centers of Excellence in Youth Violence Prevention Assessing community-wide impact of data-driven approaches to prevention Objectives: IVP-33 reduce physical assaults, IVP- 34 reduce physical fighting among adolescents, IVP-29 reduce homicides
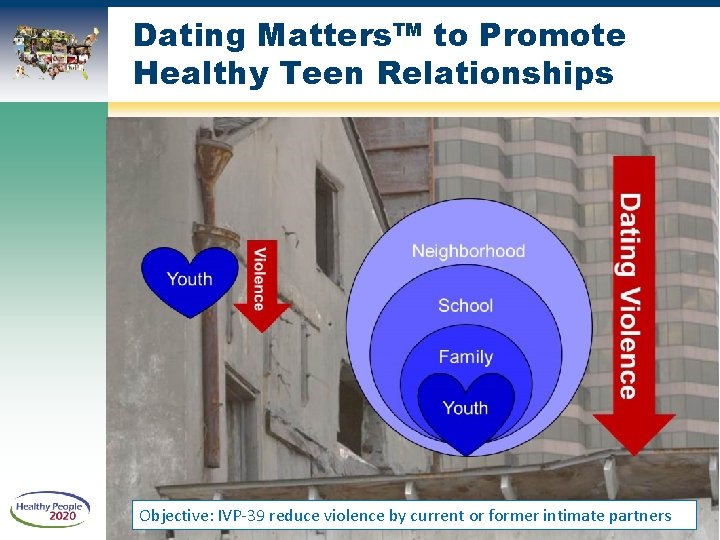
Dating Matters™ to Promote Healthy Teen Relationships Objective: IVP-39 reduce violence by current or former intimate partners
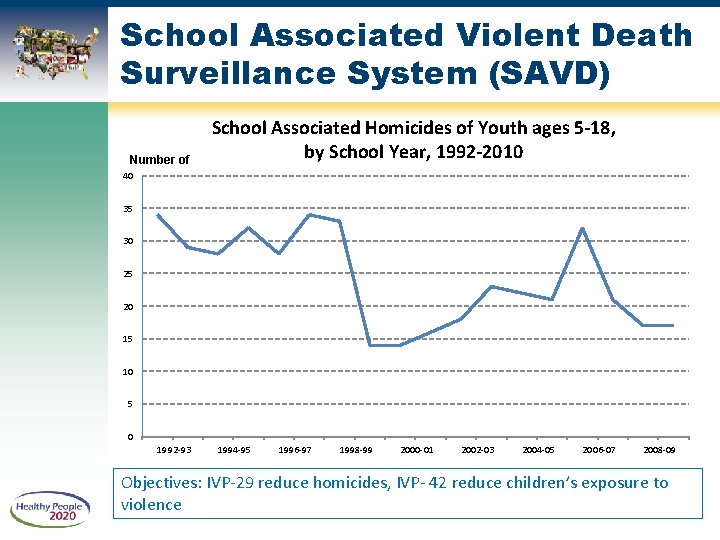
School Associated Violent Death Surveillance System (SAVD) Number of School Associated Homicides of Youth ages 5 -18, by School Year, 1992 -2010 40 35 30 25 20 15 10 5 0 1992 -93 1994 -95 1996 -97 1998 -99 2000 -01 2002 -03 2004 -05 2006 -07 2008 -09 Objectives: IVP-29 reduce homicides, IVP- 42 reduce children’s exposure to violence
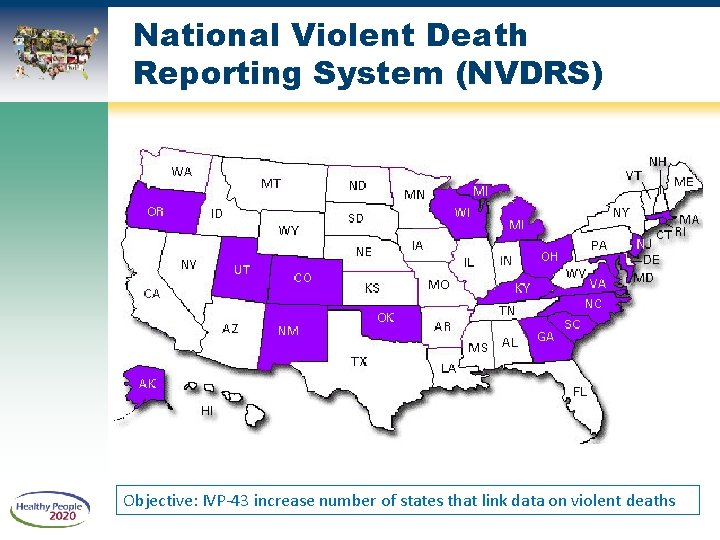
National Violent Death Reporting System (NVDRS) Objective: IVP-43 increase number of states that link data on violent deaths
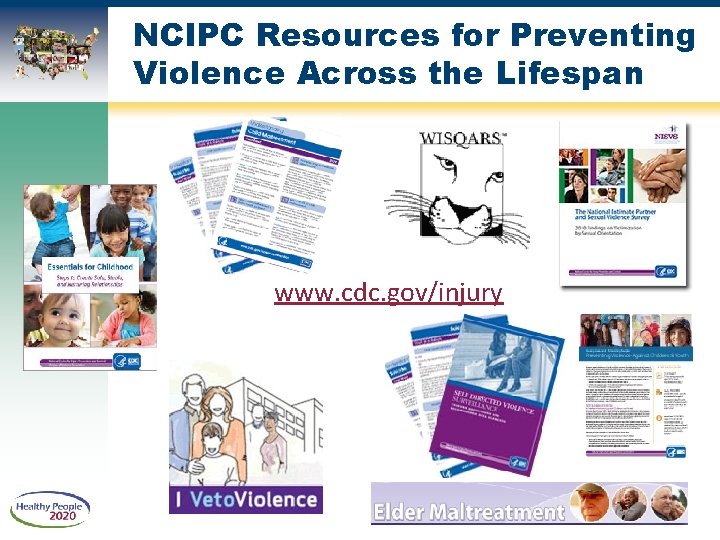
NCIPC Resources for Preventing Violence Across the Lifespan www. cdc. gov/injury
Dawn N. Castillo, MPH Director, Division of Safety Research National Institute for Occupational Safety & Health
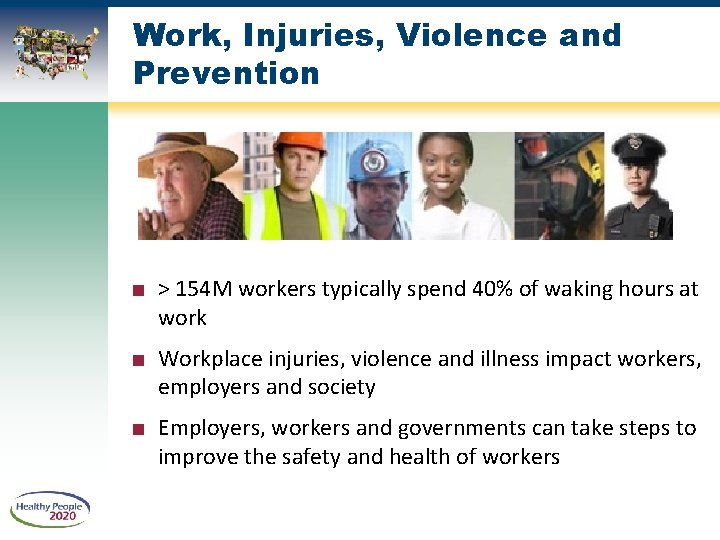
Work, Injuries, Violence and Prevention ■ > 154 M workers typically spend 40% of waking hours at work ■ Workplace injuries, violence and illness impact workers, employers and society ■ Employers, workers and governments can take steps to improve the safety and health of workers
National Institute for Occupational Safety and Health (NIOSH) ■ Mission: Improve worker safety and well-being by – Generating new knowledge – Transferring that knowledge into practice ■ Approach – Conducting scientific research – Developing guidance and authoritative recommendations – Conducting outreach – Responding to requests for technical assistance and evaluations of work hazards
Advancing Occupational Safety and Health HP 2020 Objectives ■ 16 Objectives – Reducing injuries generally and by industry sector v 2 workplace violence objectives – Health related outcomes ■ Engage Partners in Research-to-Practice – – Employers and trade organizations Unions and worker organizations Government agencies Manufacturers
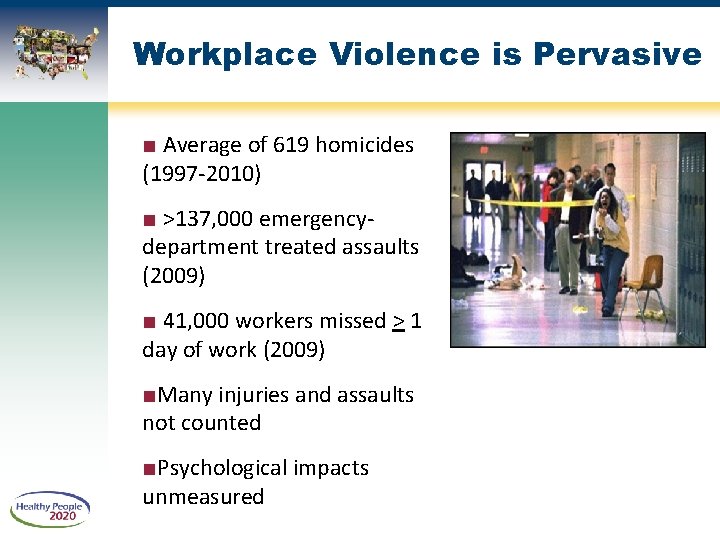
Workplace Violence is Pervasive ■ Average of 619 homicides (1997 -2010) ■ >137, 000 emergencydepartment treated assaults (2009) ■ 41, 000 workers missed > 1 day of work (2009) ■Many injuries and assaults not counted ■Psychological impacts unmeasured
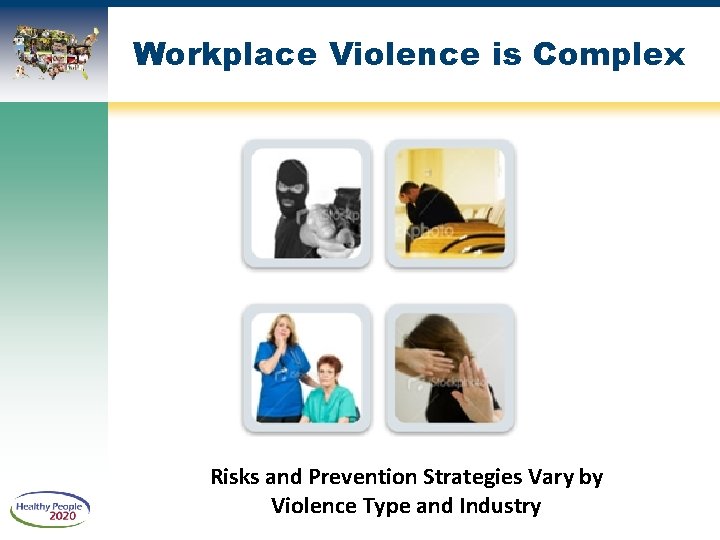
Workplace Violence is Complex Risks and Prevention Strategies Vary by Violence Type and Industry
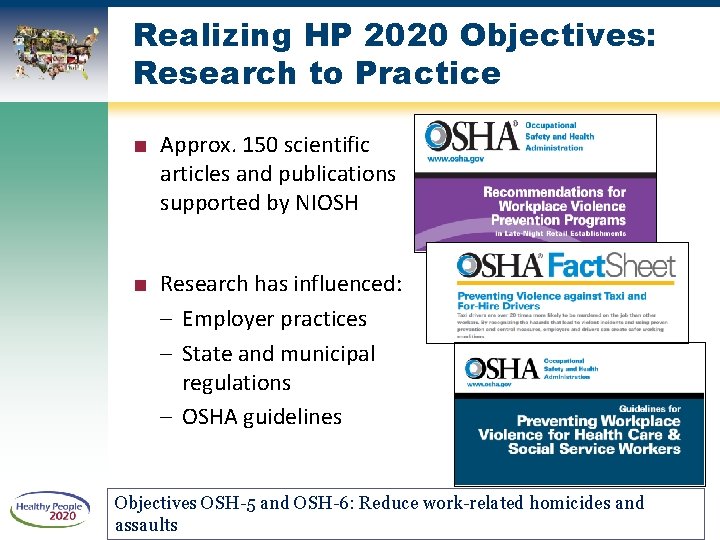
Realizing HP 2020 Objectives: Research to Practice ■ Approx. 150 scientific articles and publications supported by NIOSH ■ Research has influenced: – Employer practices – State and municipal regulations – OSHA guidelines Objectives OSH-5 and OSH-6: Reduce work-related homicides and assaults
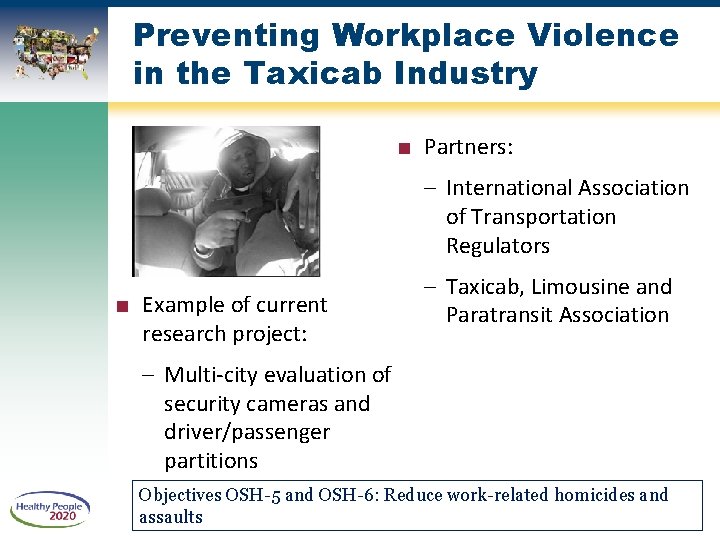
Preventing Workplace Violence in the Taxicab Industry ■ Partners: – International Association of Transportation Regulators ■ Example of current research project: – Taxicab, Limousine and Paratransit Association – Multi-city evaluation of security cameras and driver/passenger partitions Objectives OSH-5 and OSH-6: Reduce work-related homicides and assaults
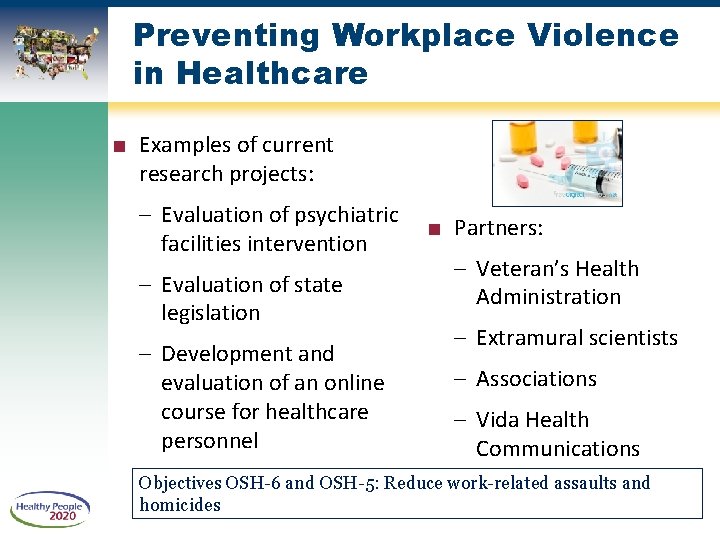
Preventing Workplace Violence in Healthcare ■ Examples of current research projects: – Evaluation of psychiatric facilities intervention – Evaluation of state legislation – Development and evaluation of an online course for healthcare personnel ■ Partners: – Veteran’s Health Administration – Extramural scientists – Associations – Vida Health Communications Objectives OSH-6 and OSH-5: Reduce work-related assaults and homicides
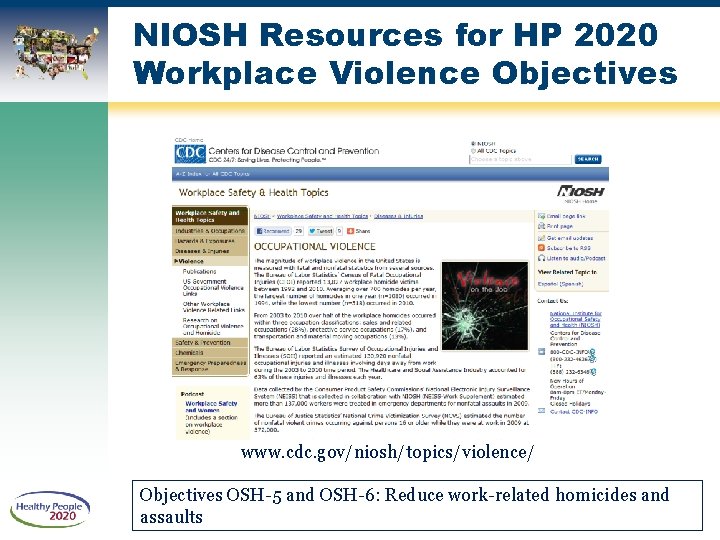
NIOSH Resources for HP 2020 Workplace Violence Objectives www. cdc. gov/niosh/topics/violence/ Objectives OSH-5 and OSH-6: Reduce work-related homicides and assaults
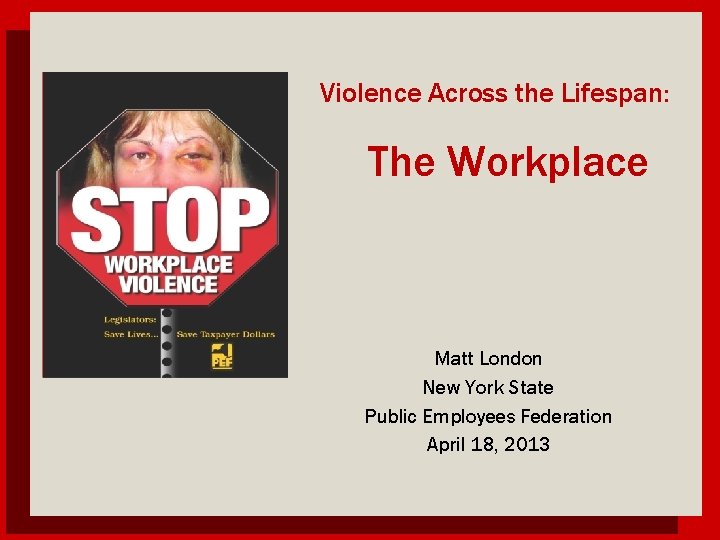
Violence Across the Lifespan: The Workplace Matt London New York State Public Employees Federation April 18, 2013
NYS Public Employees Federation (PEF) l l l Union representing 55, 000 NYS government employees Professional, scientific, and technical jobs Nurses, counselors, teachers, social workers, engineers, researchers High-risk settings Extensive exposure to vulnerable sectors of the public 68
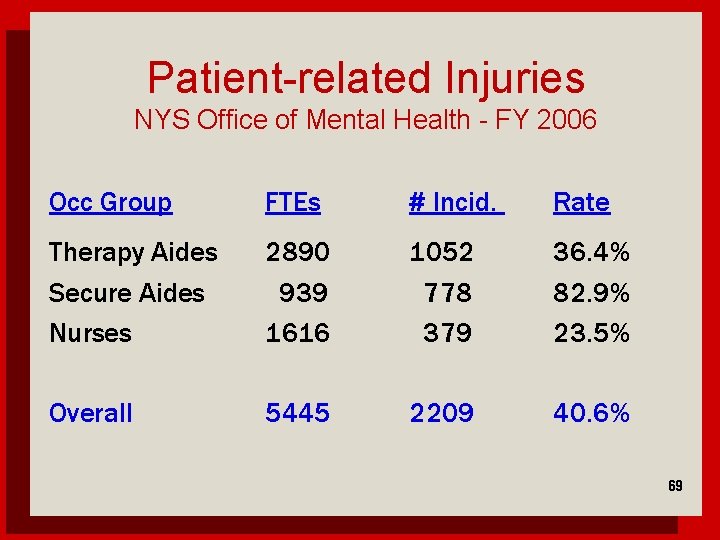
Patient-related Injuries NYS Office of Mental Health - FY 2006 Occ Group FTEs # Incid. Rate Therapy Aides Secure Aides Nurses 2890 939 1616 1052 778 379 36. 4% 82. 9% 23. 5% Overall 5445 2209 40. 6% 69
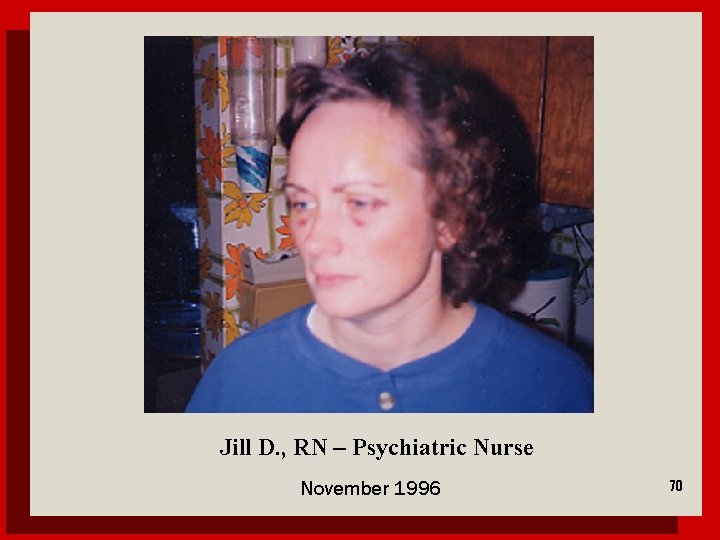
Jill D. , RN – Psychiatric Nurse November 1996 70
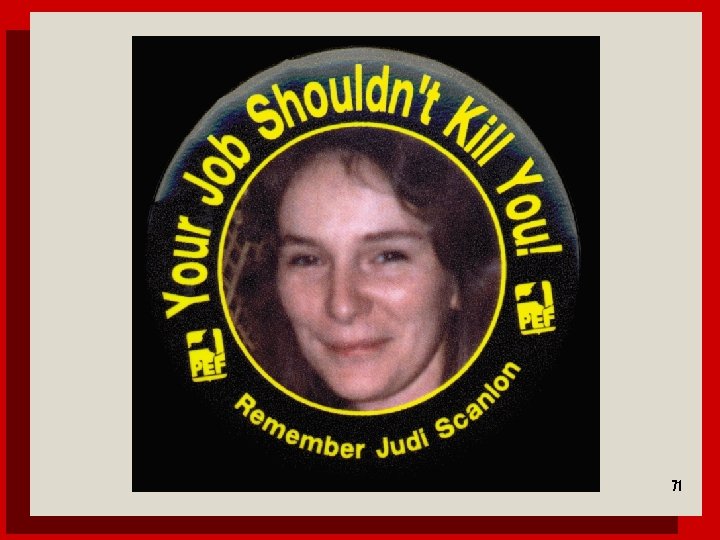
Job Shouldn’t Kill You 71
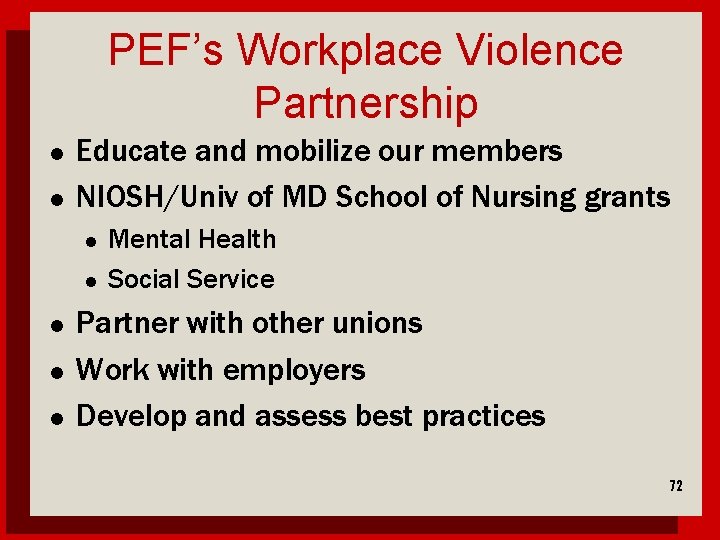
PEF’s Workplace Violence Partnership l l Educate and mobilize our members NIOSH/Univ of MD School of Nursing grants l l l Mental Health Social Service Partner with other unions Work with employers Develop and assess best practices 72
PEF’s Stop Workplace Violence Campaign (2005 -06) l 10 regionally-based day-long mobilization/trainings of >300 members l Development of booklet and DVD l Successful legislative campaign 73
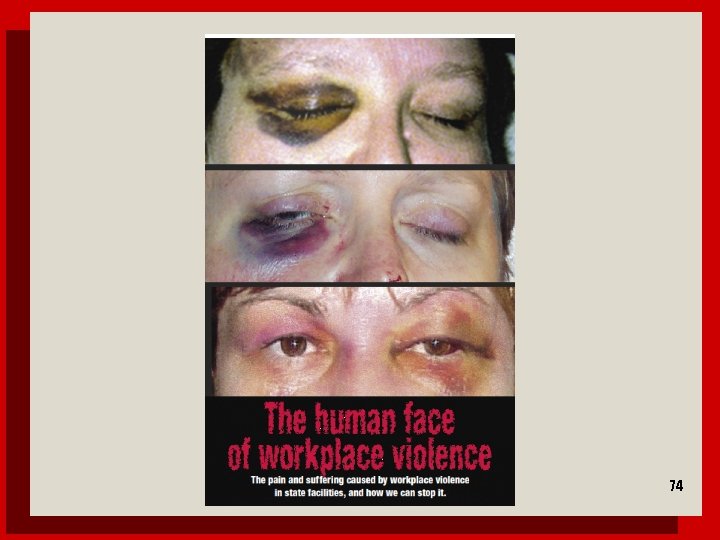
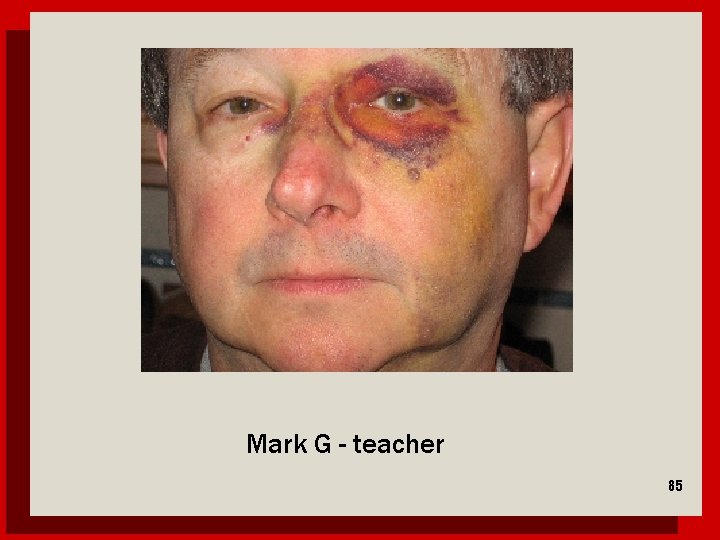
Human face 74
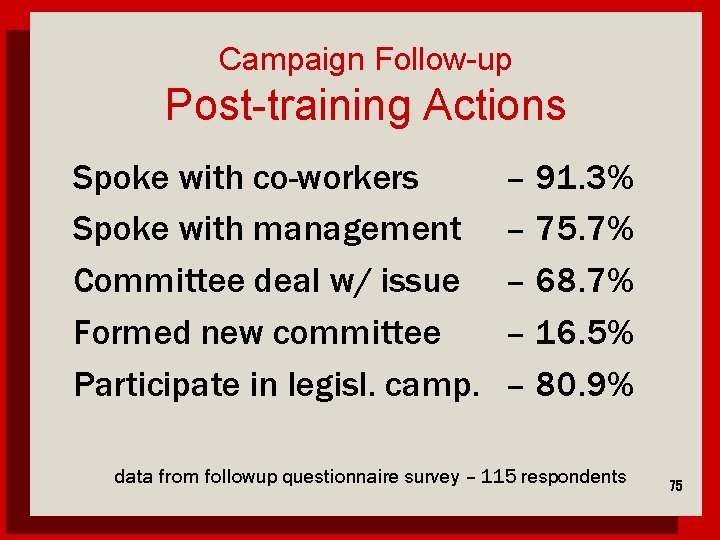
Campaign Follow-up Post-training Actions Spoke with co-workers Spoke with management Committee deal w/ issue Formed new committee Participate in legisl. camp. – 91. 3% – 75. 7% – 68. 7% – 16. 5% – 80. 9% data from followup questionnaire survey – 115 respondents 75
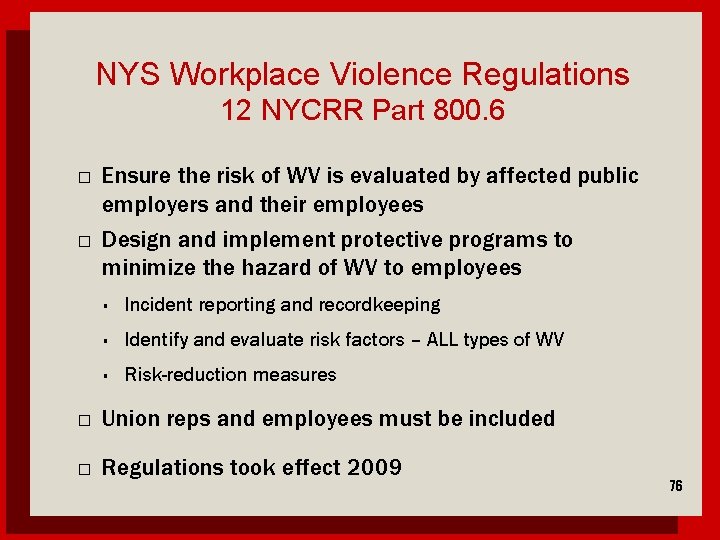
NYS Workplace Violence Regulations 12 NYCRR Part 800. 6 � � Ensure the risk of WV is evaluated by affected public employers and their employees Design and implement protective programs to minimize the hazard of WV to employees Incident reporting and recordkeeping Identify and evaluate risk factors – ALL types of WV Risk-reduction measures � Union reps and employees must be included � Regulations took effect 2009 76
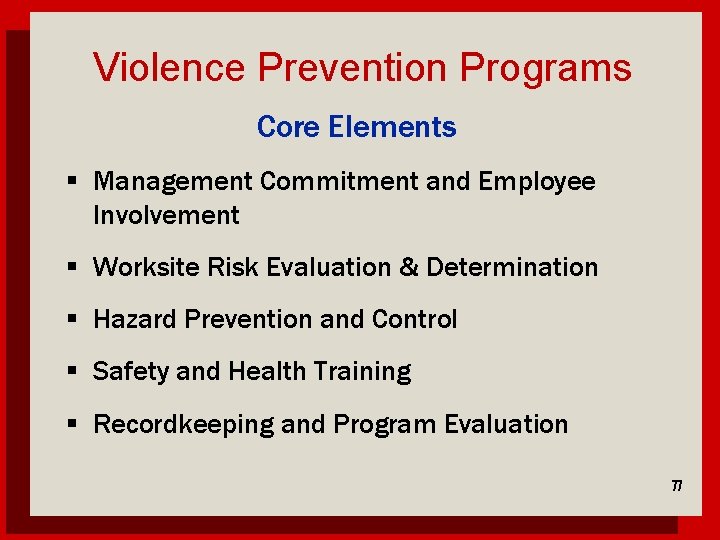
Violence Prevention Programs Core Elements Management Commitment and Employee Involvement Worksite Risk Evaluation & Determination Hazard Prevention and Control Safety and Health Training Recordkeeping and Program Evaluation 77
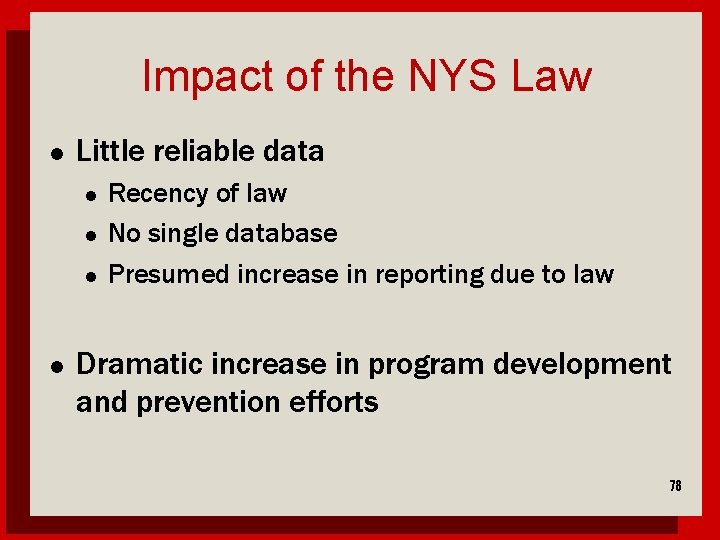
Impact of the NYS Law l Little reliable data l l Recency of law No single database Presumed increase in reporting due to law Dramatic increase in program development and prevention efforts 78
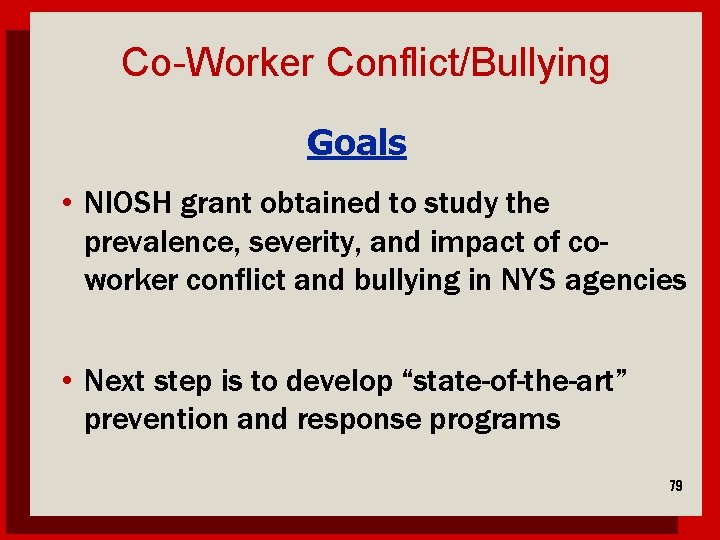
Co-Worker Conflict/Bullying Goals • NIOSH grant obtained to study the prevalence, severity, and impact of coworker conflict and bullying in NYS agencies • Next step is to develop “state-of-the-art” prevention and response programs 79
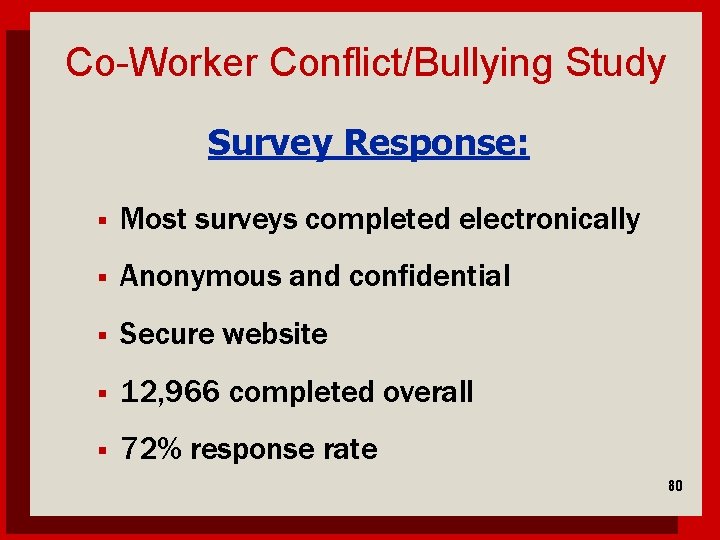
Co-Worker Conflict/Bullying Study Survey Response: Most surveys completed electronically Anonymous and confidential Secure website 12, 966 completed overall 72% response rate 80
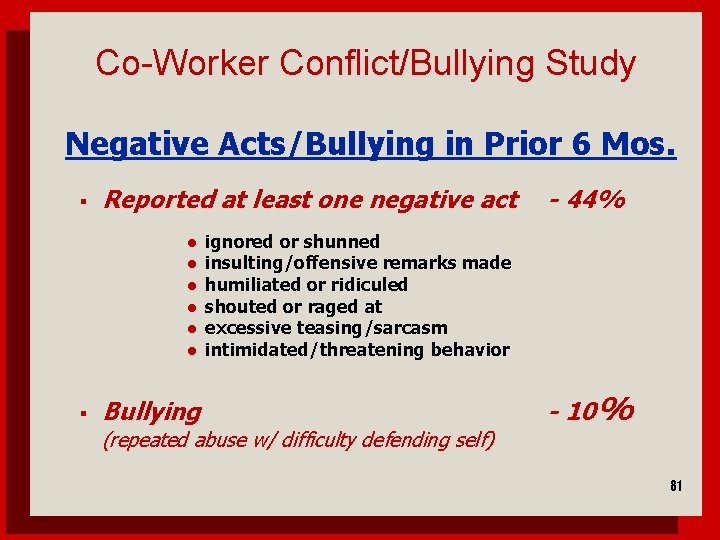
Co-Worker Conflict/Bullying Study Negative Acts/Bullying in Prior 6 Mos. Reported at least one negative act l l l - 44% ignored or shunned insulting/offensive remarks made humiliated or ridiculed shouted or raged at excessive teasing/sarcasm intimidated/threatening behavior Bullying (repeated abuse w/ difficulty defending self) - 10% 81
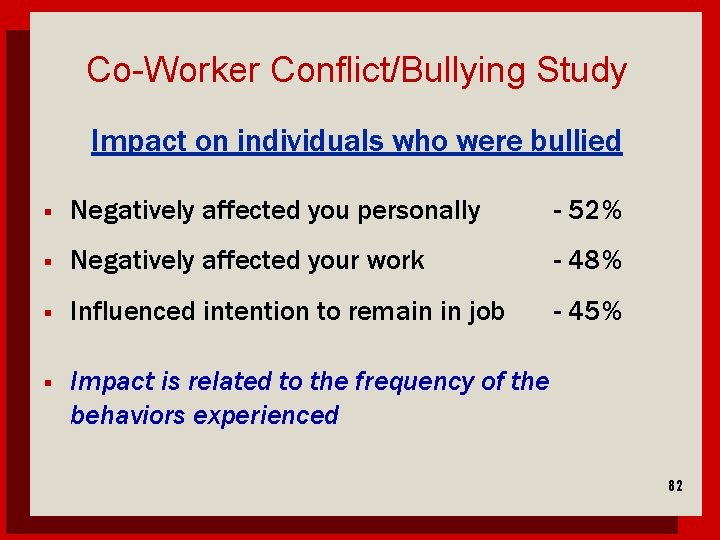
Co-Worker Conflict/Bullying Study Impact on individuals who were bullied Negatively affected you personally - 52% Negatively affected your work - 48% Influenced intention to remain in job - 45% Impact is related to the frequency of the behaviors experienced 82
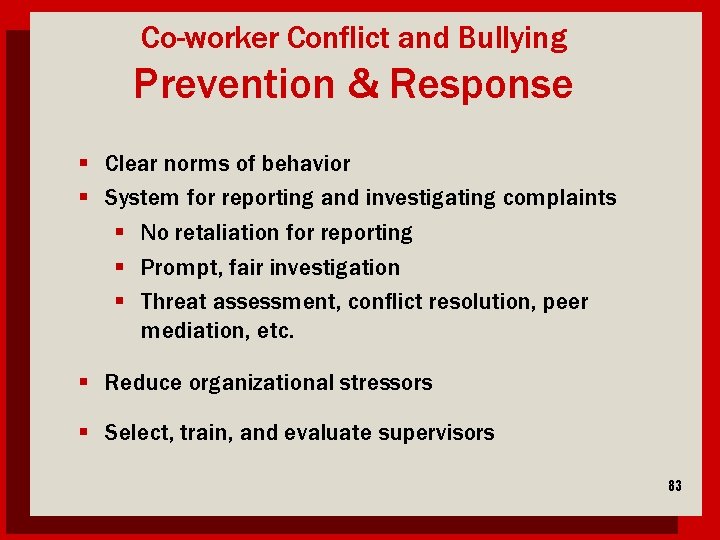
Co-worker Conflict and Bullying Prevention & Response Clear norms of behavior System for reporting and investigating complaints No retaliation for reporting Prompt, fair investigation Threat assessment, conflict resolution, peer mediation, etc. Reduce organizational stressors Select, train, and evaluate supervisors 83
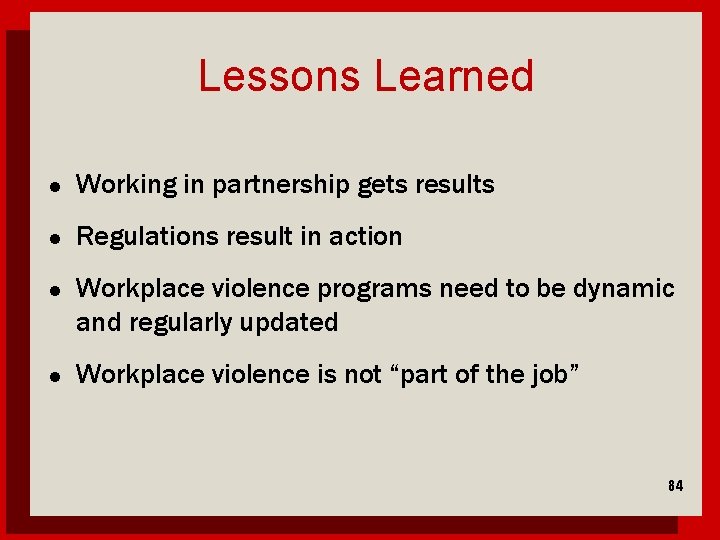
Lessons Learned l Working in partnership gets results l Regulations result in action l l Workplace violence programs need to be dynamic and regularly updated Workplace violence is not “part of the job” 84
Mark G - teacher 85
Next Steps l l l Continue to assist our members and their employers in having a robust program. Increase efforts to evaluate the impact of the law, and of various prevention strategies. Increase public awareness of the problem, and partner with more community stakeholders. 86
Please submit your questions through the chat function.
Healthy People 2020 HEALTHY PEOPLE 2020 Progress Review Federal Core Planning Group ■ ■ ■ ■ Annie Archbold (CDC) Tom Simon (NCIPC) Gwen Cattledge (NCIPC) Jane Bigham (NIOSH) De. Keely Hartsfield (NIOSH) John R. Myers (NIOSH) Rebecca Hines (NCHS) Holly Hedegaard (NCHS) Leda Gurley (NCHS) Jeff Pearcy (NCHS) Kimberly Hurvitz (NCHS) Deepthi Kandi (NCHS) Timothy Mc. Manus (NCHS) Yen Luong (ODPHP) Ellis Davis (ODPHP) Debbie Hoyer (ODPHP)
Stay Connected JOIN THE HEALTHY PEOPLE LISTSERV &CONSORTIUM WEB healthypeople. gov EMAIL hp 2020@hhs. gov TWITTER @gohealthypeople LINKEDIN Healthy People 2020 YOUTUBE ODPHP(search “healthy people”)