Energy and Weight Gain 2007 Energy Requirements in


 change from non-pregnant")


")


 • Koop-Hoolihan study design was “Impeccable. ”")
 • “A prudent course seems to be")

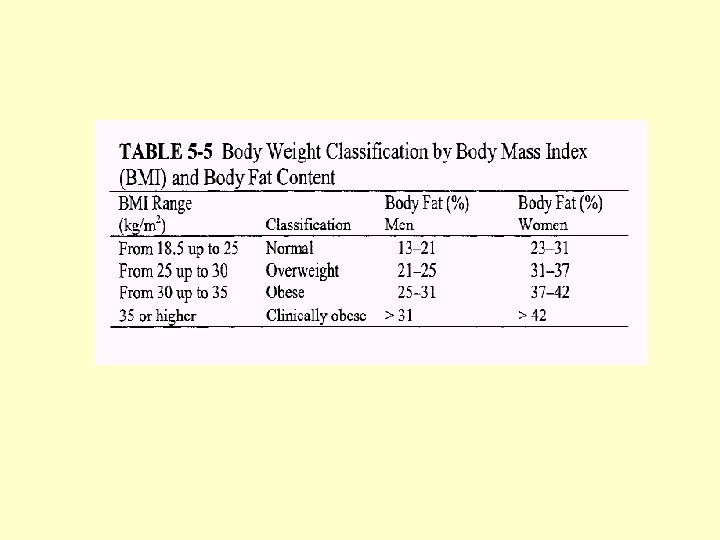
 Weight-for-height")


 concluded that childbearing is associated with average weight gain")


")


 • Cohort: 7002 singleton deliveries with")


- Slides: 74
Energy and Weight Gain 2007
Energy Requirements in Pregnancy • Increased Energy costs in pregnancy: – increased maternal metabolic rate – fetal tissues – increase in maternal tissues
RDA for Energy in Pregnancy Old • Energy cost of pregnancy = 80, 000 kcal (Hytten and Leitch, 1971) – maternal gain of 12. 5 kg – infant weight of 3. 3 kg • 80, 000/250 days (days after the first month) • Additional 300 kcal per day recommended in second and third trimester – total of 2, 500 for reference woman
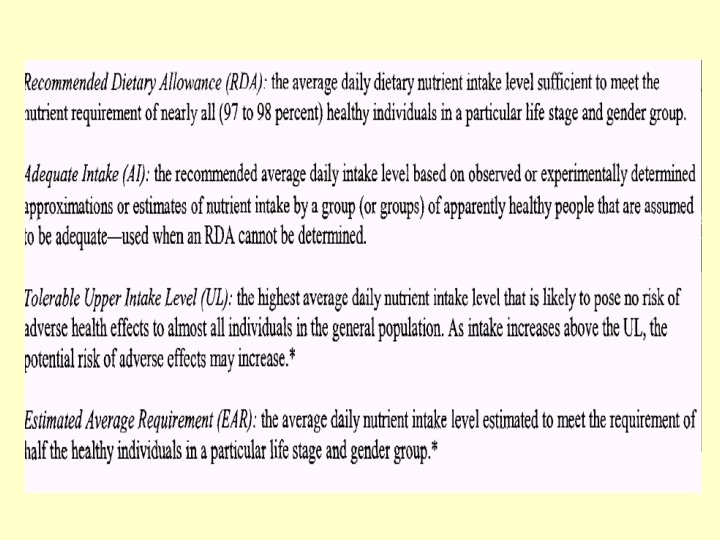
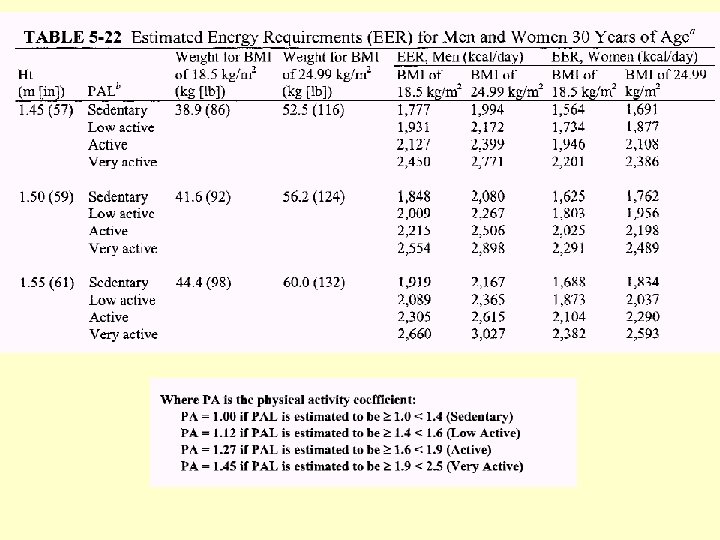
DRI for Energy
Estimated Energy Requirement • Average dietary energy intake that is predicted to maintain energy balance in a healthy adult of a defined age, gender, weight, height, level of physical activity consistent with good health. • In children, pregnant and lactating women the EER is taken to include the needs associated with deposition of tissues or secretion of milk
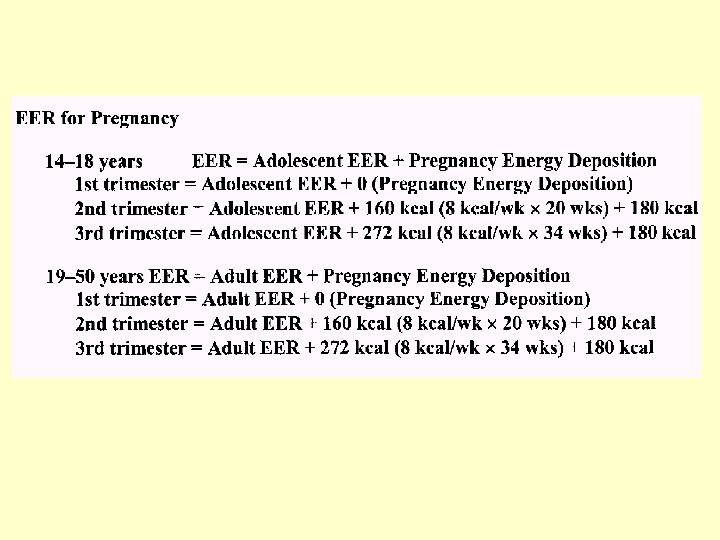
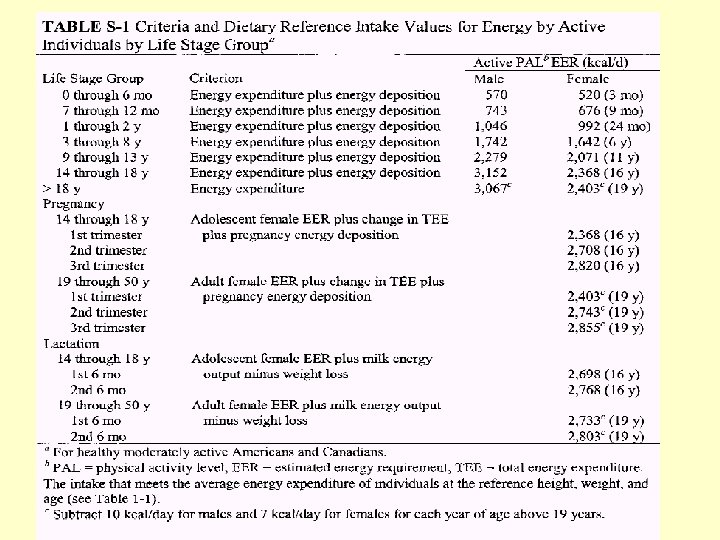
DRI for Energy in Pregnancy 2002
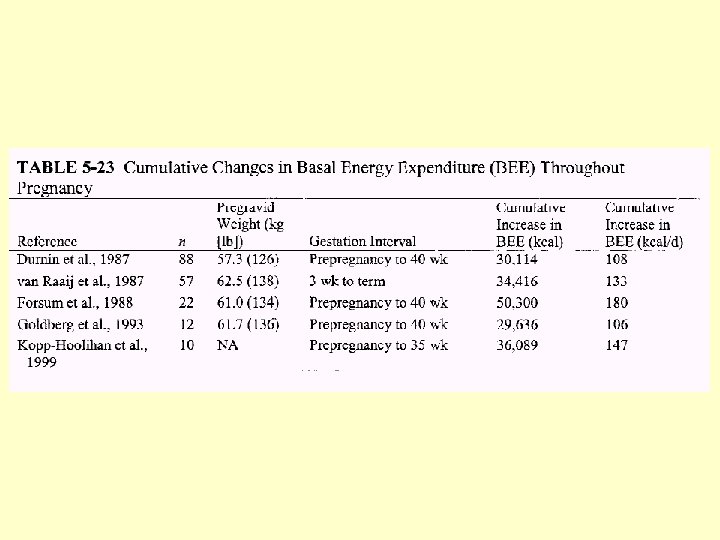
BEE: Basal Energy Expenditure • Increases due to metabolic contribution of uterus and fetus and increased work of heart and lungs. • Variable for individuals
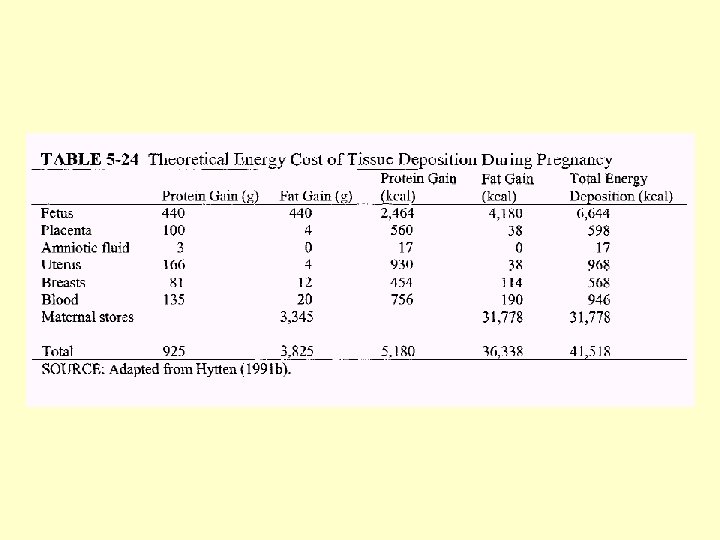
Growth of Maternal and Fetal Tissues • Calculations Based on: – Hytten – IOM weight gain recommendations
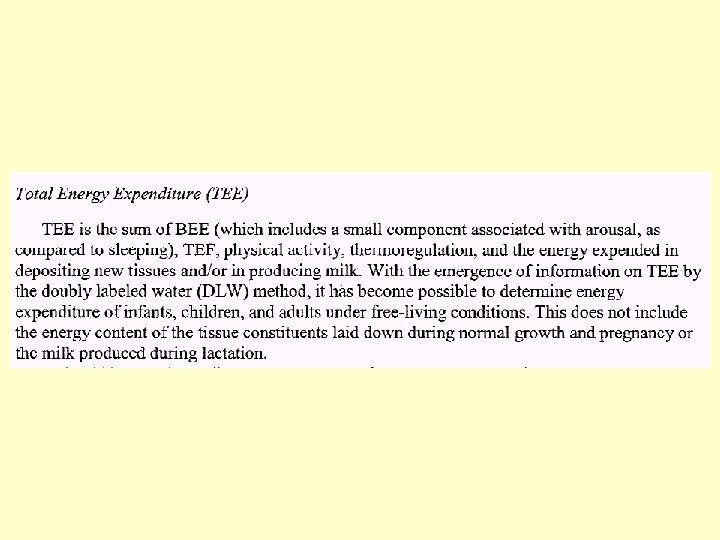
Longitudinal Data from DLW Database • Median TEE (total energy expenditure) change from non-pregnant was 8 kcal/gestational week. • TEE changes little in first trimester.
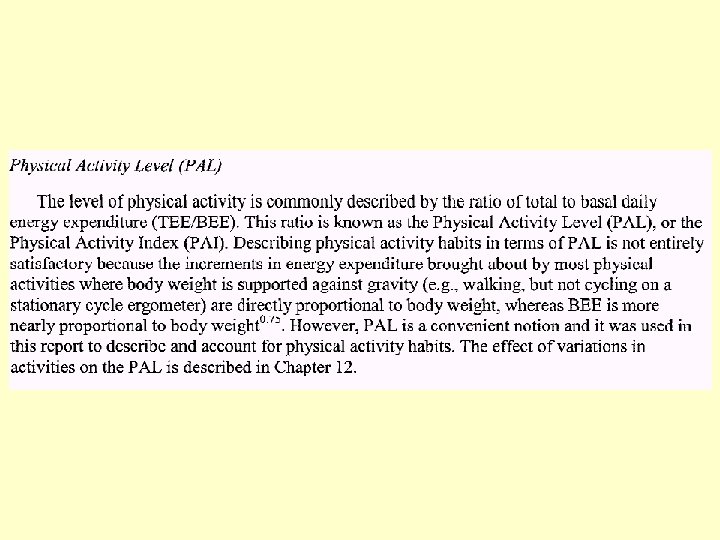
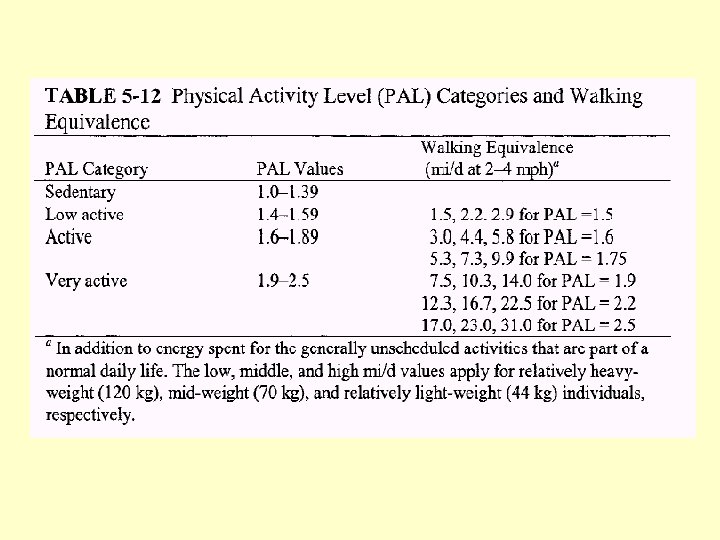
Variations in Energy Requirements • Body size - especially lbm • Activity: – most women decrease activity in last months of pregnancy if they can – increased energy cost of moving heavier body • BMR – rises in well nourished women (27%) – rises less or not at all in women who are not well nourished • -Diet Induced Thermogenesis?
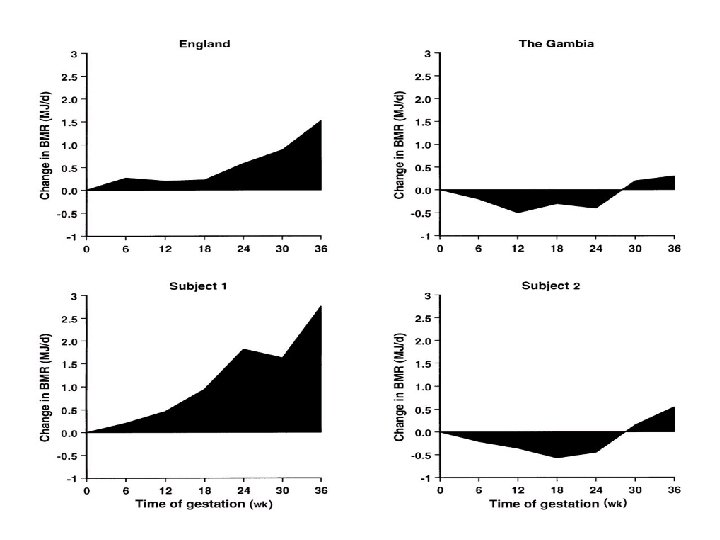
Evidence of energy sparing in Gambian women during pregnancy: a longitudinal study using whole -body calorimetry (AJCN, 1993) • N=58, initially recruited, ages 18 -40 – 25 became pregnant – 21 participated in study protocols – 9 completed BMR and 24 hour energy expenditure – 12 completed BMR • Adjusted for seasonality, weight loss expected during wet season
Poppitt et al. , cont. • Mean maternal prepregnancy weight was 52 kg • Mean prepregnancy BMI was 21. 2 + 2 • Mean birthweight was 3. 0 + 0. 1 • Mean gestational length was 39. 4 • Mean weight gain was 6. 8 kg • Mean fat gain was 2. 0 kg at 36 weeks
Poppitt et al. , cont. • BMR fell in early pregnancy • Values per kg lbm remained below baseline for duration of pregnancy • Individual variation was high
Poppitt et al. , cont. • Energy sparing mechanisms may act via a suppression of metabolism in women on habitually low intakes. • This maintains positive balance in the mother and protects the fetus from growth retardation
Prentice and Goldberg. Energy Adaptations in human pregnancy: limits and long-term consequences. Am J Clin Nutr. 2000; 71(supple): 1226 S-32 S.
Longitudinal assessment of energy balance in well-nourished, pregnant women (Koop-Hoolihan et al, AJCN, 1999) • N=16, SF area – 10 became pregnant • BMI range was 19 -26 • Mean weight gain at 36 weeks was 11. 6 + 4 • Mean birth weight was 3. 6
Koop-Hoolihan, cont • Protocol: 5 times before pregnancy, 3 times during, once 4 -6 weeks postpartum – RMR (resting metabolic rate/metabolic cart) – DIT (diet induced thermogenesis/metabolic cart) – TEE (total energy expenditure/doubly labeled water) – AEE (activity energy expenditure/difference between TEE and RMR) – EI (energy intake/3 day food records) – Body composition - densitometry, tbw, bmc with absorptiometry
Koop-Hoolihan, cont • Women with the largest cumulative increase in RMR deposited the least fat mass (this was the only prepregnant factor that predicted fat mass gain) • In all indices there was large individual variation • Average total energy cost of pregnancy was similar to work of Hytten and Leitch (1971) • Food intake records indicated 9% increase in kcals with pregnancy, but highly variable
Energy in Pregnancy (Roy Pitkin, AJCN, 1999) • Koop-Hoolihan study design was “Impeccable. ” • Women meet increase energy demands of pregnancy in a variety of ways - increased intakes, decreased activity or DIT, limited fat storage. • RDA?
Energy in Pregnancy (Roy Pitkin, AJCN, 1999) • “A prudent course seems to be to permit considerable latitude in energy intake recommendations on the basis of individual preferences and to monitor weight gain carefully, making adjustments in energy intake only in response to the normal pattern of gain. ”
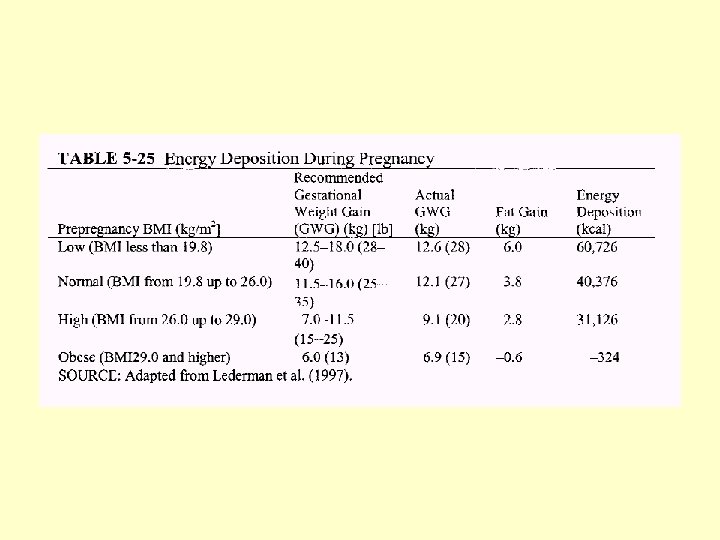
IOM Recommendations Institute of Medicine. Nutrition during pregnancy, weight gain and nutrient supplements. Report of the Subcommittee on Nutritional Status and Weight Gain during Pregnancy, Subcommittee on Dietary Intake and Nutrient Supplements during Pregnancy, Committee on Nutritional Status during Pregnancy and Lactation, Food and Nutrition Board. Washington, DC: National Academy Press, 1990
Recommended total weight gain in pregnant women by prepregnancy BMI (in kg/m 2) Weight-for-height category Recommended total gain (kg) Low (BMI <19. 8) 12. 5– 18 Normal (BMI 19. 8– 26. 0) 11. 5– 16 High (BMI >26. 0– 29. 0)2 7– 11. 5 Adolescents and black women should strive for gains at the upper end of the recommended range. Short women (<157 cm) should strive for gains at the lower end of the range. The recommended target weight gain for obese women (BMI >29. 0) is 6. 0.
Rates of Weight Gain: T 2 and T 3 • Underweight women: 0. 5 kg per week • Normal weight women: 0. 4 kg per week • Overweight women: 0. 3 kg per week
Cogswell M, Serdula M, Hungerford D, Yip R. Gestational weight gain among average-weight and overweight women—what is excessive? Am J Obstet Gynecol 1995; 172: 705– 12
Incidence of adverse outcomes for 6690 pregnancies in San Francisco Parker J, Abrams B. Prenatal weight gain advice: an examination of the recent prenatal weight gain recommendations of the Institute of Medicine. Obstet Gynecol 1992; 79: 664– 9
Percentage of US women with normal prepregnancy weights who retained >9 kg 10– 24 mo postpartum relative to prepregnancy weight (Parker J, Abrams B. Differences in postpartum weight retention between black and white mothers. Obstet Gynecol 1993; 81: 768– 74)
Postpartum Weight • IOM (1990) concluded that childbearing is associated with average weight gain of 1 kg. • There is a large variation in differences between prepregnant weight and weight at 6 to 12 months postpartum (SD of 4. 8 kg) • Analysis is confused by the tendency to gain weight with aging • Years between 25 and 34 are times when American women are most vulnerable to major weight gain
Postpartum Weight • Proportions of black women who have higher postpartum weights is higher in almost all studies. • Smoking is consistently related to less postpartum weight gain.
Predictors of weight gain at 6 and 18 months after childbirth: a pilot study (Walker, JOGNN, 1996) • N=88 at 6 months, 75 at 18 months • Out of about 300 who were sent a mailed questionnaire 6 and 18 months postpartum • Predominantly white mothers in the Midwestern US
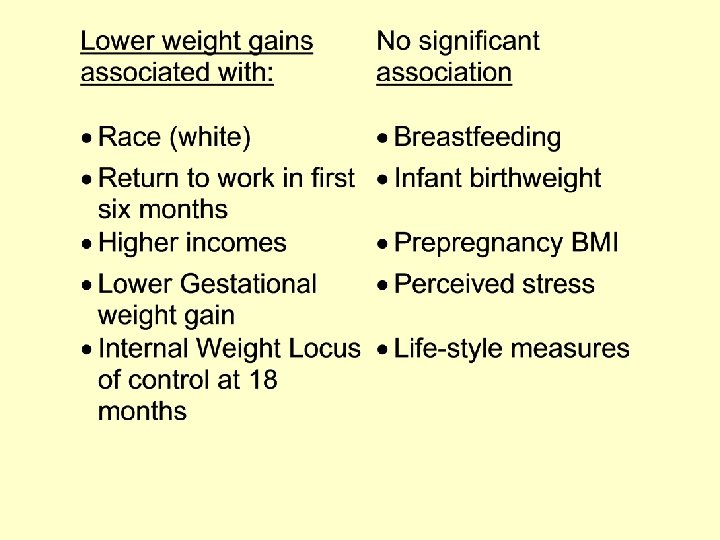
Predictors of weight gain at 6 and 18 months after childbirth: a pilot study (Walker, JOGNN, 1996) • Battery of tests including: – Health promoting lifestyle profile (48 items on exercise, nutrition, support self-actualization) – Categories of activity level – Weight locus of control scale (internal or external) – Self reported weight and height, method of delivery, method of infant feeding
Predictors of weight gain at 6 and 18 months after childbirth: a pilot study (Walker, JOGNN, 1996)
Walker, Results • At both 6 and 18 months, women who exceeded IOM wt. Gain recommendations had significantly higher pp weight increases.
Sociocultural and behavioral influences on weight gain during pregnancy Hicky, CA. Am J Clin Nutr. 2000; 71(supple): 1364 S-70 S.
Percent of Women Gaining < 7. 3 kg
Characteristics of Women Associated with Inadequate Weight Gain • • • Lower education levels Unmarried Aged > 30 years Smoking Multiple parity
• Possibly psycho-social stress and pregnancy intendedness (effects seem to differ by culture) • Low income women had twice the risk in NNS. • Migrant workers have higher risk in WIC populations
1997 Review of Recommendations Maternal Weight Gain: A Report of an Expert Work Group. Suitor, CW. 1997. NCEMCH.
• Maternal water gain, which probably represents lean tissue, is a predictor of birthweight, fat gain is not predictive. • Effect size of energy intake on weight gain is modest. • When maternal weight gain is within IOM range, incidence of SGA & LBW is reduced • Increasing prevalence of obesity in population calls for reexamination of effects of pregnancy weight gain & retention
• Increased parity is associated with increased weight gain in adulthood. • Post delivery, African American women have greater weight retention than white women with the same pregnancy weight gain. • Promote use of IOM recommendations for rate of weight gain as well as total weight gain. • Promote strategies for weight gain within recommended ranges. • Promote healthy eating
• Until more is known, two groups of special concern, Adolescents and African American women should be advised to stay within IOM ranges without either restricting weight gain or encouraging weight gain at the upper end of the range.
Influence of Pregnancy Weight on Maternal and Child Health Report on a Workshop Institute of Medicine, 2007
Emerging Themes • Context has shifted due to rapid rise in obesity rates • Low birth weight has additional causes other than gestational weight gain • IOM BMI categories need to be harmonized with NHLBI • Utility of and compliance with 1990 recommendations is a concern
• IOM recommendations need to be updated for obese women and adolescents • Maternal health outcomes could include weight retention, CVD • Child health outcomes could include obesity, mental health, CVD • Need more research on diverse racial/ethnic groups, adolescents, morbidly obese women, lactation and pregnancy, individual vs. population recommendations, appropriate interventions, surveillance
Multiple Births • Optimal range of birthweight: – Twins: 2500 -2800 g at 36 -37 weeks – Triplets: 1900 -2000 g at 34 -36 weeks • Maternal weight gain of 16 -20. 5 kg with. 75 kg per week during second half of pregnancy is associated with optimal twin birthweights (IOM). • Weight gain of < 0. 85 pounds per week before 24 weeks associated with IUGR and morbidity.
Carmichael- what are women actually doing? (AJPH, 1998) • Cohort: 7002 singleton deliveries with good outcomes at UCSF between 19801990 • Good outcomes = vaginal delivery, term (>37 weeks), live, AGA, no maternal diabetes or hypertension
Carmichael Results
Carmichael Discussion • More than half the women fell outside of IOM ranges • Higher gains may be associated with higher postpartum weight retention • Monitoring of weight gain is not highly sensitive when used in isolation • Many questions remain about the utility of monitoring weight gain, standards, and counseling.
Trends in weight gain during pregnancy: A population study across 16 years in North Carolina Helms E et al. , American Journal of Obstetrics and Gynecology (2006) 194, e 32–e 34 • 1, 463, 936 registered North Carolina births from 1988 to 2003 • The percentage of pregnant women achieving recommended weight gain decreased significantly (down 6. 3%) between 1988 and 2003.
CDC Pregnancy Nutrition Surveillance
Obesity in Pregnancy: Impact on Maternal and Infant Health Outcomes
Prepregnancy Obesity* Washington State, 1992 -2005 *Obesity is defined as prepregnancy weight > 200 lbs Morbid obesity is defined as prepregnancy weight > 275 lbs
Prepregnancy Weight Washington State, 2003 -2005 Body Mass Index Percent of Women Underweight (BMI < 18. 5) Normal weight (BMI 18. 5 -24. 9) Overweight (BMI 25 - 29. 9) Obese (BMI 30+) 3% 49% 26% 22%
Obesity by Parity and Race/Ethnicity Washington State, 2003 -2005
Odds Ratios of the Relation between Obesity and Maternal Outcomes Washington State, 2003 -2005 Odds ratios are compared to normal weight women, and are adjusted for race/ethnicity, parity, maternal age, maternal smoking, marital status and birth year. Trends are significant at p=. 05.
Odds Ratios of the Relation between Obesity and Infant Outcomes Washington State, 2003 -2005 Odds ratios are compared to normal weight women, and are adjusted for race/ethnicity, parity, maternal age, maternal smoking, marital status and birth year. Trends are significant at p=. 05. *Not statistically significant at p=. 05
Greater than Recommended Weight Gain by BMI, Washington State, 2003 -2005
Summary • Prepregnancy obesity and morbid obesity are increasing in WA • Obesity poses increased risk for number of adverse maternal and infant outcomes • Risk increases with body mass index • Weight gain above recommendations may pose additional risk • Interventions should address entire spectrum of prevention
Contact Information • Cathy Wasserman, Ph. D Epidemiologist Washington State Department of Health cathy. wasserman@doh. wa. gov 360 -236 -3542