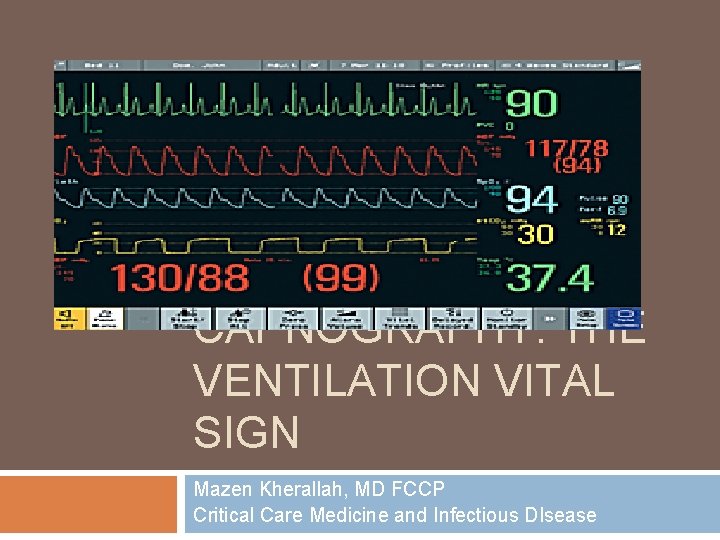
CAPNOGRAPHY THE VENTILATION VITAL SIGN Mazen Kherallah MD



- Slides: 46
CAPNOGRAPHY: THE VENTILATION VITAL SIGN Mazen Kherallah, MD FCCP Critical Care Medicine and Infectious DIsease
Objectives Define Capnography Discuss Respiratory Cycle Discuss ways to collect ETCO 2 information Discuss Non-intubated vs. intubated patient uses Discuss different waveforms and treatments of them.
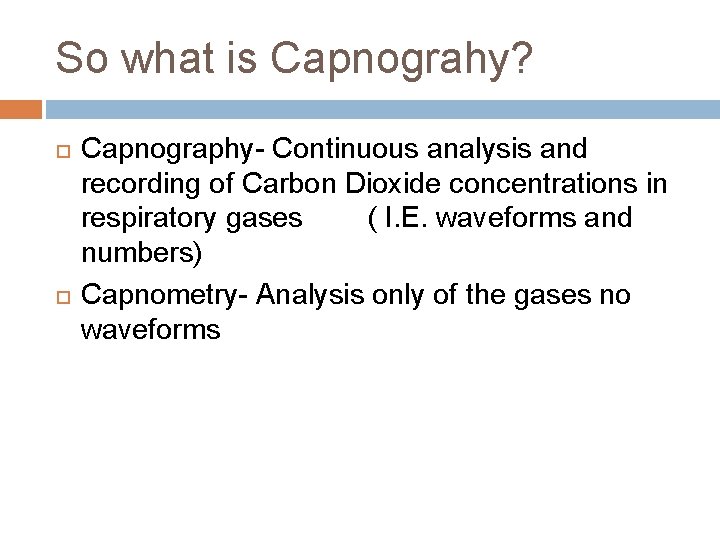
So what is Capnograhy? Capnography- Continuous analysis and recording of Carbon Dioxide concentrations in respiratory gases ( I. E. waveforms and numbers) Capnometry- Analysis only of the gases no waveforms
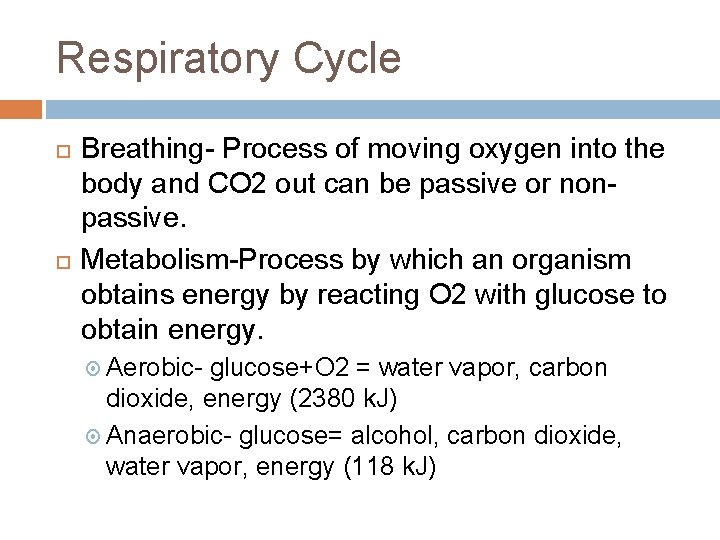
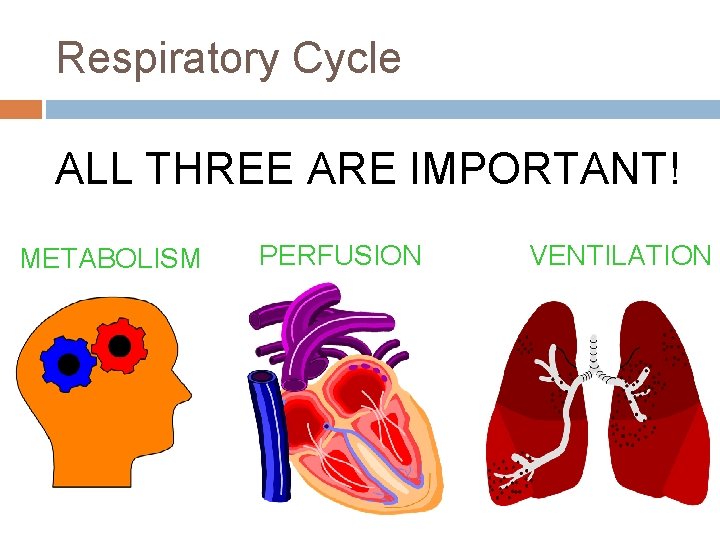
Respiratory Cycle Breathing- Process of moving oxygen into the body and CO 2 out can be passive or nonpassive. Metabolism-Process by which an organism obtains energy by reacting O 2 with glucose to obtain energy. Aerobic- glucose+O 2 = water vapor, carbon dioxide, energy (2380 k. J) Anaerobic- glucose= alcohol, carbon dioxide, water vapor, energy (118 k. J)
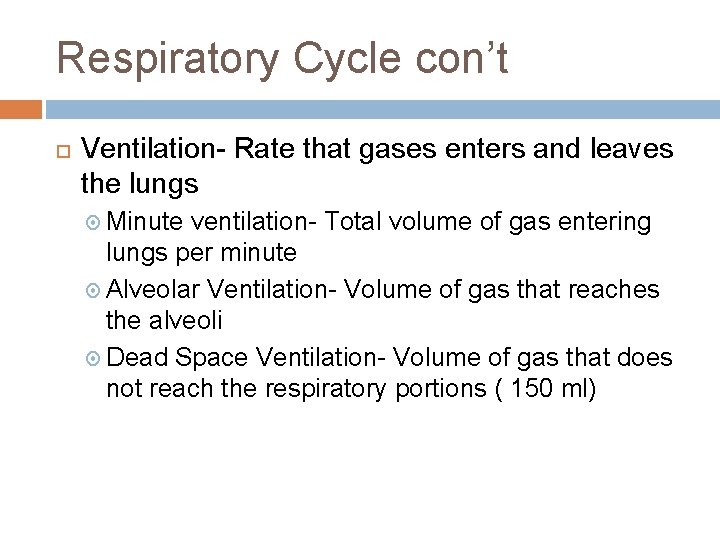
Respiratory Cycle con’t Ventilation- Rate that gases enters and leaves the lungs Minute ventilation- Total volume of gas entering lungs per minute Alveolar Ventilation- Volume of gas that reaches the alveoli Dead Space Ventilation- Volume of gas that does not reach the respiratory portions ( 150 ml)
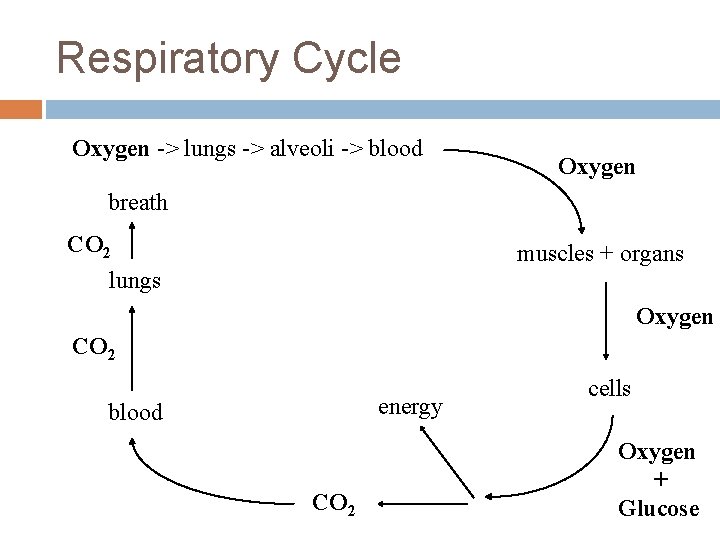
Respiratory Cycle Oxygen -> lungs -> alveoli -> blood Oxygen breath CO 2 lungs muscles + organs Oxygen CO 2 energy blood CO 2 cells Oxygen + Glucose
Respiratory Cycle ALL THREE ARE IMPORTANT! METABOLISM PERFUSION VENTILATION
How is ETCO 2 Measured? Semi-quantitative capnometry Quantitative capnometry Wave-form capnography
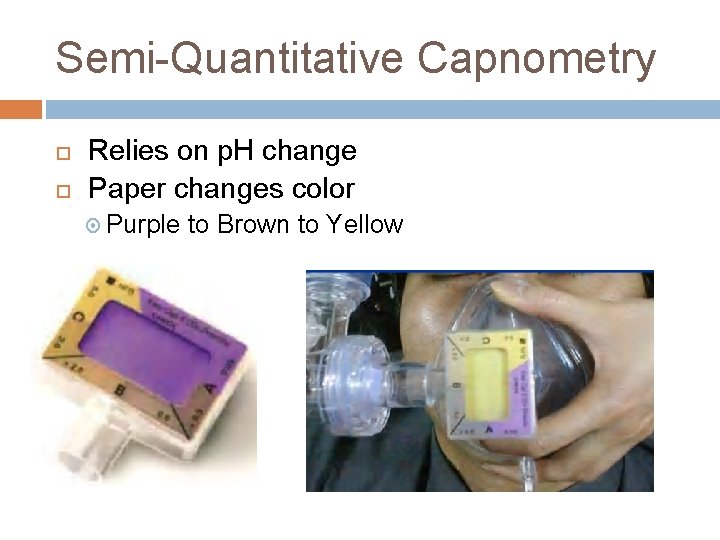
Semi-Quantitative Capnometry Relies on p. H change Paper changes color Purple to Brown to Yellow
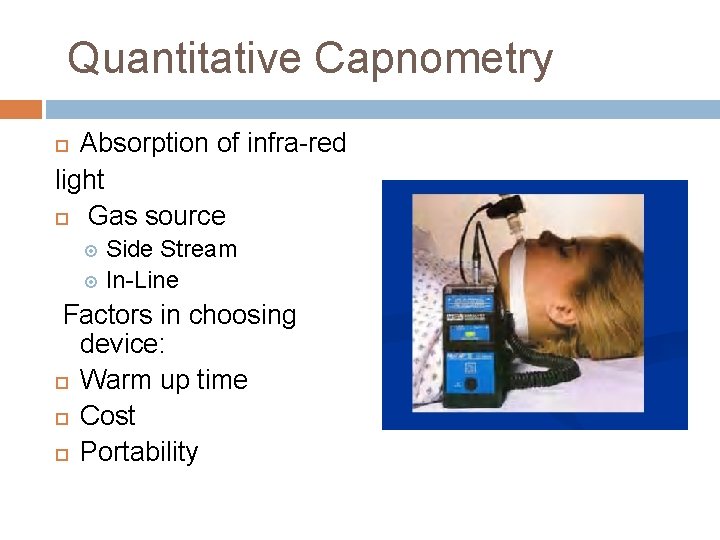
Quantitative Capnometry Absorption of infra-red light Gas source Side Stream In-Line Factors in choosing device: Warm up time Cost Portability
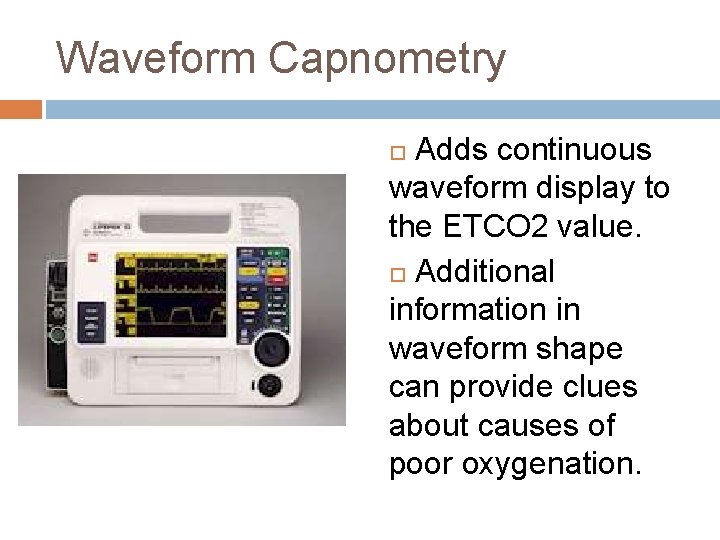
Waveform Capnometry Adds continuous waveform display to the ETCO 2 value. Additional information in waveform shape can provide clues about causes of poor oxygenation.
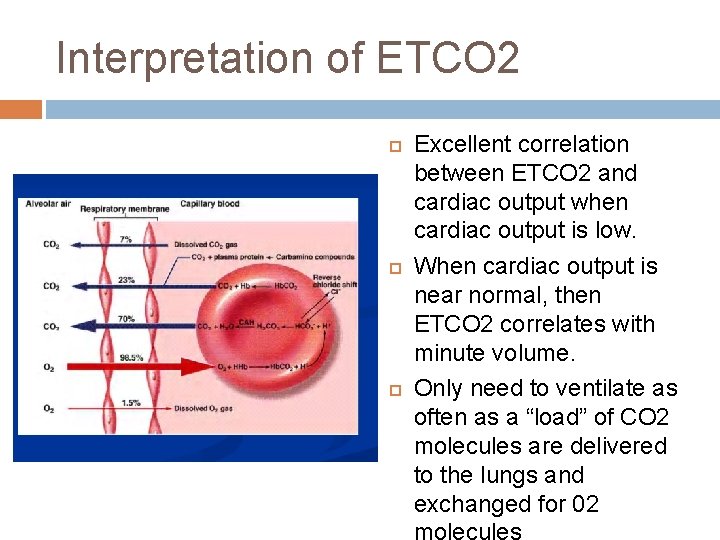
Interpretation of ETCO 2 Excellent correlation between ETCO 2 and cardiac output when cardiac output is low. When cardiac output is near normal, then ETCO 2 correlates with minute volume. Only need to ventilate as often as a “load” of CO 2 molecules are delivered to the lungs and exchanged for 02
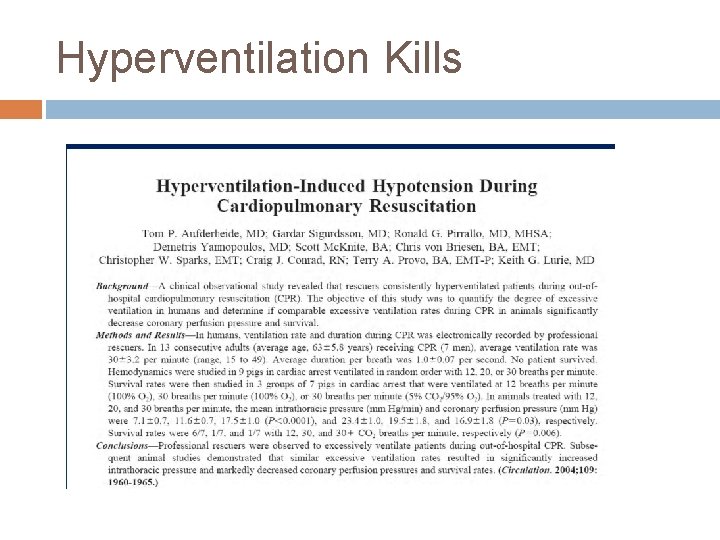
Hyperventilation Kills
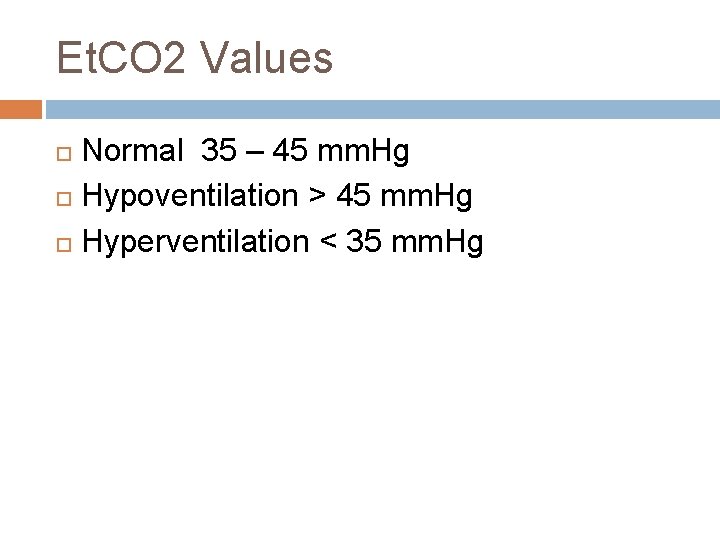
Et. CO 2 Values Normal 35 – 45 mm. Hg Hypoventilation > 45 mm. Hg Hyperventilation < 35 mm. Hg
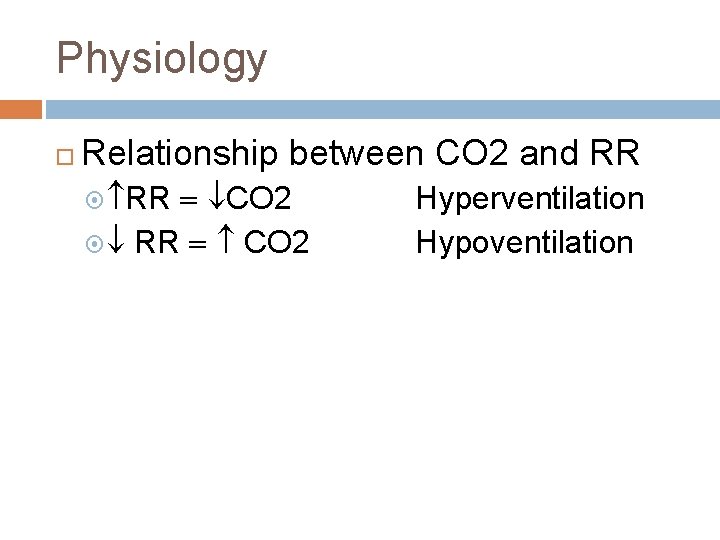
Physiology Relationship between CO 2 and RR CO 2 Hyperventilation Hypoventilation
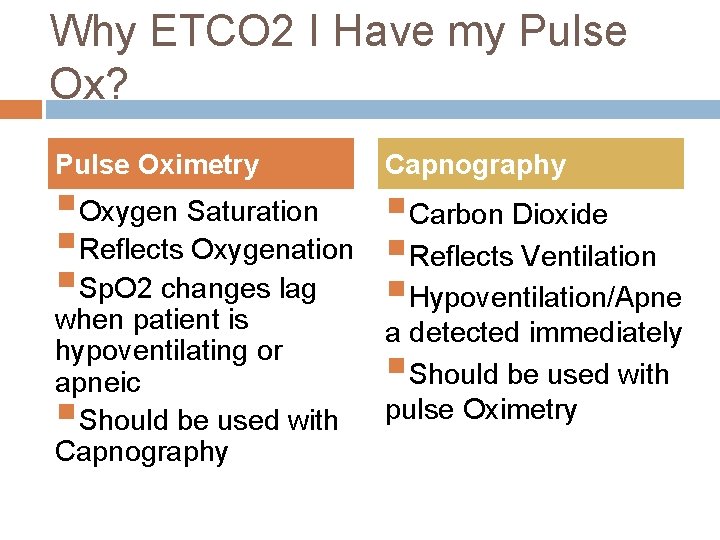
Why ETCO 2 I Have my Pulse Ox? Pulse Oximetry Capnography §Oxygen Saturation §Carbon Dioxide §Reflects Oxygenation §Reflects Ventilation §Sp. O 2 changes lag §Hypoventilation/Apne when patient is a detected immediately hypoventilating or §Should be used with apneic §Should be used with pulse Oximetry Capnography
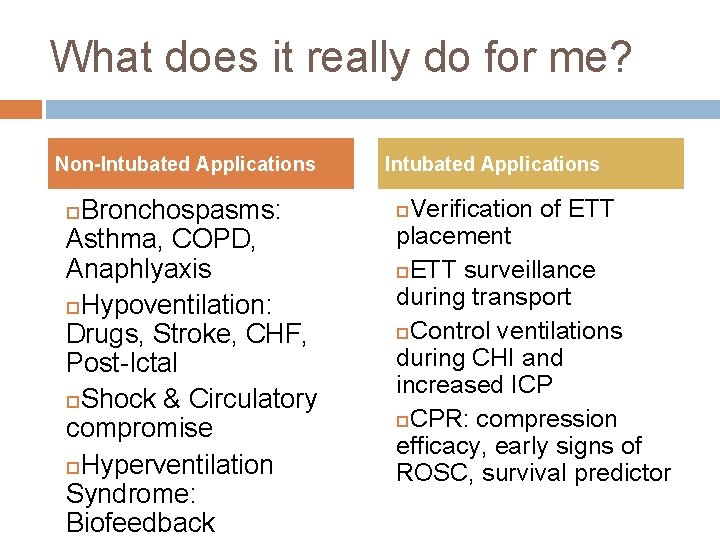
What does it really do for me? Non-Intubated Applications Bronchospasms: Asthma, COPD, Anaphlyaxis Hypoventilation: Drugs, Stroke, CHF, Post-Ictal Shock & Circulatory compromise Hyperventilation Syndrome: Biofeedback Intubated Applications Verification of ETT placement ETT surveillance during transport Control ventilations during CHI and increased ICP CPR: compression efficacy, early signs of ROSC, survival predictor
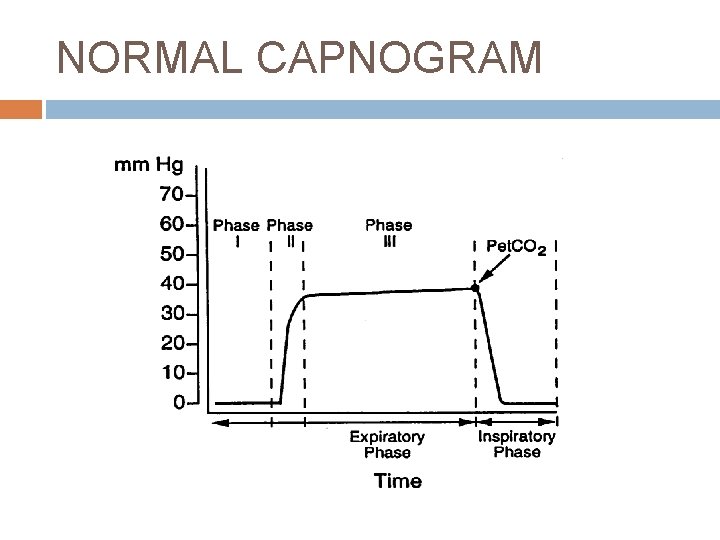
NORMAL CAPNOGRAM
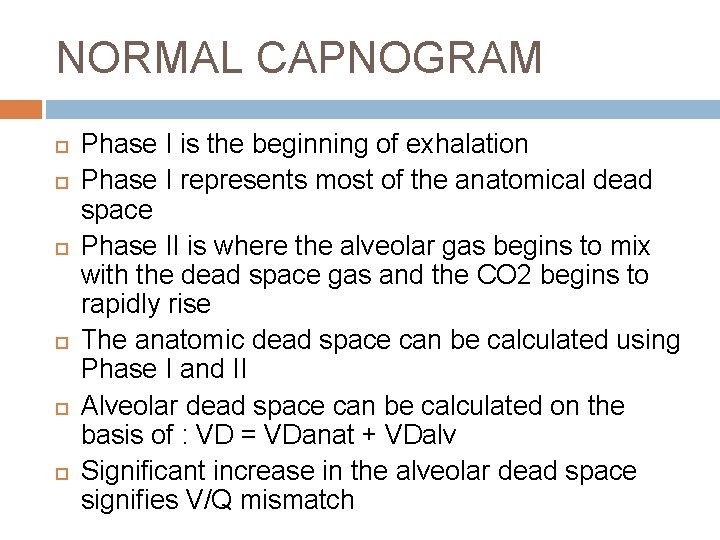
NORMAL CAPNOGRAM Phase I is the beginning of exhalation Phase I represents most of the anatomical dead space Phase II is where the alveolar gas begins to mix with the dead space gas and the CO 2 begins to rapidly rise The anatomic dead space can be calculated using Phase I and II Alveolar dead space can be calculated on the basis of : VD = VDanat + VDalv Significant increase in the alveolar dead space signifies V/Q mismatch
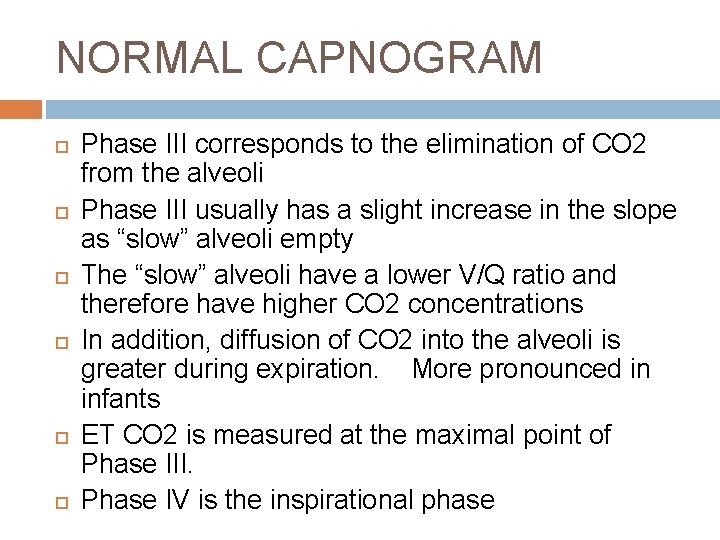
NORMAL CAPNOGRAM Phase III corresponds to the elimination of CO 2 from the alveoli Phase III usually has a slight increase in the slope as “slow” alveoli empty The “slow” alveoli have a lower V/Q ratio and therefore have higher CO 2 concentrations In addition, diffusion of CO 2 into the alveoli is greater during expiration. More pronounced in infants ET CO 2 is measured at the maximal point of Phase III. Phase IV is the inspirational phase
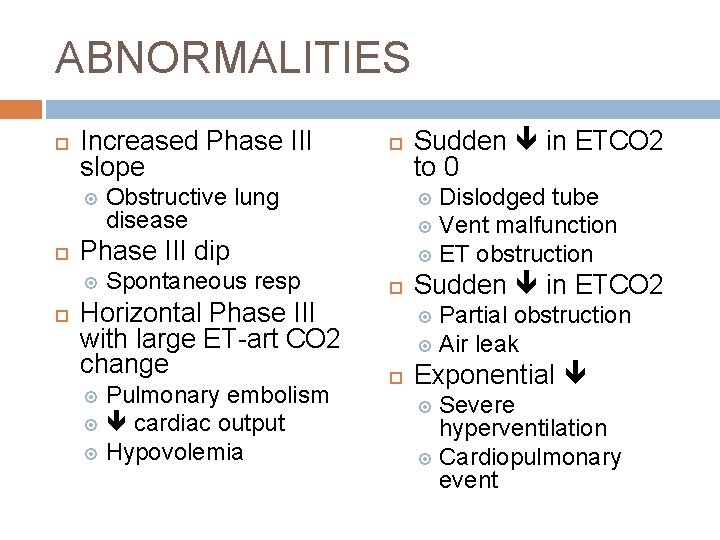
ABNORMALITIES Increased Phase III slope Obstructive lung disease Spontaneous resp Horizontal Phase III with large ET-art CO 2 change Pulmonary embolism cardiac output Hypovolemia Sudden in ETCO 2 to 0 Dislodged tube Vent malfunction ET obstruction Phase III dip Sudden in ETCO 2 Partial obstruction Air leak Exponential Severe hyperventilation Cardiopulmonary event
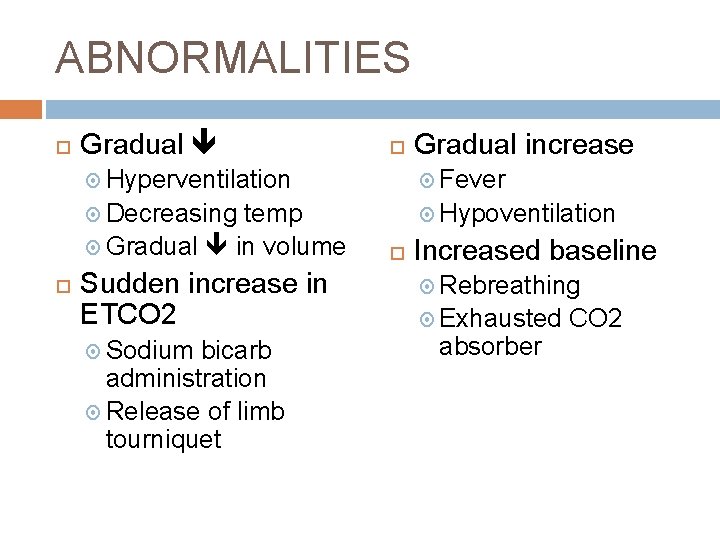
ABNORMALITIES Gradual increase Hyperventilation Fever Decreasing Hypoventilation temp Gradual in volume Sudden increase in ETCO 2 Sodium bicarb administration Release of limb tourniquet Increased baseline Rebreathing Exhausted absorber CO 2
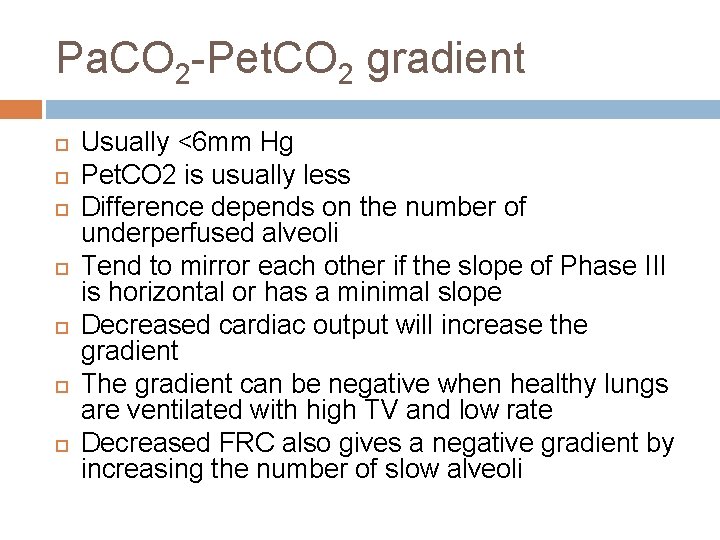
Pa. CO 2 -Pet. CO 2 gradient Usually <6 mm Hg Pet. CO 2 is usually less Difference depends on the number of underperfused alveoli Tend to mirror each other if the slope of Phase III is horizontal or has a minimal slope Decreased cardiac output will increase the gradient The gradient can be negative when healthy lungs are ventilated with high TV and low rate Decreased FRC also gives a negative gradient by increasing the number of slow alveoli
LIMITATIONS Critically ill patients often have rapidly changing dead space and V/Q mismatch Higher rates and smaller TV can increase the amount of dead space ventilation High mean airway pressures and PEEP restrict alveolar perfusion, leading to falsely decreased readings Low cardiac output will decrease the reading
USES Metabolic � Assess energy expenditure Cardiovascular � Monitor trend in cardiac output � Can use as an indirect Fick method, but actual numbers are hard to quantify � Measure of effectiveness in CPR � Diagnosis of pulmonary embolism: measure gradient
PULMONARY USES Effectiveness of therapy in bronchospasm Monitor Pa. CO 2 -Pet. CO 2 gradient Worsening indicated by rising Phase III without plateau Find optimal PEEP by following the gradient. Should be lowest at optimal PEEP. Can predict successful extubation. Dead space ratio to tidal volume ratio of >0. 6 predicts failure. Normal is 0. 33 -0. 45 Limited usefulness in weaning the vent when patient is unstable from cardiovascular or pulmonary standpoint Confirm ET tube placement
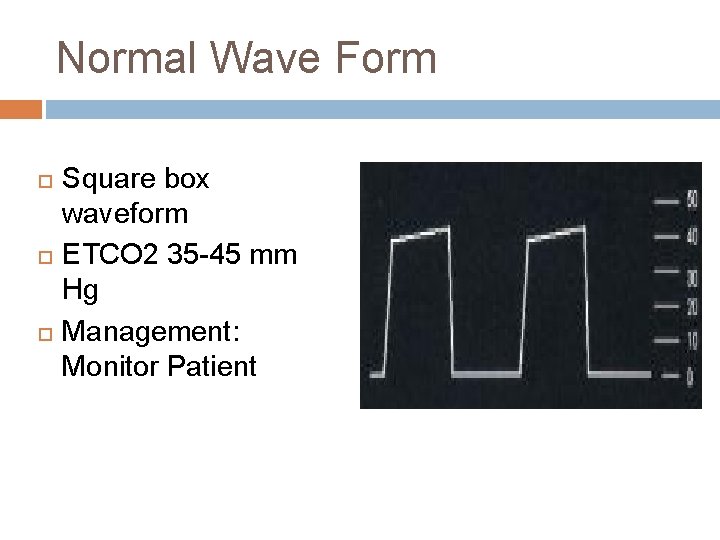
Normal Wave Form Square box waveform ETCO 2 35 -45 mm Hg Management: Monitor Patient
Dislodged ETT Loss of waveform Loss of ETCO 2 reading Management: Replace ETT
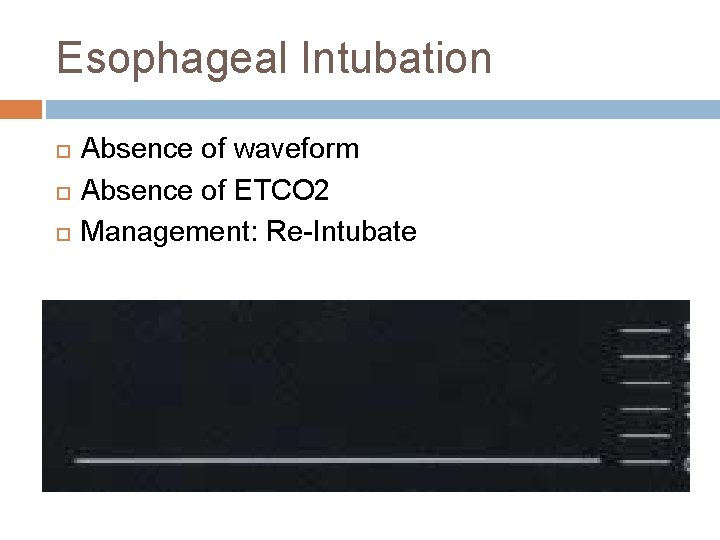
Esophageal Intubation Absence of waveform Absence of ETCO 2 Management: Re-Intubate
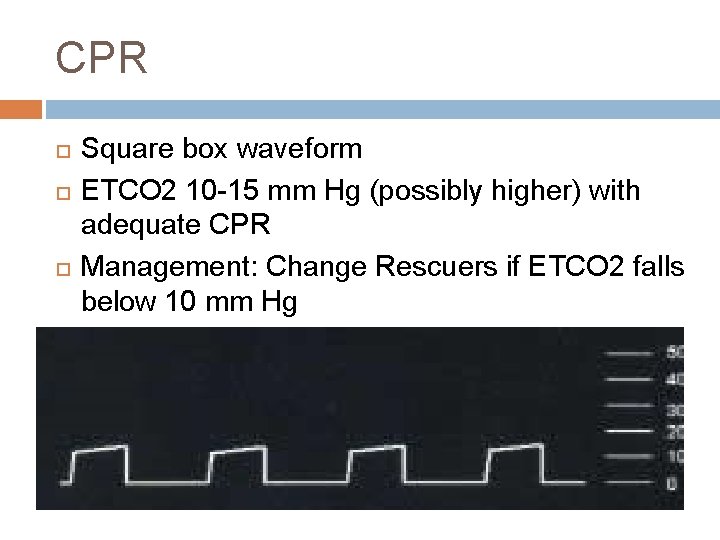
CPR Square box waveform ETCO 2 10 -15 mm Hg (possibly higher) with adequate CPR Management: Change Rescuers if ETCO 2 falls below 10 mm Hg
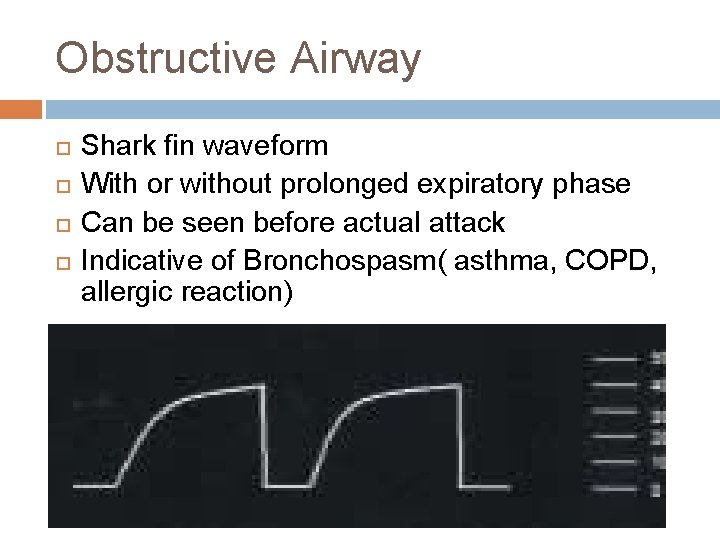
Obstructive Airway Shark fin waveform With or without prolonged expiratory phase Can be seen before actual attack Indicative of Bronchospasm( asthma, COPD, allergic reaction)
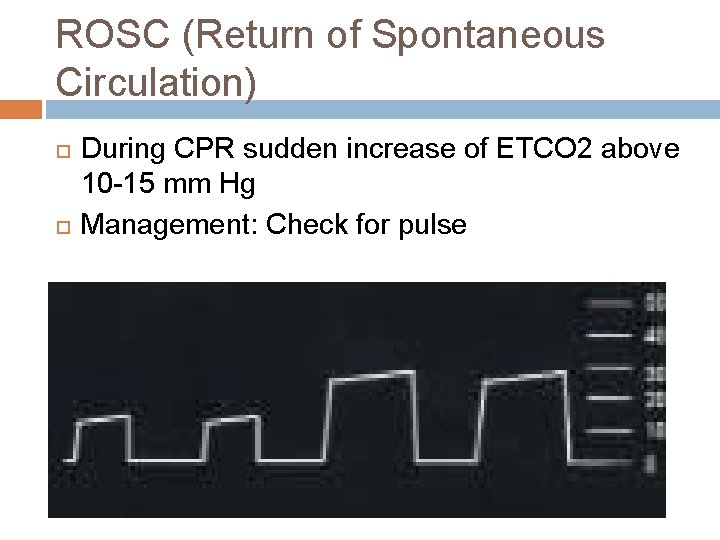
ROSC (Return of Spontaneous Circulation) During CPR sudden increase of ETCO 2 above 10 -15 mm Hg Management: Check for pulse
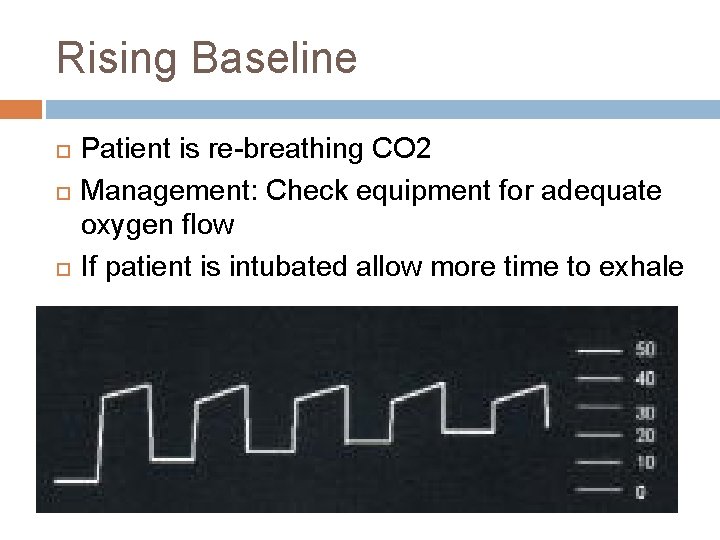
Rising Baseline Patient is re-breathing CO 2 Management: Check equipment for adequate oxygen flow If patient is intubated allow more time to exhale
Hypoventilation Prolonged waveform ETCO 2 >45 mm Hg Management: Assist ventilations or intubate as needed
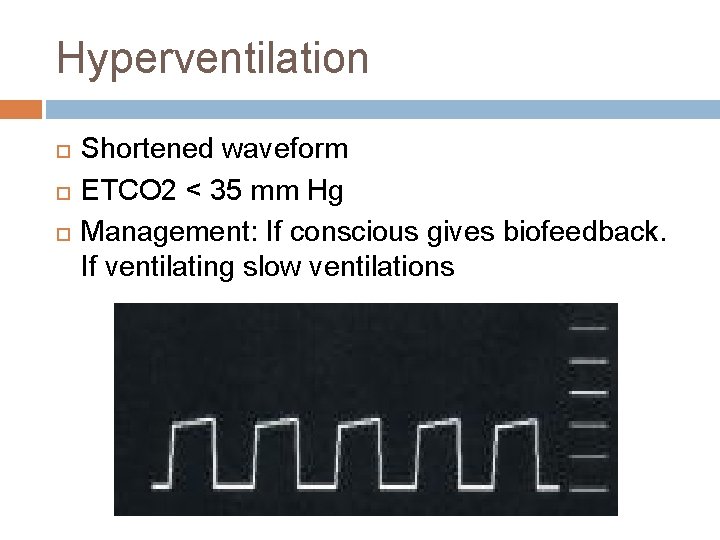
Hyperventilation Shortened waveform ETCO 2 < 35 mm Hg Management: If conscious gives biofeedback. If ventilating slow ventilations
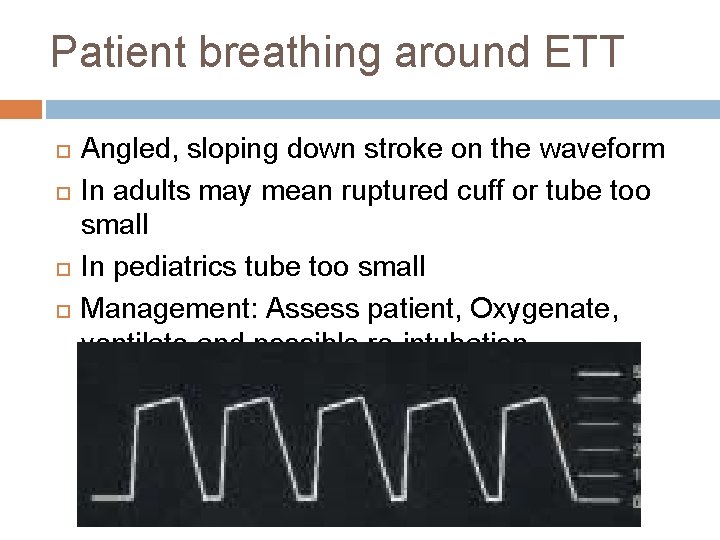
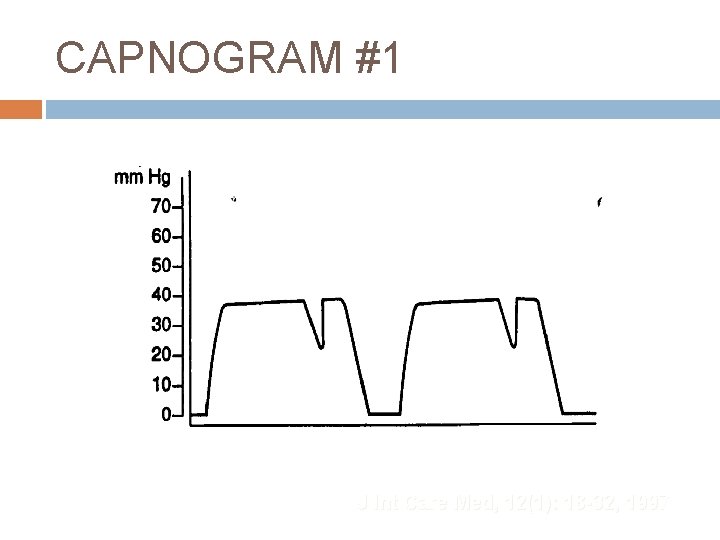
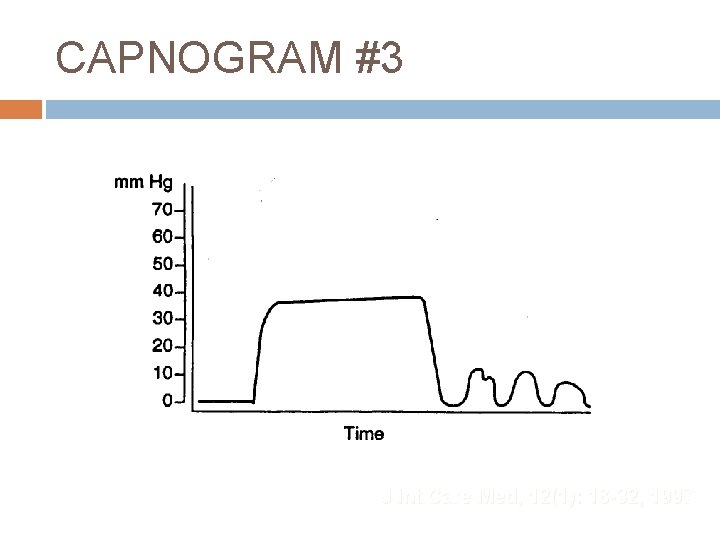
Patient breathing around ETT Angled, sloping down stroke on the waveform In adults may mean ruptured cuff or tube too small In pediatrics tube too small Management: Assess patient, Oxygenate, ventilate and possible re-intubation
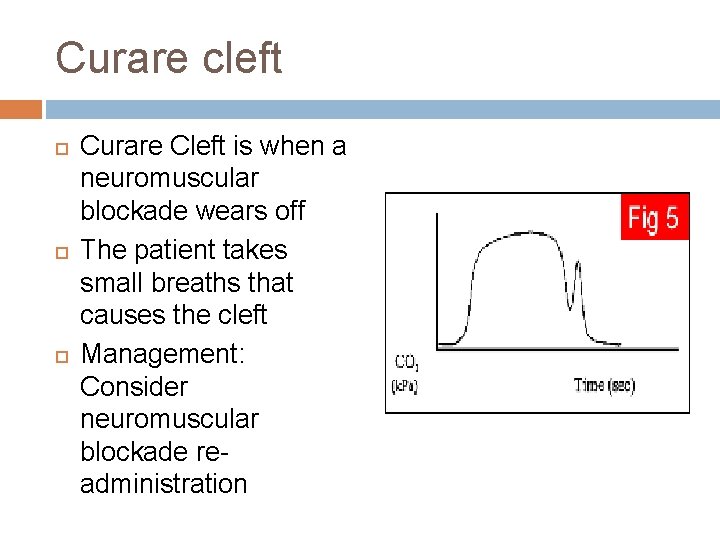
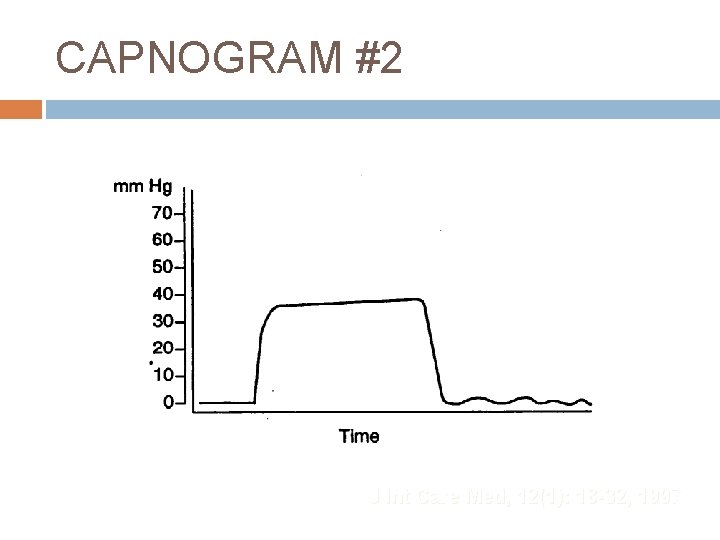
Curare cleft Curare Cleft is when a neuromuscular blockade wears off The patient takes small breaths that causes the cleft Management: Consider neuromuscular blockade readministration
CAPNOGRAM #1 J Int Care Med, 12(1): 18 -32, 1997
CAPNOGRAM #2 J Int Care Med, 12(1): 18 -32, 1997
CAPNOGRAM #3 J Int Care Med, 12(1): 18 -32, 1997
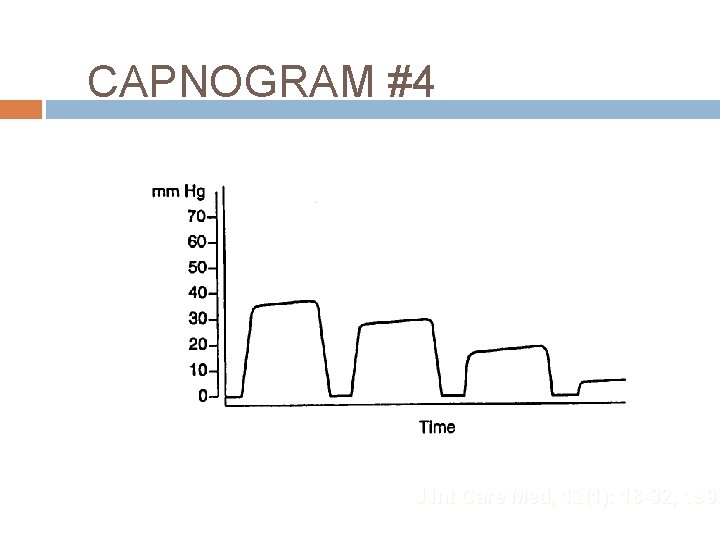
CAPNOGRAM #4 J Int Care Med, 12(1): 18 -32, 1997
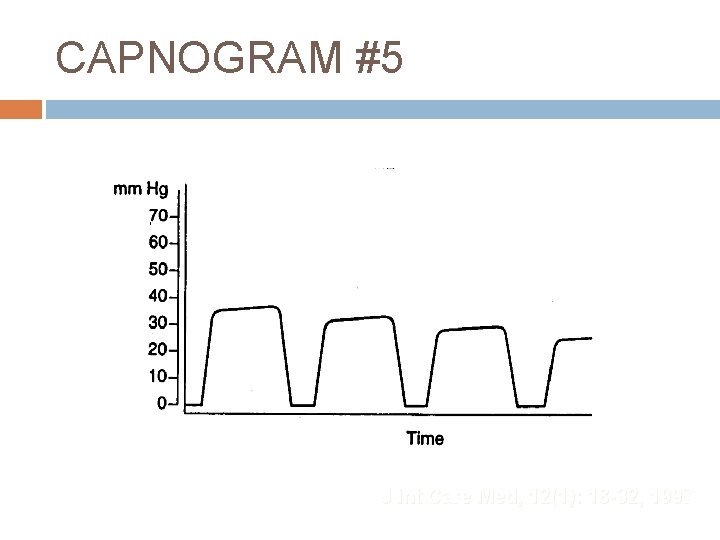
CAPNOGRAM #5 J Int Care Med, 12(1): 18 -32, 1997
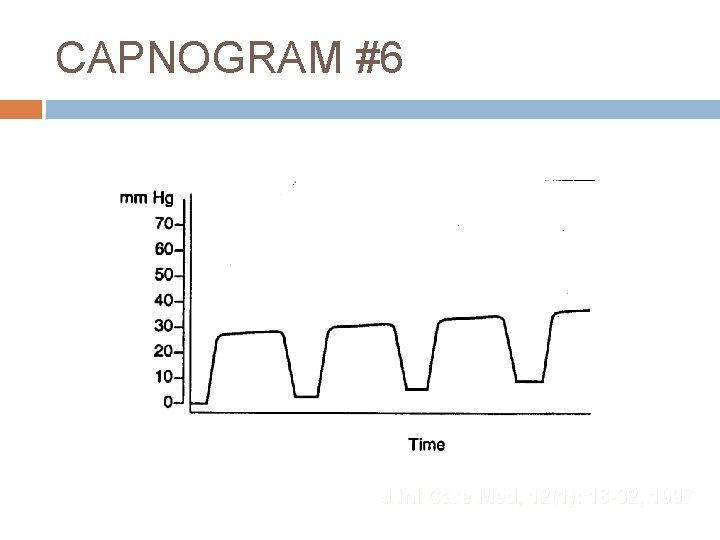
CAPNOGRAM #6 J Int Care Med, 12(1): 18 -32, 1997
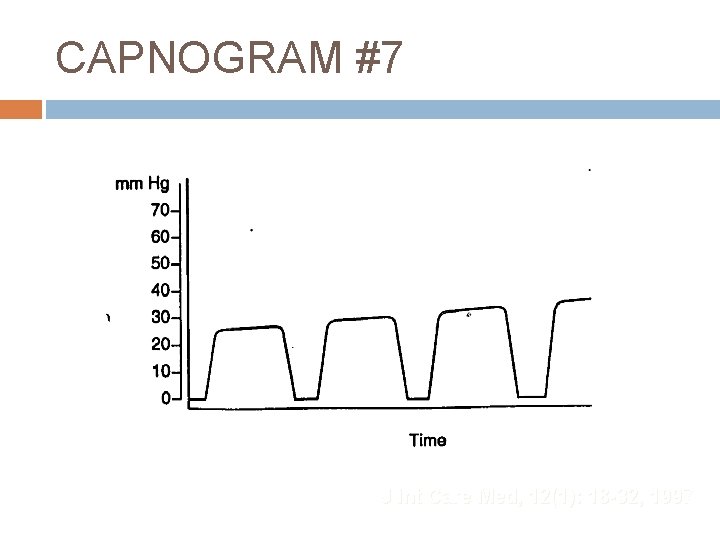
CAPNOGRAM #7 J Int Care Med, 12(1): 18 -32, 1997
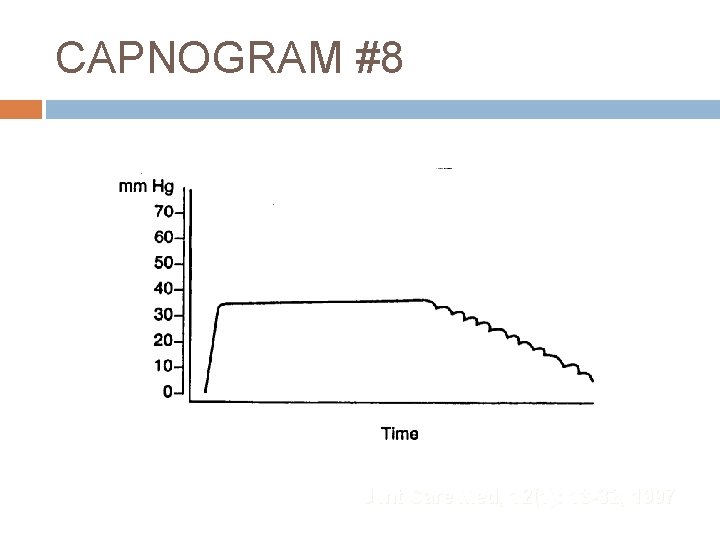
CAPNOGRAM #8 J Int Care Med, 12(1): 18 -32, 1997
Now what does all this mean to me? ETCO 2 is a great tool to help monitor the patients breath to breath status. Can help recognize airway obstructions before the patient has signs of attacks Helps you control the ETCO 2 of head injuries Can help to identify ROSC in cardiac arrest