What is Cluster Analysis Cluster a collection of


 Birch: Balanced Iterative Reducing and Clustering using Hierarchies, by Zhang, Ramakrishnan, Livny")
 N: Number of data")


- Slides: 104
What is Cluster Analysis? Cluster: a collection of data objects n n Similar to one another within the same cluster Dissimilar to the objects in other clusters Cluster analysis n Grouping a set of data objects into clusters Clustering is unsupervised classification: no predefined classes Typical applications n n As a stand-alone tool to get insight into data distribution As a preprocessing step for other algorithms Α. Νανόπουλος, Γ. Μανωλόπουλος: Εισαγωγή στην Εξόρυξη & Αποθ. Δεδομένων 2
General Applications of Clustering Pattern Recognition Spatial Data Analysis n create thematic maps in GIS by clustering feature spaces n detect spatial clusters and explain them in spatial data mining Image Processing Economic Science (especially market research) WWW n Document classification n Cluster Weblog data to discover groups of similar access patterns Α. Νανόπουλος, Γ. Μανωλόπουλος: Εισαγωγή στην Εξόρυξη & Αποθ. Δεδομένων 3
What Is Good Clustering? A good clustering method will produce high quality clusters with n high intra-class similarity n low inter-class similarity The quality of a clustering result depends on both the similarity measure used by the method and its implementation. The quality of a clustering method is also measured by its ability to discover some or all of the hidden patterns. Α. Νανόπουλος, Γ. Μανωλόπουλος: Εισαγωγή στην Εξόρυξη & Αποθ. Δεδομένων 4
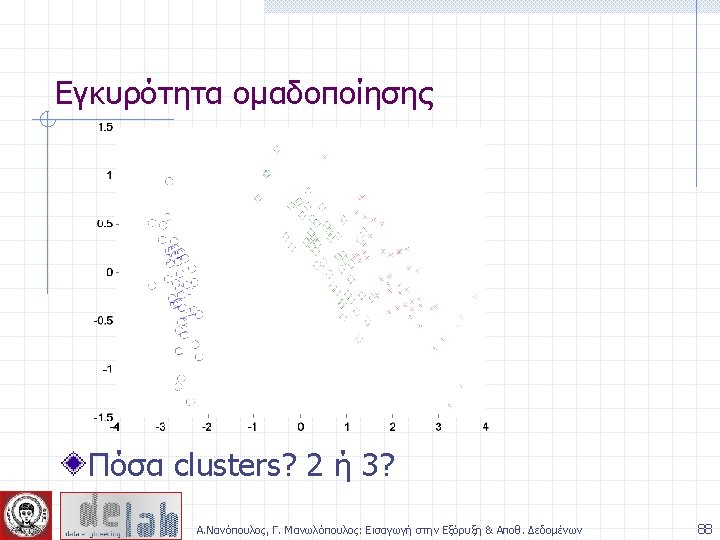
Notion of a Cluster can be Ambiguous How many clusters? Six Clusters Two Clusters Four Clusters Α. Νανόπουλος, Γ. Μανωλόπουλος: Εισαγωγή στην Εξόρυξη & Αποθ. Δεδομένων 5
Types of Clusters: Well-Separated Clusters: n A cluster is a set of points such that any point in a cluster is closer (or more similar) to every other point in the cluster than to any point not in the cluster. 3 well-separated clusters Α. Νανόπουλος, Γ. Μανωλόπουλος: Εισαγωγή στην Εξόρυξη & Αποθ. Δεδομένων 6
Types of Clusters: Density-Based Density-based n n A cluster is a dense region of points, which is separated by low-density regions, from other regions of high density. Used when the clusters are irregular or intertwined, and when noise and outliers are present. 6 density-based clusters Α. Νανόπουλος, Γ. Μανωλόπουλος: Εισαγωγή στην Εξόρυξη & Αποθ. Δεδομένων 7
Types of Clusters: Conceptual Clusters Shared Property or Conceptual Clusters n Finds clusters that share some common property or represent a particular concept. . 2 Overlapping Circles Α. Νανόπουλος, Γ. Μανωλόπουλος: Εισαγωγή στην Εξόρυξη & Αποθ. Δεδομένων 8
Requirements of Clustering in Data Mining Scalability Ability to deal with different types of attributes Discovery of clusters with arbitrary shape Minimal requirements for domain knowledge to determine input parameters Able to deal with noise and outliers Insensitive to order of input records High dimensionality Incorporation of user-specified constraints Interpretability and usability Α. Νανόπουλος, Γ. Μανωλόπουλος: Εισαγωγή στην Εξόρυξη & Αποθ. Δεδομένων 9
Chapter 8. Cluster Analysis What is Cluster Analysis? Types of Data in Cluster Analysis A Categorization of Major Clustering Methods Partitioning Methods Hierarchical Methods Density-Based Methods Grid-Based Methods Model-Based Clustering Methods Outlier Analysis Summary Α. Νανόπουλος, Γ. Μανωλόπουλος: Εισαγωγή στην Εξόρυξη & Αποθ. Δεδομένων 10
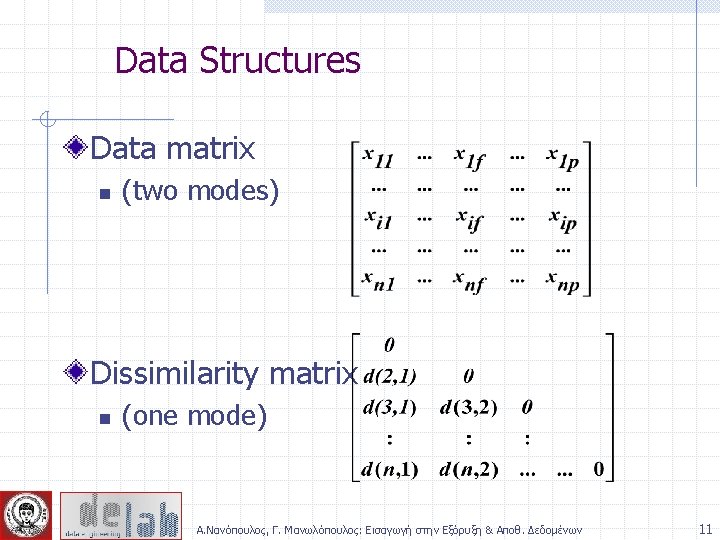
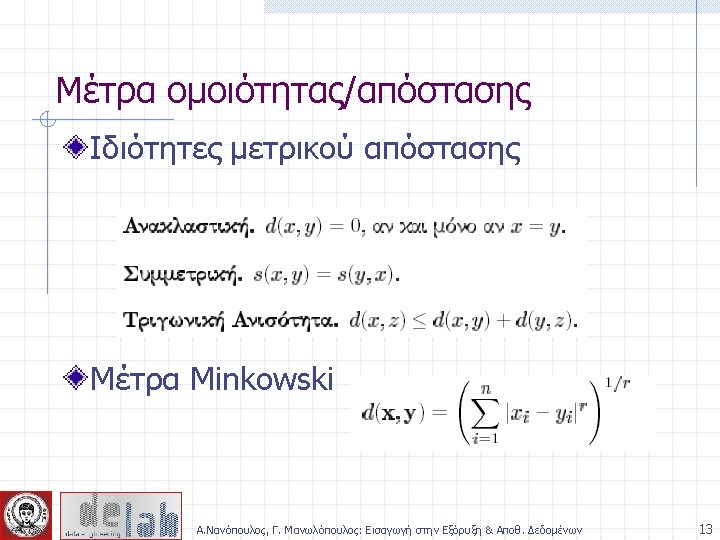
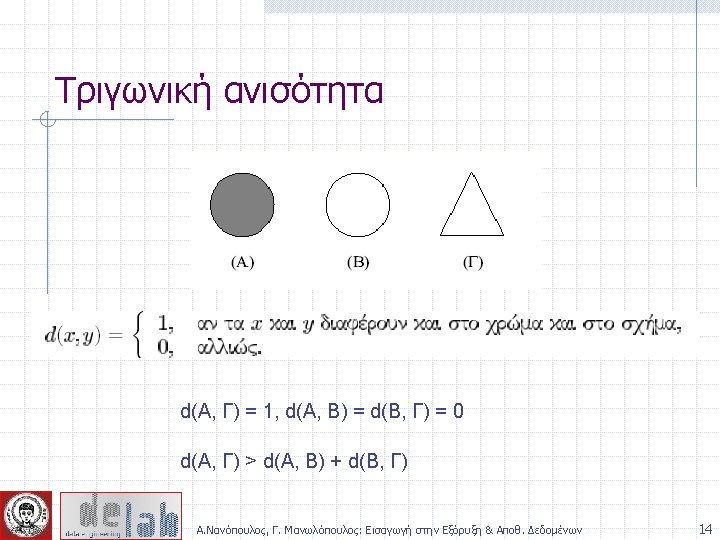
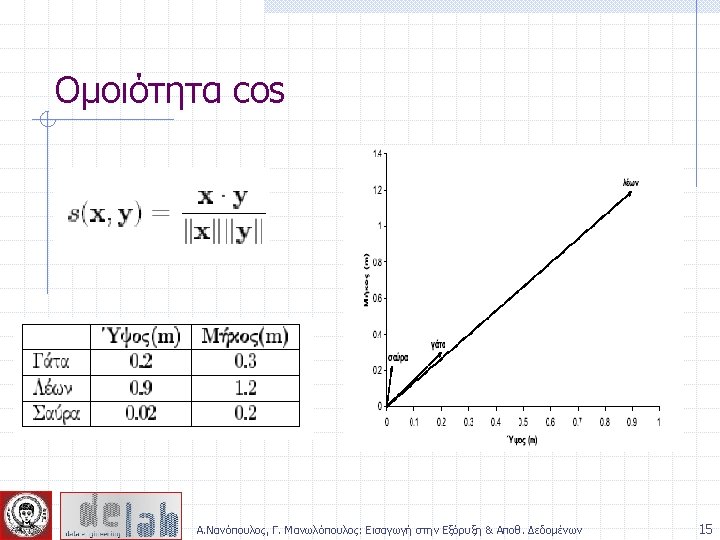
Measure the Quality of Clustering Dissimilarity/Similarity metric: Similarity is expressed in terms of a distance function, which is typically metric: d(i, j) There is a separate “quality” function that measures the “goodness” of a cluster. The definitions of distance functions are usually very different for interval-scaled, boolean, categorical, ordinal and ratio variables. Weights should be associated with different variables based on applications and data semantics. It is hard to define “similar enough” or “good enough” n the answer is typically highly subjective. Α. Νανόπουλος, Γ. Μανωλόπουλος: Εισαγωγή στην Εξόρυξη & Αποθ. Δεδομένων 12
Binary Variables A contingency table for binary data Object j Object i Simple matching coefficient (invariant, if the binary variable is symmetric): Jaccard coefficient (noninvariant if the binary variable is asymmetric): Α. Νανόπουλος, Γ. Μανωλόπουλος: Εισαγωγή στην Εξόρυξη & Αποθ. Δεδομένων 17
Dissimilarity between Binary Variables Example n n n gender is a symmetric attribute the remaining attributes are asymmetric binary let the values Y and P be set to 1, and the value N be set to 0 Α. Νανόπουλος, Γ. Μανωλόπουλος: Εισαγωγή στην Εξόρυξη & Αποθ. Δεδομένων 18
Variables of Mixed Types A database may contain all the types of variables n symmetric binary, asymmetric binary, nominal, ordinal, interval One may use a weighted formula to combine their effects. n n n f is binary or nominal: dij(f) = 0 if xif = xjf , or dij(f) = 1 o. w. f is interval-based: use the normalized distance f is ordinal or ratio-scaled w compute ranks rif and w and treat zif as interval-scaled Α. Νανόπουλος, Γ. Μανωλόπουλος: Εισαγωγή στην Εξόρυξη & Αποθ. Δεδομένων 19
Chapter 8. Cluster Analysis What is Cluster Analysis? Types of Data in Cluster Analysis A Categorization of Major Clustering Methods Partitioning Methods Hierarchical Methods Density-Based Methods Grid-Based Methods Outlier Analysis Summary Α. Νανόπουλος, Γ. Μανωλόπουλος: Εισαγωγή στην Εξόρυξη & Αποθ. Δεδομένων 20
Major Clustering Approaches Partitioning algorithms: Construct various partitions and then evaluate them by some criterion Hierarchy algorithms: Create a hierarchical decomposition of the set of data (or objects) using some criterion Density-based: based on connectivity and density functions Grid-based: based on a multiple-level granularity structure Model-based: A model is hypothesized for each of the clusters and the idea is to find the best fit of that model to each other Α. Νανόπουλος, Γ. Μανωλόπουλος: Εισαγωγή στην Εξόρυξη & Αποθ. Δεδομένων 21
Chapter 8. Cluster Analysis What is Cluster Analysis? Types of Data in Cluster Analysis A Categorization of Major Clustering Methods Partitioning Methods Hierarchical Methods Density-Based Methods Grid-Based Methods Outlier Analysis Summary Α. Νανόπουλος, Γ. Μανωλόπουλος: Εισαγωγή στην Εξόρυξη & Αποθ. Δεδομένων 22
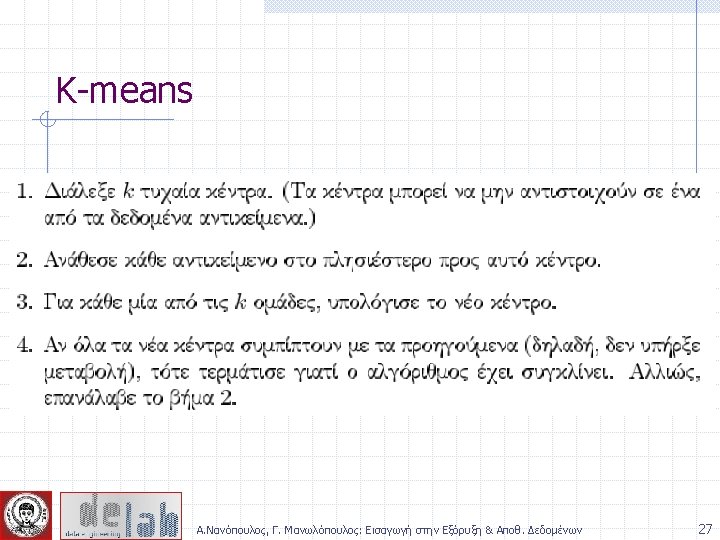
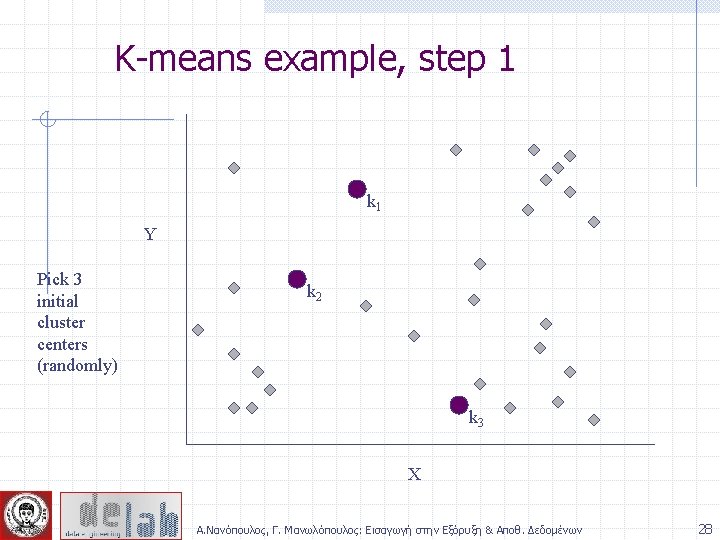
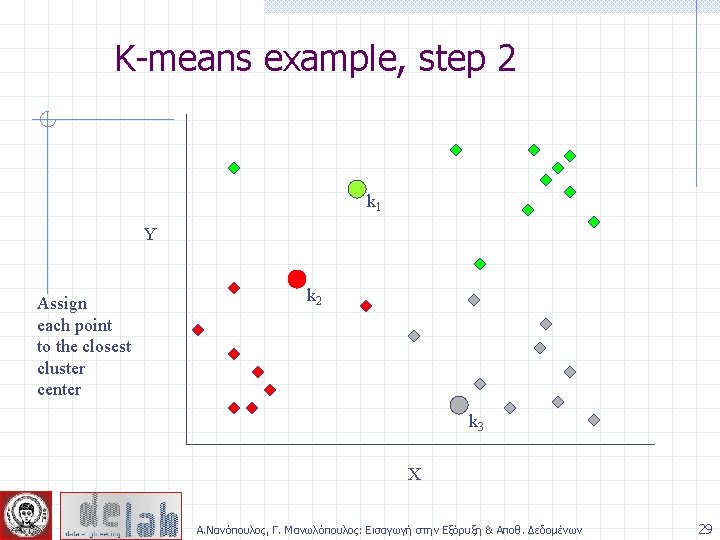
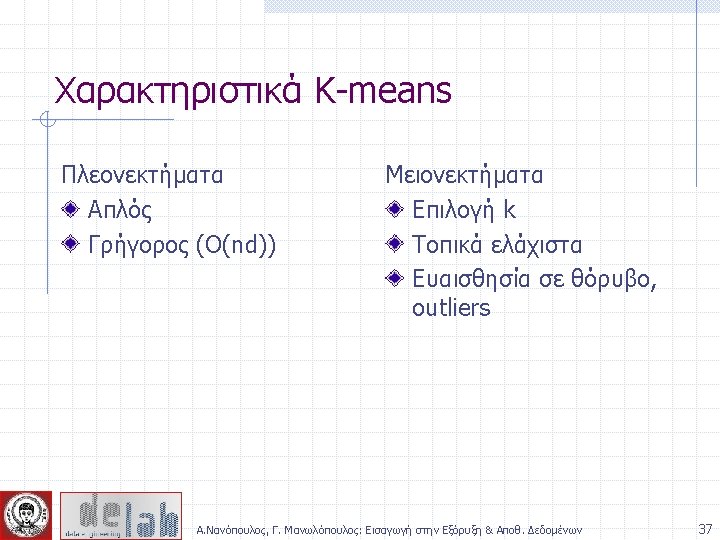
Partitioning Algorithms: Basic Concept Partitioning method: Construct a partition of a database D of n objects into a set of k clusters Given a k, find a partition of k clusters that optimizes the chosen partitioning criterion n Global optimal: exhaustively enumerate all partitions n Heuristic methods: k-means and k-medoids algorithms n k-means (Mac. Queen’ 67): Each cluster is represented by the center of the cluster n k-medoids or PAM (Partition around medoids) (Kaufman & Rousseeuw’ 87): Each cluster is represented by one of the objects in the cluster Α. Νανόπουλος, Γ. Μανωλόπουλος: Εισαγωγή στην Εξόρυξη & Αποθ. Δεδομένων 23
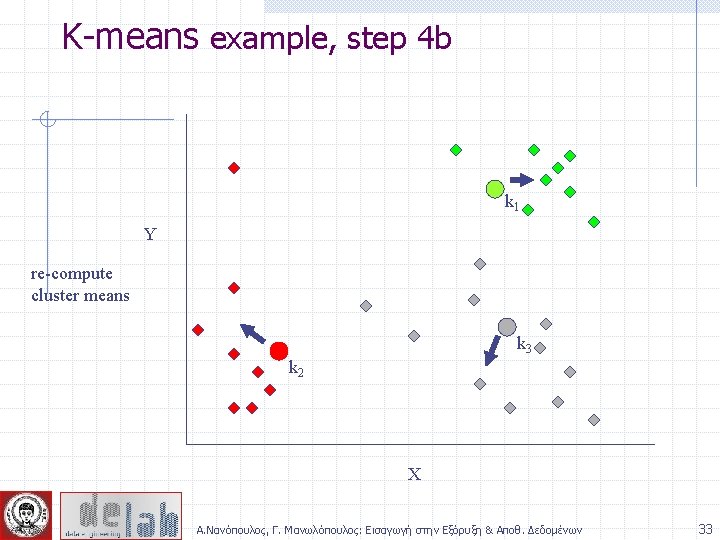
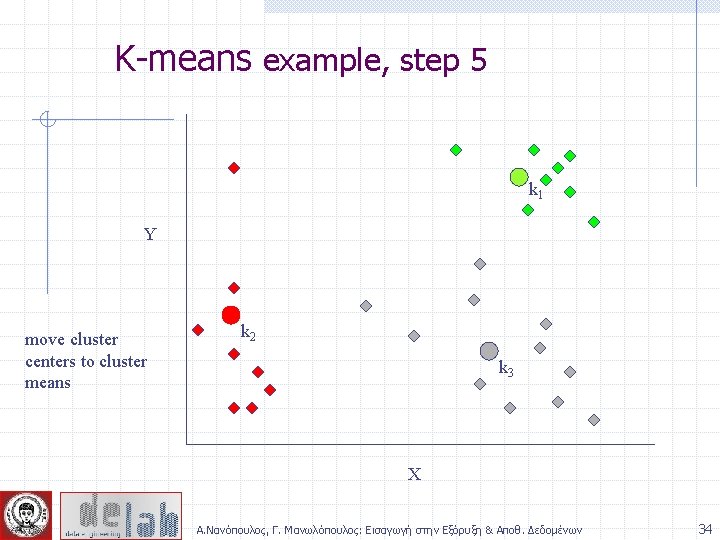
K-means example, step 3 k 1 Y Move each cluster center to the mean of each cluster k 2 k 3 X Α. Νανόπουλος, Γ. Μανωλόπουλος: Εισαγωγή στην Εξόρυξη & Αποθ. Δεδομένων 30
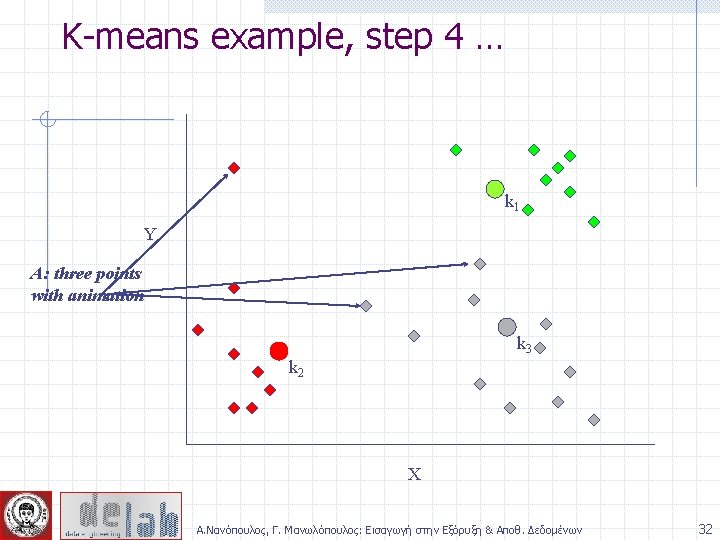
K-means example, step 4 Reassign points Y closest to a different new cluster center k 1 Q: Which points are reassigned? k 3 k 2 X Α. Νανόπουλος, Γ. Μανωλόπουλος: Εισαγωγή στην Εξόρυξη & Αποθ. Δεδομένων 31
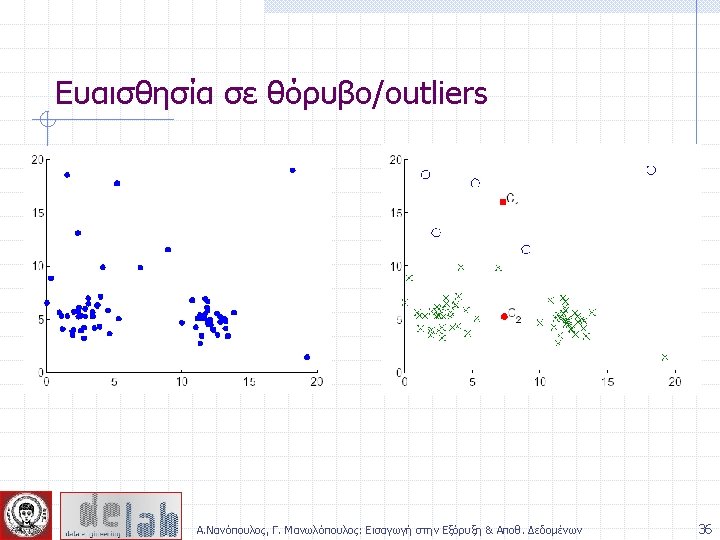
K-means variations K-medoids – instead of mean, use medians of each cluster Mean of 1, 3, 5, 7, 95 is 205 n Mean of 1, 3, 5, 7, 1009 is 5 is n Median of 1, 3, 5, 7, 1009 n Median advantage: not affected by extreme values n For large databases, use sampling Α. Νανόπουλος, Γ. Μανωλόπουλος: Εισαγωγή στην Εξόρυξη & Αποθ. Δεδομένων 38
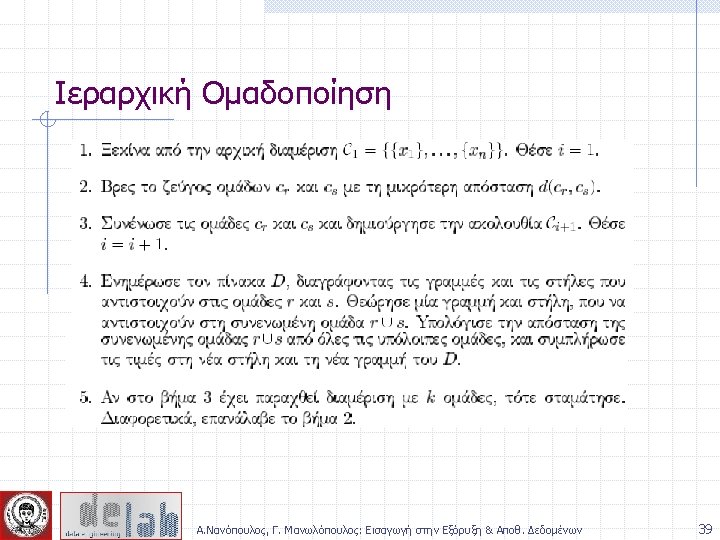
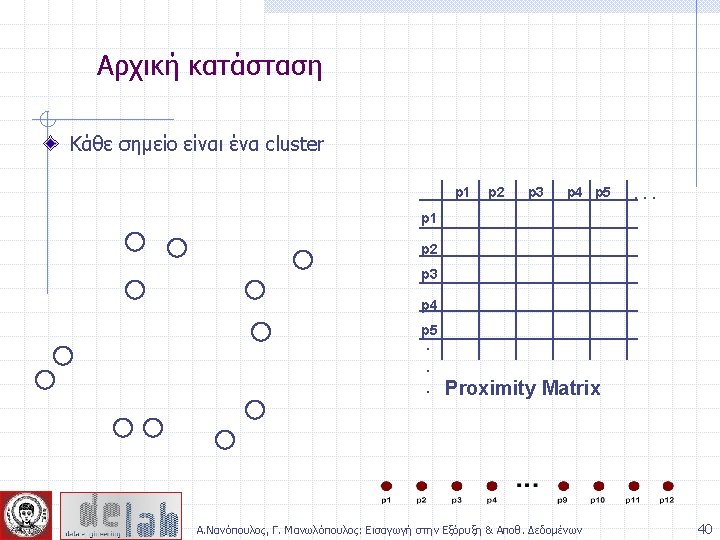
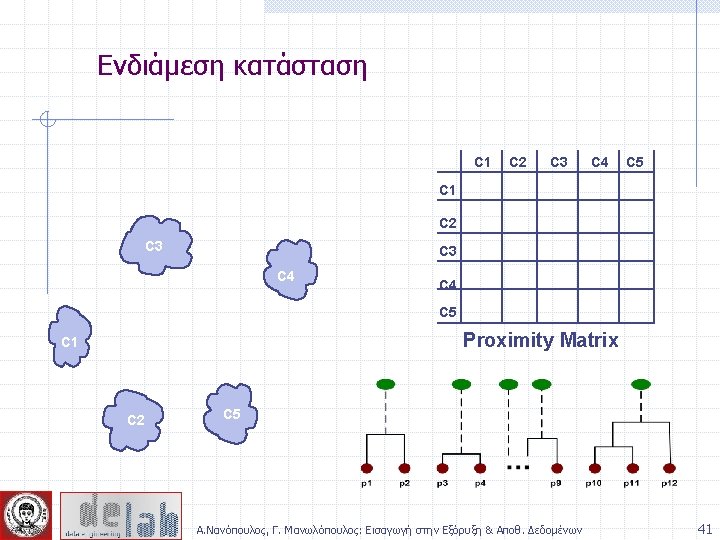
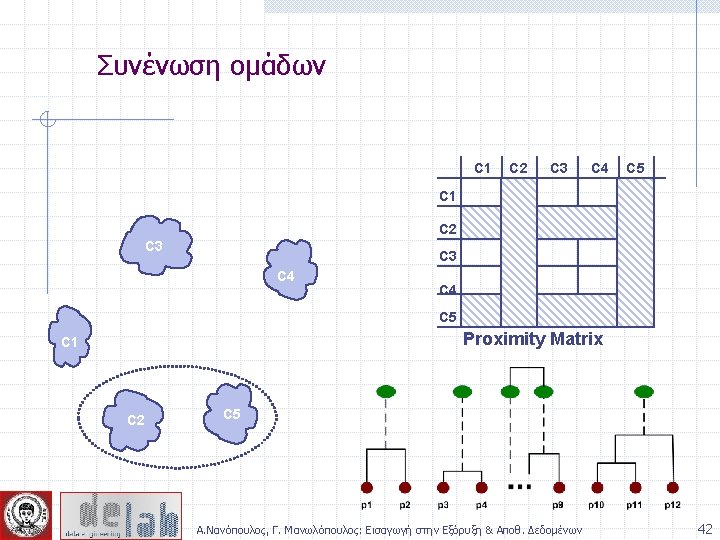
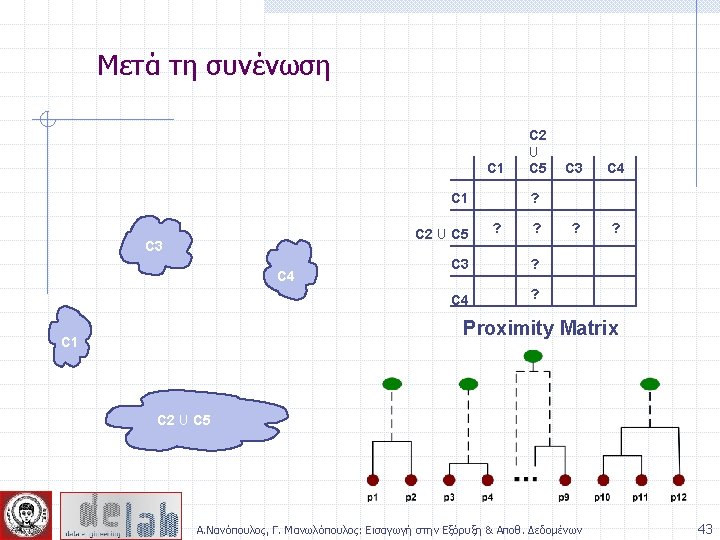
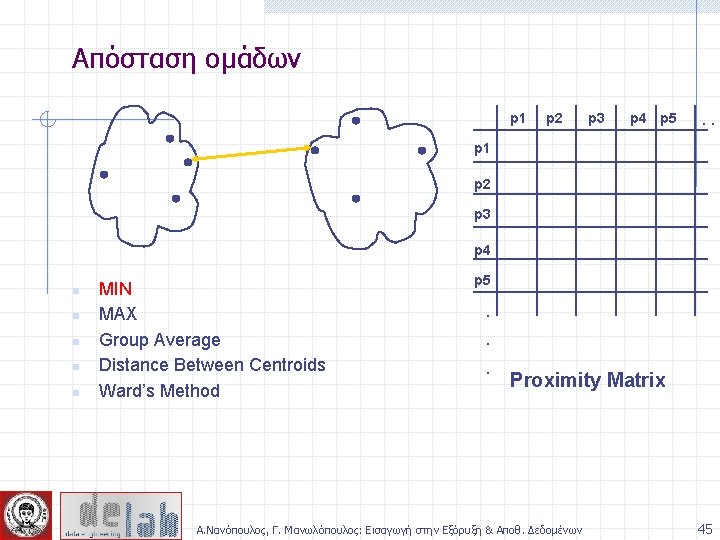
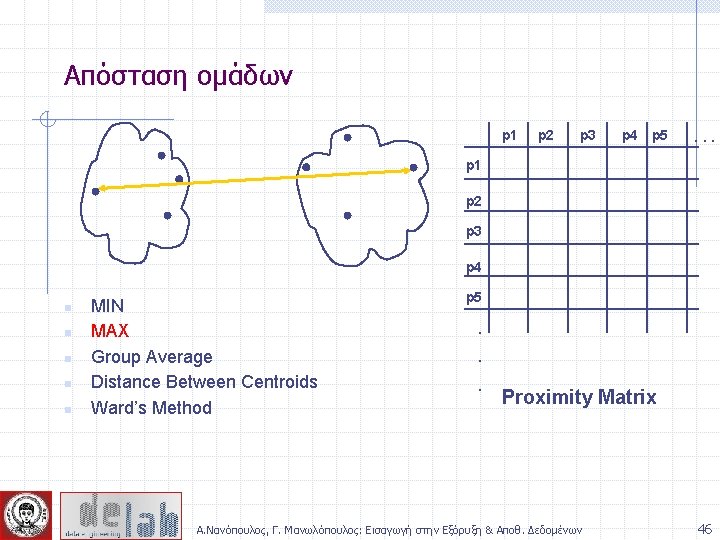
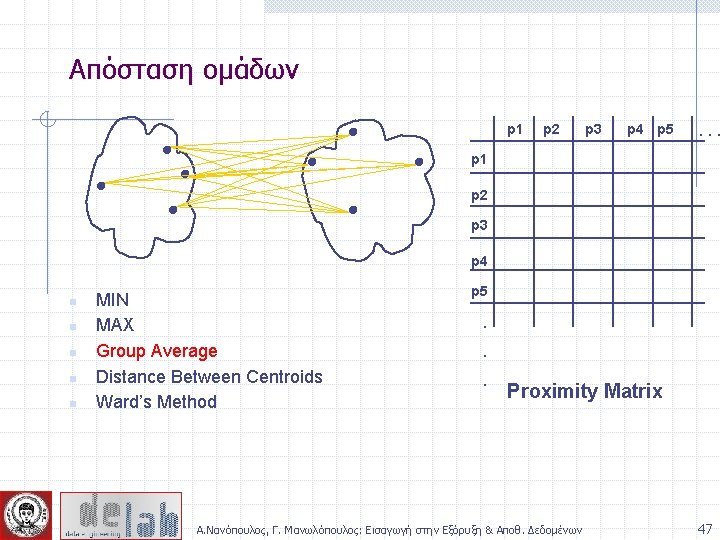
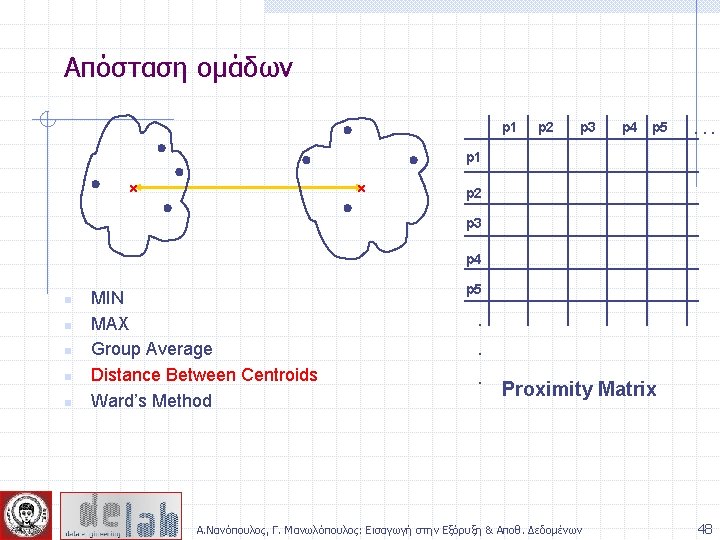
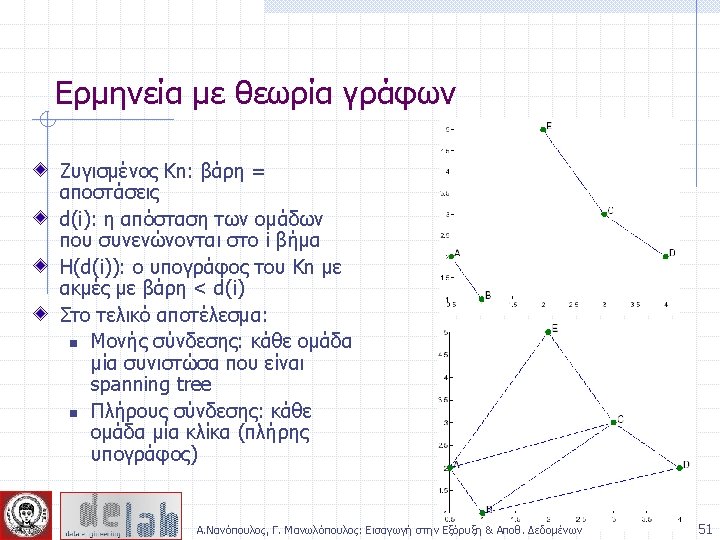
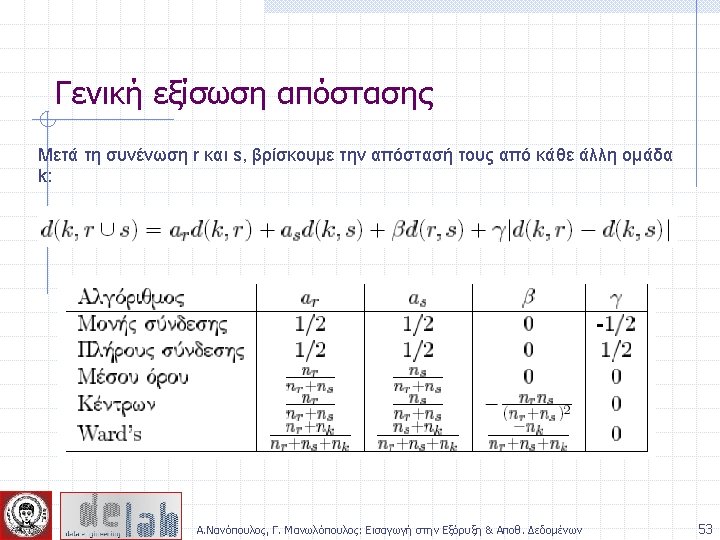
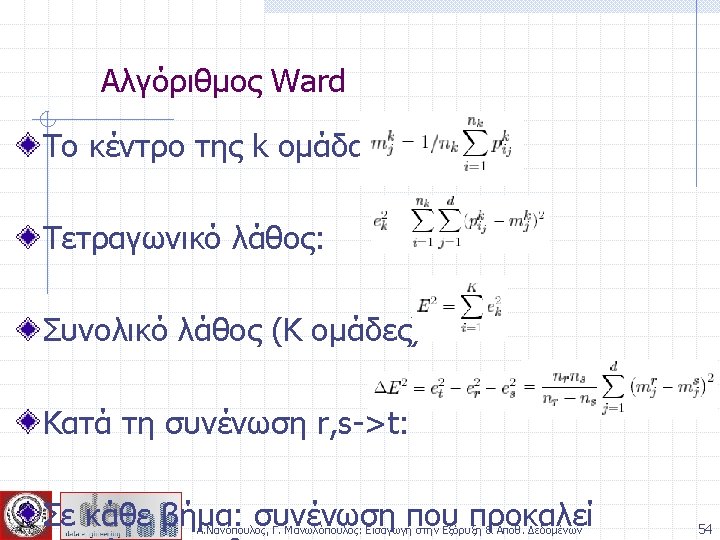
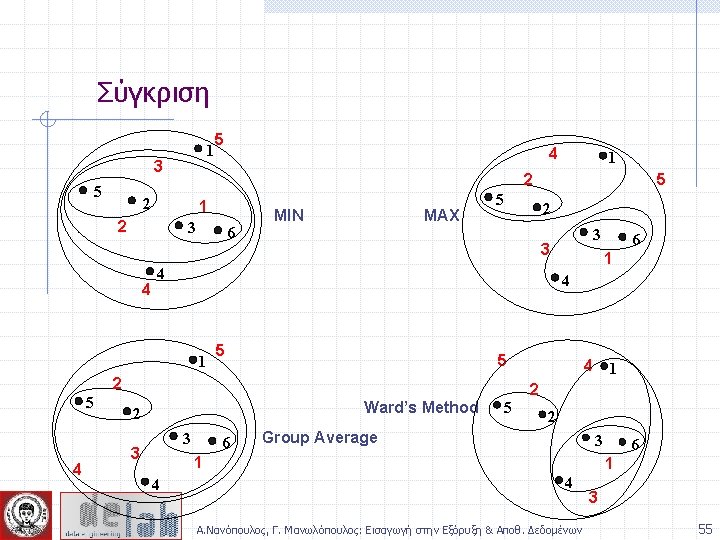
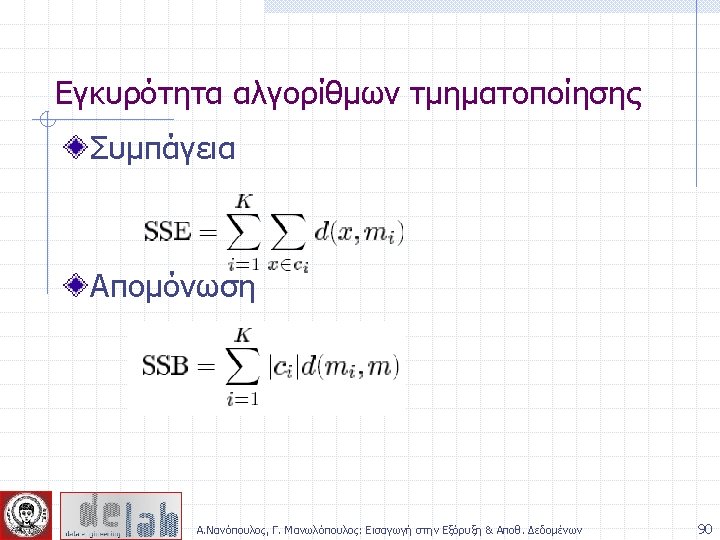
Απόσταση ομάδων p 1 Similarity? p 2 p 3 p 4 p 5 . . p 1 p 2 p 3 p 4 n n n MIN MAX Group Average Distance Between Centroids Ward’s Method (squared error) p 5 . . . Proximity Matrix Α. Νανόπουλος, Γ. Μανωλόπουλος: Εισαγωγή στην Εξόρυξη & Αποθ. Δεδομένων 44
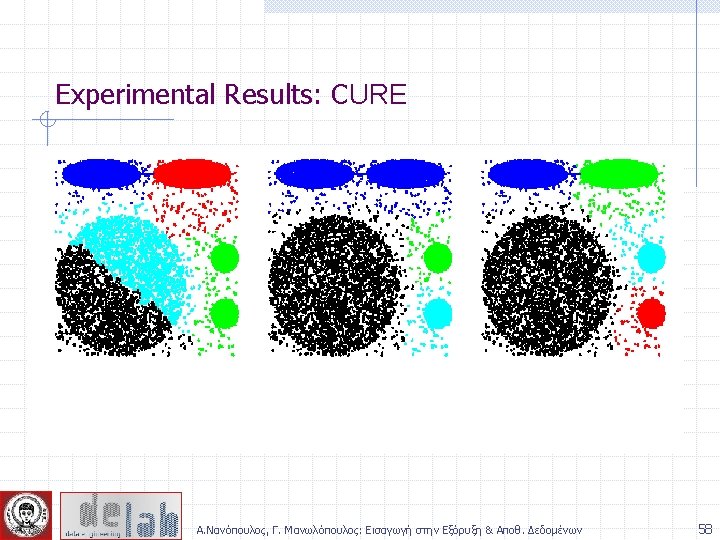
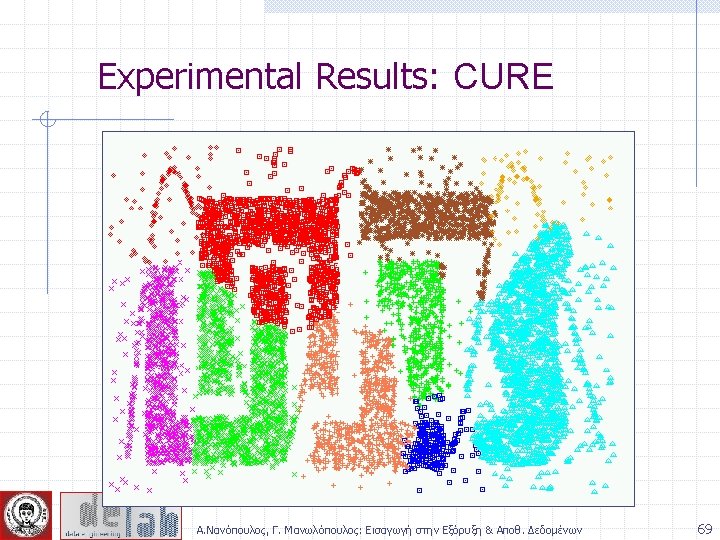
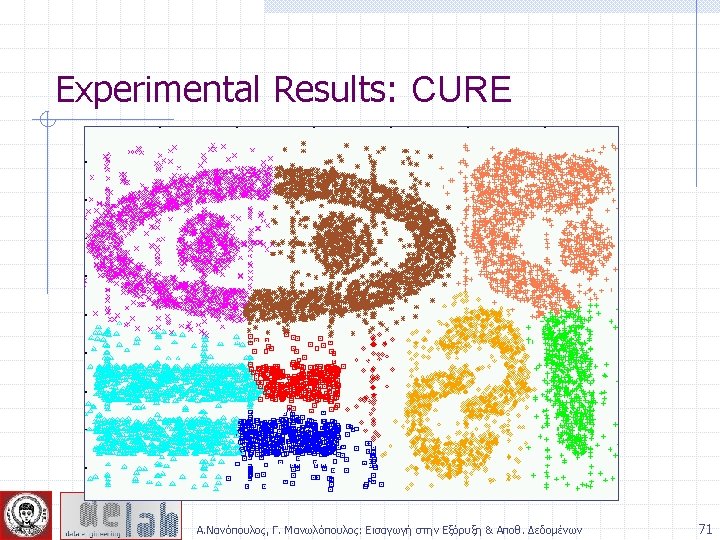
CURE: Another Hierarchical Approach Uses a number of points to represent a cluster Representative points are found by selecting a constant number of points from a cluster and then “shrinking” them toward the center of the cluster Cluster similarity is the similarity of the closest pair of representative points from different clusters Α. Νανόπουλος, Γ. Μανωλόπουλος: Εισαγωγή στην Εξόρυξη & Αποθ. Δεδομένων 57
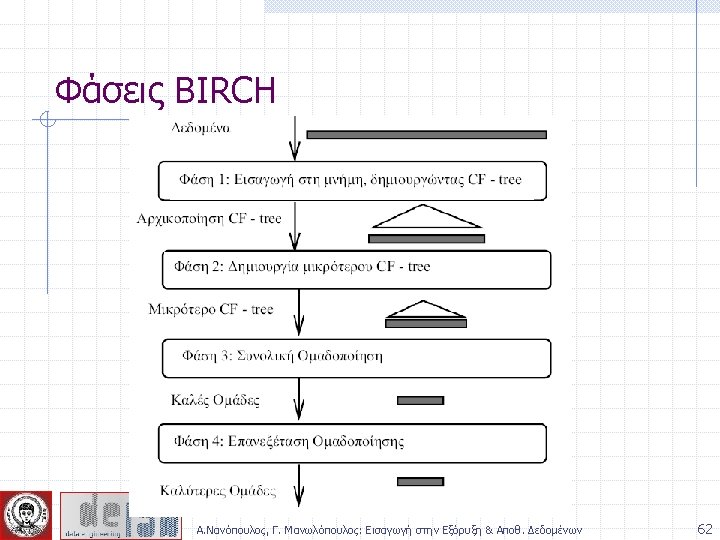
BIRCH (1996) Birch: Balanced Iterative Reducing and Clustering using Hierarchies, by Zhang, Ramakrishnan, Livny (SIGMOD’ 96) Incrementally construct a CF (Clustering Feature) tree, a hierarchical data structure for multiphase clustering n n Phase 1: scan DB to build an initial in-memory CF tree (a multi-level compression of the data that tries to preserve the inherent clustering structure of the data) Phase 2: use an arbitrary clustering algorithm to cluster the leaf nodes of the CF-tree Scales linearly: finds a good clustering with a single scan and improves the quality with a few additional scans Weakness: handles only numeric data, and sensitive to the order of the data record. Α. Νανόπουλος, Γ. Μανωλόπουλος: Εισαγωγή στην Εξόρυξη & Αποθ. Δεδομένων 59
Clustering Feature Vector Clustering Feature: CF = (N, LS, SS) N: Number of data points LS: Ni=1=Xi SS: Ni=1=Xi 2 CF = (5, (16, 30), (54, 190)) (3, 4) (2, 6) (4, 5) (4, 7) (3, 8) Α. Νανόπουλος, Γ. Μανωλόπουλος: Εισαγωγή στην Εξόρυξη & Αποθ. Δεδομένων 60
CF Tree Root B=7 CF 1 CF 2 CF 3 CF 6 L=6 child 1 child 2 child 3 child 6 Non-leaf node CF 1 CF 2 CF 3 CF 5 child 1 child 2 child 3 child 5 Leaf node prev CF 1 CF 2 CF 6 Leaf node next prev CF 1 CF 2 CF 4 Α. Νανόπουλος, Γ. Μανωλόπουλος: Εισαγωγή στην Εξόρυξη & Αποθ. Δεδομένων next 61
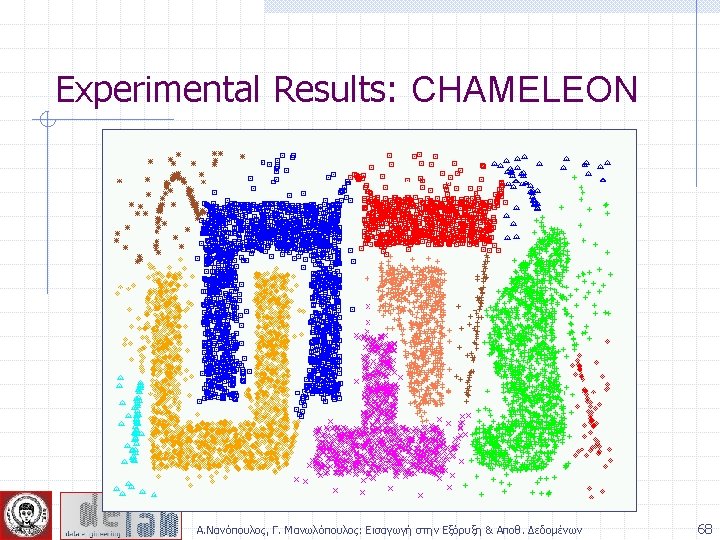
Characteristics of Spatial Data Sets • Clusters are defined as densely populated regions of the space • Clusters have arbitrary shapes, orientation, and non-uniform sizes • Difference in densities across clusters and variation in density within clusters • Existence of special artifacts (streaks) and noise The clustering algorithm must address the above characteristics and also require minimal supervision. Α. Νανόπουλος, Γ. Μανωλόπουλος: Εισαγωγή στην Εξόρυξη & Αποθ. Δεδομένων 64
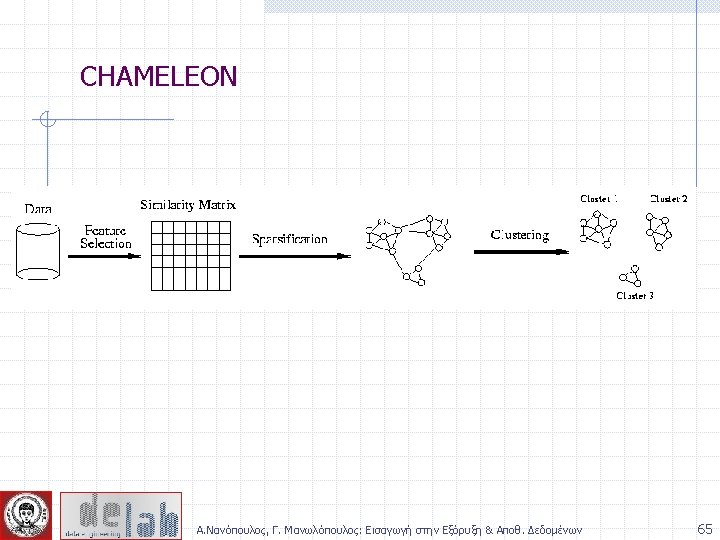
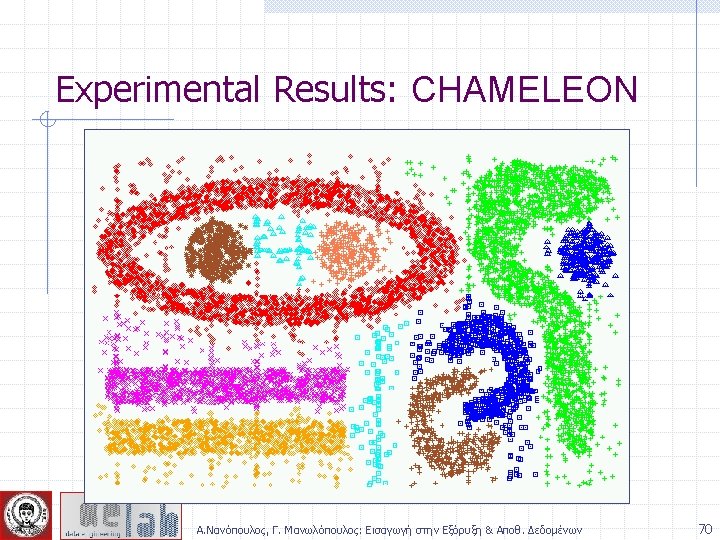
Chameleon: Steps Preprocessing Step: Represent the Data by a Graph n Given a set of points, construct the k-nearest-neighbor (k -NN) graph to capture the relationship between a point and its k nearest neighbors n Concept of neighborhood is captured dynamically (even if region is sparse) Phase 1: Use a multilevel graph partitioning algorithm on the graph to find a large number of clusters of wellconnected vertices n Each cluster should contain mostly points from one “true” cluster, i. e. , is a sub-cluster of a “real” cluster Α. Νανόπουλος, Γ. Μανωλόπουλος: Εισαγωγή στην Εξόρυξη & Αποθ. Δεδομένων 66
Chameleon: Steps … Phase 2: Use Hierarchical Agglomerative Clustering to merge subclusters n Two clusters are combined if the resulting cluster shares certain properties with the constituent clusters n Two key properties used to model cluster similarity: w Relative Interconnectivity: Absolute interconnectivity of two clusters normalized by the internal connectivity of the clusters w Relative Closeness: Absolute closeness of two clusters normalized by the internal closeness of the clusters Α. Νανόπουλος, Γ. Μανωλόπουλος: Εισαγωγή στην Εξόρυξη & Αποθ. Δεδομένων 67
Characteristics of Spatial Data Sets • Clusters are defined as densely populated regions of the space • Clusters have arbitrary shapes, orientation, and non-uniform sizes • Difference in densities across clusters and variation in density within clusters • Existence of special artifacts (streaks) and noise The clustering algorithm must address the above characteristics and also require minimal supervision. Α. Νανόπουλος, Γ. Μανωλόπουλος: Εισαγωγή στην Εξόρυξη & Αποθ. Δεδομένων 80