
Session 4 Finding Answers through Data Collection SHS

- Slides: 18
Session 4: Finding Answers through Data Collection SHS Mass Training of Teachers, Practical Research 2
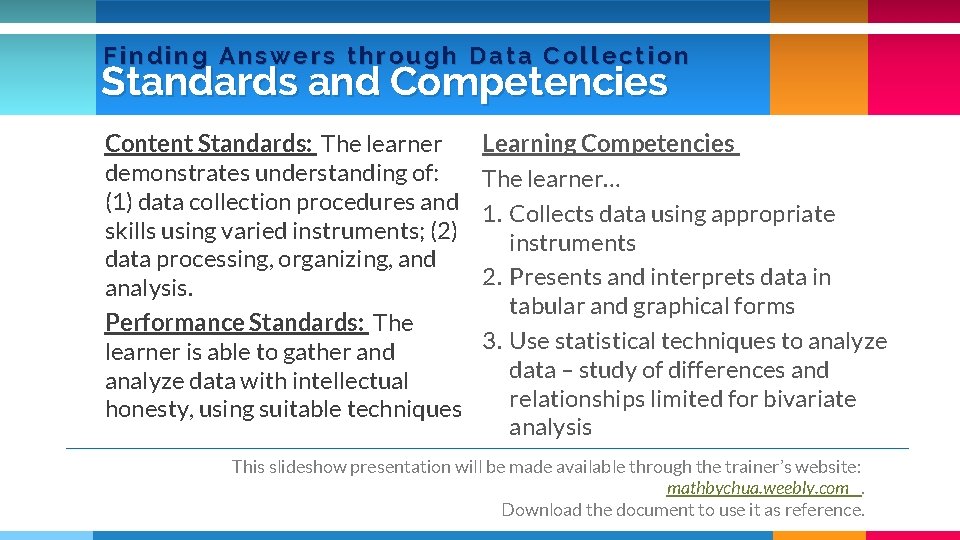
Finding Answers through Data Collection Standards and Competencies Content Standards: The learner demonstrates understanding of: (1) data collection procedures and skills using varied instruments; (2) data processing, organizing, and analysis. Performance Standards: The learner is able to gather and analyze data with intellectual honesty, using suitable techniques Learning Competencies The learner… 1. Collects data using appropriate instruments 2. Presents and interprets data in tabular and graphical forms 3. Use statistical techniques to analyze data – study of differences and relationships limited for bivariate analysis This slideshow presentation will be made available through the trainer’s website: mathbychua. weebly. com. Download the document to use it as reference.
Chapter Content Chapter IV PRESENTATION AND ANALYSIS OF DATA In reporting the results, the researcher stays close to the statistical findings without drawing broader implications or meaning from them. Further, this section includes summaries of the data rather than the raw data (e. g. , the actual scores for individuals). A results section include tables, figures, and detailed explanations about the statistical results
Before writing this section, ü Rewrite Chapters 1 -3 before or after data analysis and before writing Chapter 4. ü Rewrite Chapters in past tense, wherever applicable, and make corrections for actual data collection and data analysis procedures. Rewriting Initial Chapters
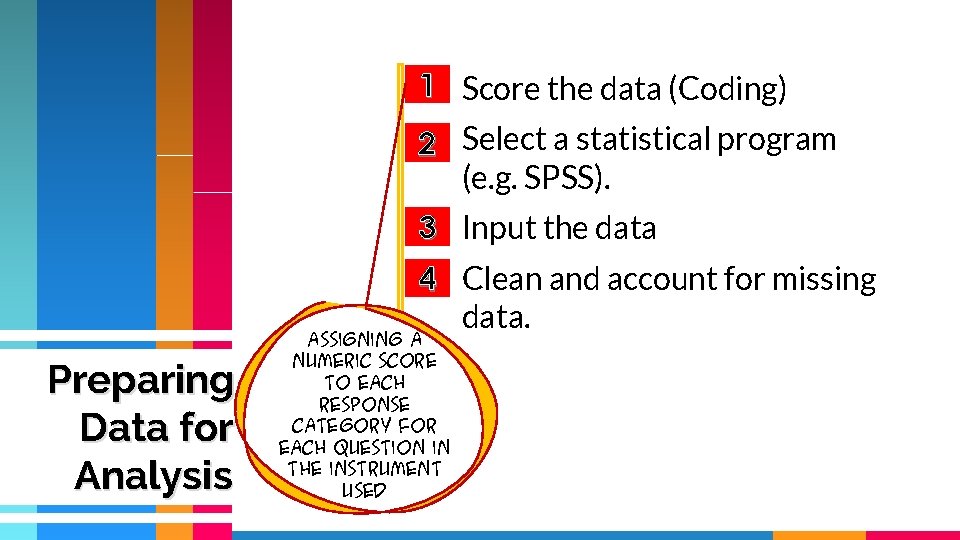
1 Score the data (Coding) 2 Select a statistical program (e. g. SPSS). 3 Input the data 4 Clean and account for missing data. Preparing Data for Analysis Assigning a numeric score to each response category for each question in the instrument used
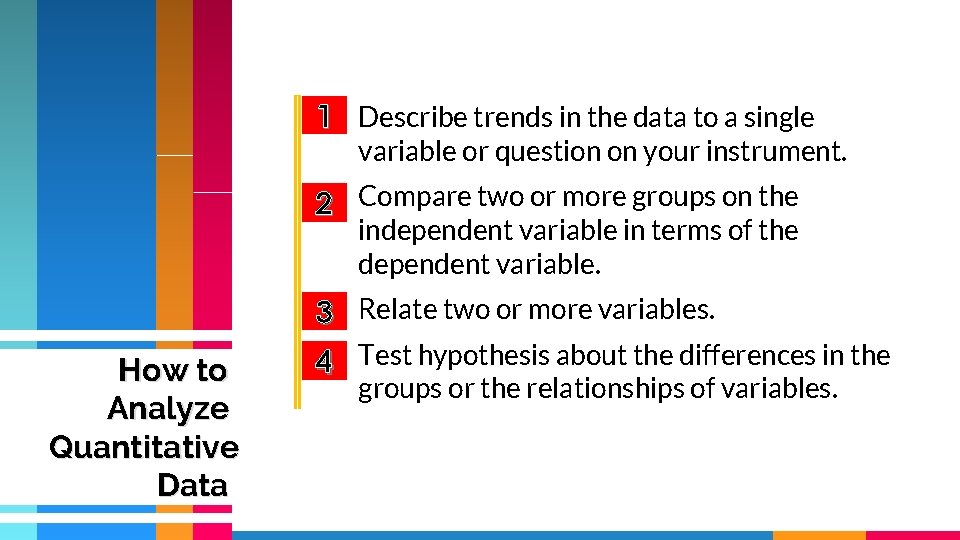
1 Describe trends in the data to a single variable or question on your instrument. 2 Compare two or more groups on the independent variable in terms of the dependent variable. 3 Relate two or more variables. How to Analyze Quantitative Data 4 Test hypothesis about the differences in the groups or the relationships of variables.
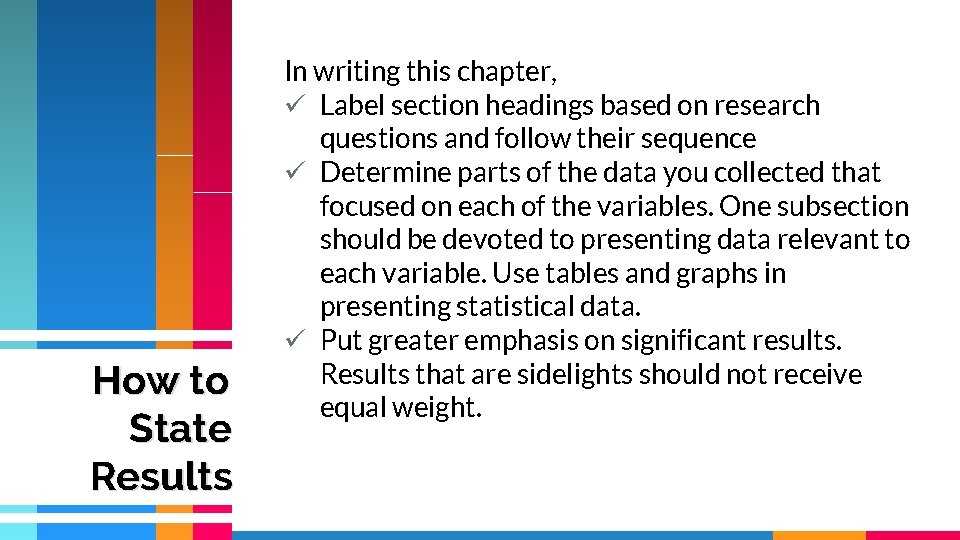
How to State Results In writing this chapter, ü Label section headings based on research questions and follow their sequence ü Determine parts of the data you collected that focused on each of the variables. One subsection should be devoted to presenting data relevant to each variable. Use tables and graphs in presenting statistical data. ü Put greater emphasis on significant results. Results that are sidelights should not receive equal weight.
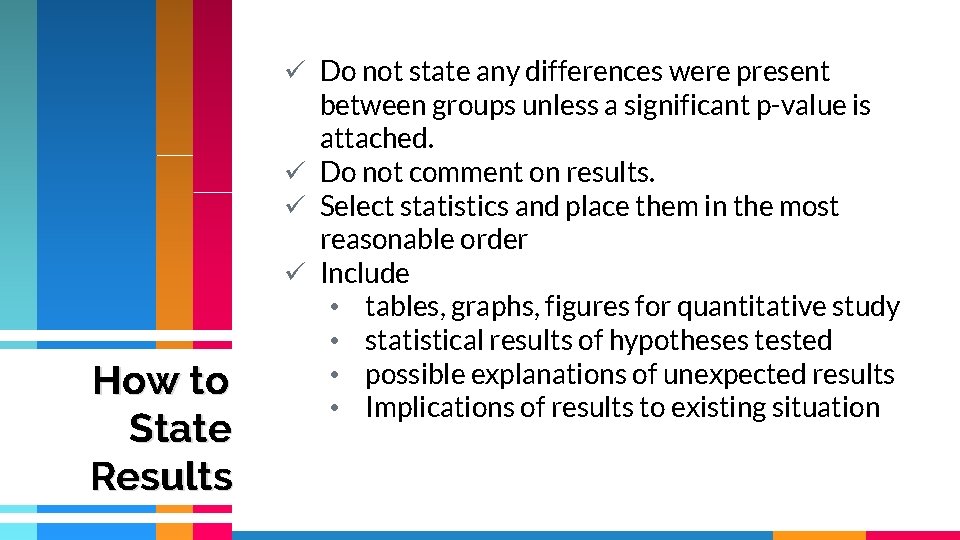
How to State Results ü Do not state any differences were present between groups unless a significant p-value is attached. ü Do not comment on results. ü Select statistics and place them in the most reasonable order ü Include • tables, graphs, figures for quantitative study • statistical results of hypotheses tested • possible explanations of unexpected results • Implications of results to existing situation
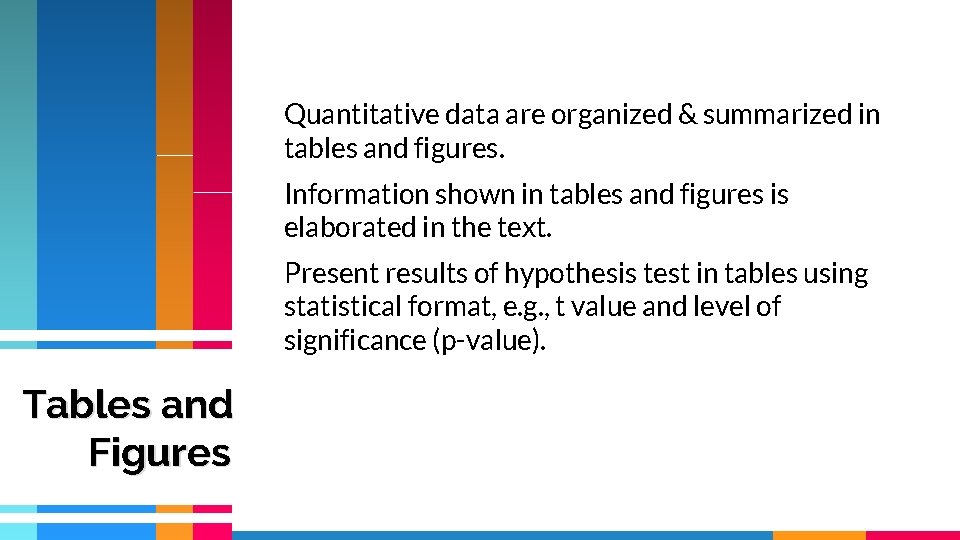
Quantitative data are organized & summarized in tables and figures. Information shown in tables and figures is elaborated in the text. Present results of hypothesis test in tables using statistical format, e. g. , t value and level of significance (p-value). Tables and Figures
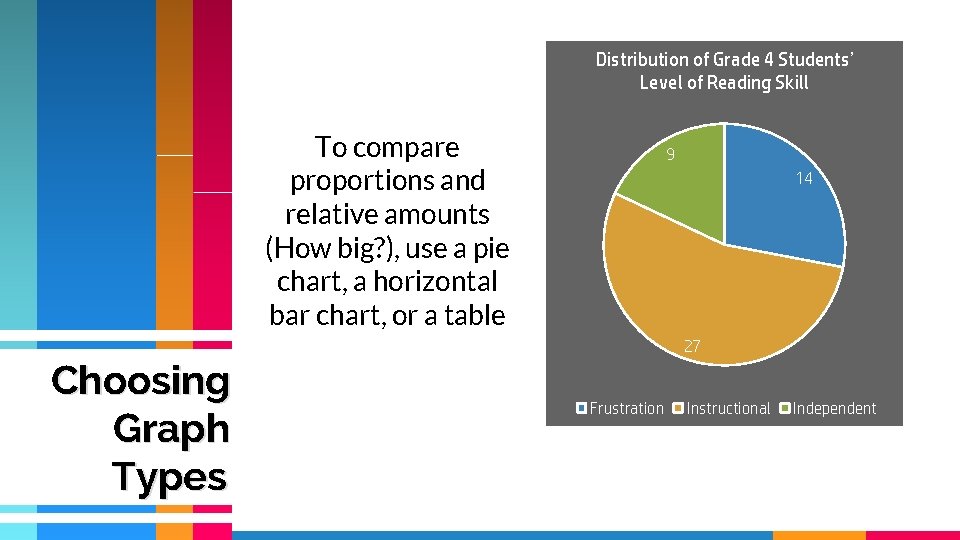
Distribution of Grade 4 Students’ Level of Reading Skill To compare proportions and relative amounts (How big? ), use a pie chart, a horizontal bar chart, or a table 9 14 27 Choosing Graph Types Frustration Instructional Independent
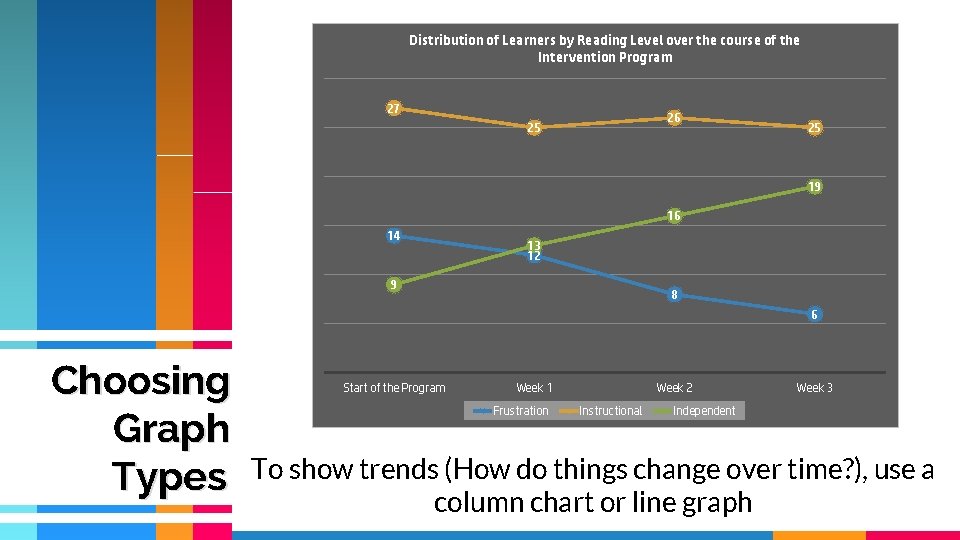
Distribution of Learners by Reading Level over the course of the Intervention Program 27 26 25 25 19 16 14 13 12 9 8 6 Choosing Graph Types Start of the Program Week 1 Frustration Week 2 Instructional Week 3 Independent To show trends (How do things change over time? ), use a column chart or line graph
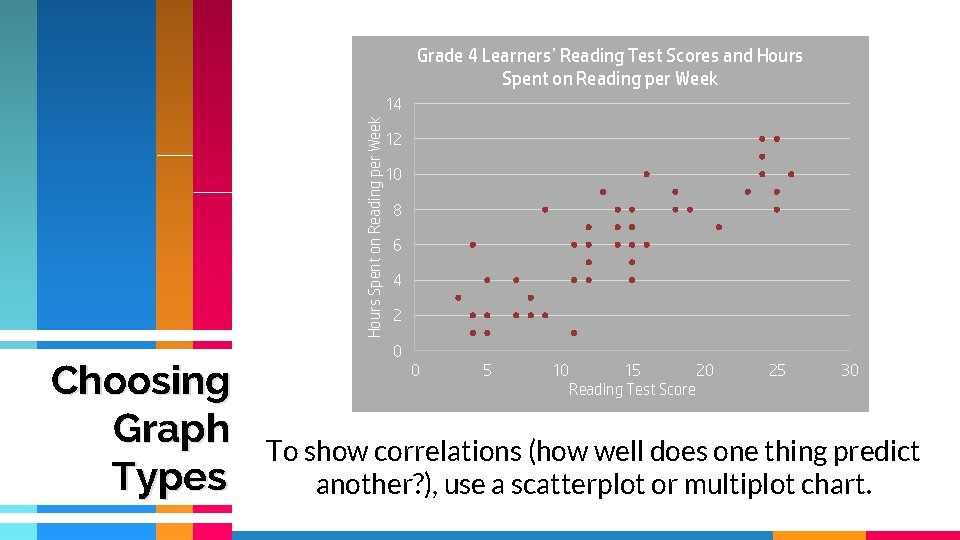
Grade 4 Learners’ Reading Test Scores and Hours Spent on Reading per Week 14 Choosing Graph Types 12 10 8 6 4 2 0 0 5 10 15 20 Reading Test Score 25 30 To show correlations (how well does one thing predict another? ), use a scatterplot or multiplot chart.
Enrich and support quantitative analysis with qualitative data analysis using selected quotes/utterances & observed behavior of subjects. Results of Hypothesis Testing
Compare results of present study with related studies, as follows: This result Results of Related Studies is consistent with or similar to that of… (related study) contradicts/opposes that of… (related study)
Needed especially when results are not those expected by researcher. Cite all things that happened that may have affected findings. Possible Explanations Look at limitations of the study, e. g. , in sampling, instrumentation, intervention, and data collection.
ü Was the conduct of research not implemented as planned? Were there deviations from planned procedure? ü Was dosage or duration of experiment of intervention sufficient? ü Was there a contamination of comparison group? ü Are there characteristics of sample that affected the results? Possible Explanations ü Were there issues with the instruments’ validity and reliability? in test administration? ü Was there any instance of resistance of sample to intervention?
If some or all findings are different from expected, have a section on reconceptualized framework at end of Chapter 4 and make diagram of re-conceptualized framework. Re-conceptualized Framework Starting with text, cite figure (diagram) of reconceptualized framework. Explain changes vis-à-vis Conceptual Framework of the Study.
WORKSHOP, CHAPTER FOUR PRESENTATION AND ANALYSIS OF DATA Come up with a fabricated data for your research based on your Statement of the Problem and write briefly this chapter