SAMPLING ALIASING OVERVIEW Periodic sampling the process of


 • With regard to sampling, the primary concern is how fast")


 sequence")


. Its domain is all t,")
 t")
")
 by the limiting process The width of")


 are sifted out except the value at the")


, we obtain a train")
 converts digital signals to continuous (analog) signals. A general")


,")
- Slides: 40
SAMPLING & ALIASING
OVERVIEW • Periodic sampling, the process of representing a continuous signal with a sequence of discrete data values, pervades the field of digital signal processing. • In practice, sampling is performed by applying a continuous signal to an analog-to -digital (A/D) converter whose output is a series of digital values.
OVERVIEW (cont. ) • With regard to sampling, the primary concern is how fast must the given continuous signal be sampled in order to preserve its information content.
ALIASING • There is a frequency-domain ambiguity associated with the discrete-time signal samples that is absent in the continuous signal world. eg. Suppose you are given the following sequence of values, x(0) = 0 x(1) = 0. 866 x(2) = 0. 866 x(3)= 0 x(4) = -0. 866 x(5) = -0. 866 x(6) = 0
and were told that they represented instantaneous values of a sinewave. Next you were told to draw that sinewave. You would be able to draw a sinewave that passes through the points representing the original sequence.
However, someone else might draw another sine wave with a different frequency through the same points.
As an example, consider two sine waves that differ only in frequency. One has a frequency of 500 Hz, and the frequency of the subsequent sine wave is 8500 Hz.
Consider the continuous time domain sinusoidal signal This a garden variety sinewave with a frequency fo Hz. If we sample at a rate of fs samples per second, where Ts = 1/fs. If we start sampling at t = 0, we will obtain samples at 0 ts, 1 ts, 2 ts, and so on.
The final equation defines the value of the nth sample of our x(n) sequence to be equal to the original sine wave at the time instant n. Ts.
Because two values of a sine wave are identical if they’re separated by an integer multiple of 2 p radians, i. e. , where m is any integer. Now
If we let m be an integer multiple of n, m=kn, we can replace the m/n ratio with k so that The fo and (fo + kfs ) factors are equal. It means that an x(n) sequence of digital sample values, representing a sine wave of fo Hz, also exactly represents sine waves at other frequencies, namely fo + kfs. This is one of the most important relationships in the field of DSP.
When sampling at a rate of fs samples/sec. , if k is any positive or negative integer, we cannot distinguish between the sampled values of a sine wave of fo Hz and a sine wave of (fo + kfs) Hz.
IMPULSE FUNCTION The impulse function is represented by d(t). Its domain is all t, and the range contains only two values, 0 and . The range is zero for all values of time except when t = 0, when the time function has the value of infinity (i. e. blows up).
The graphical representation of the delta function is given below d(t) t
To obtain some insight into the d function, we can consider the function D(t) as shown below D(t) The function has a height of 1/D and a width of D, resulting in an area of 1. -D/2 t
The d function is obtained from D(t) by the limiting process The width of function goes to zero as its amplitude goes to infinity in a manner that causes the area under the curve to remain constant at unity. D(t) t
As D decreases in value, the function becomes narrower and higher. In the limit, as D 0, Dt d(t). The integral of D(t) is unity for any value of D. It follows that the integral of the d function is also unity provided that the origin is included in the limits of integration. Otherwise, it is zero.
If we multiply the d function by a constant, k, and then integrate the product over all time, we get Multiplication of d(t) by a constant is equivalent to choosing D(t) with a height of k/D. This results in an area equal to k.
TIME-SHIFTED FUNCTIONS If the argument of the d function is replaced with t-t, we see that the impulse still occurs when the argument takes on the value of zero (i. e. , when t-t = 0 or t = t).
TIME-SIFTING PROPERTY If we integrate the product of the d function and any time function, we can observe the sifting property of d function. where e is arbitrarily small.
The first and last integrals on the right-hand side of the previous equation are zero, since the limits of integration do not include the origin. If f(t) is reasonably well behaved at the origin (i. e. , no jumps or discontinuities), as e 0, f(t) can be approximate by f(0). Since f(0) is a constant, it can be taken outside the integral.
So all the values of f(t) are sifted out except the value at the origin, f(0).
If we use the time-shifted d function, we obtain
Note that Since expressions equal to the same expression are equal to each other, and
Because witht to obtain , we can interchange t
Evaluate the following integrals. a. b. c. d.
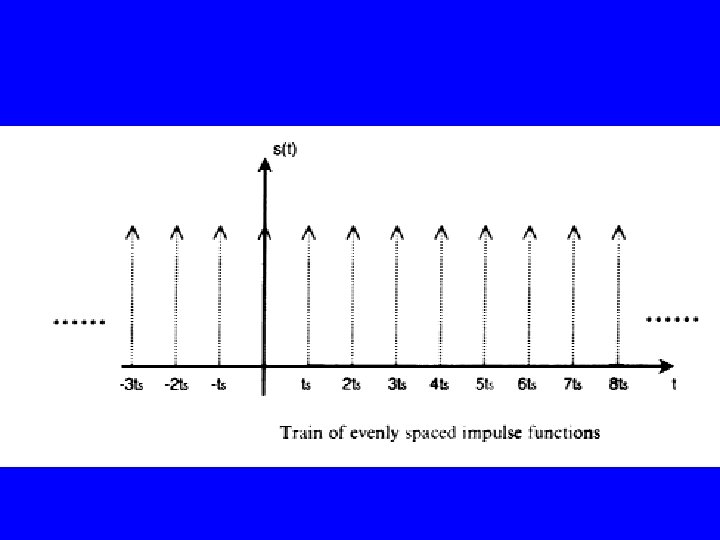
In many DSP textbooks you will find sampling described as a multiplication of the input analog waveform with a periodic delta, Dirac, or impulse function. In an idealized system our sampling waveform would consist of a train of impulse functions spaced evenly by a period Ts. We can describe our idealized sampling function, z(t), as the sum of all the individual impulse functions:
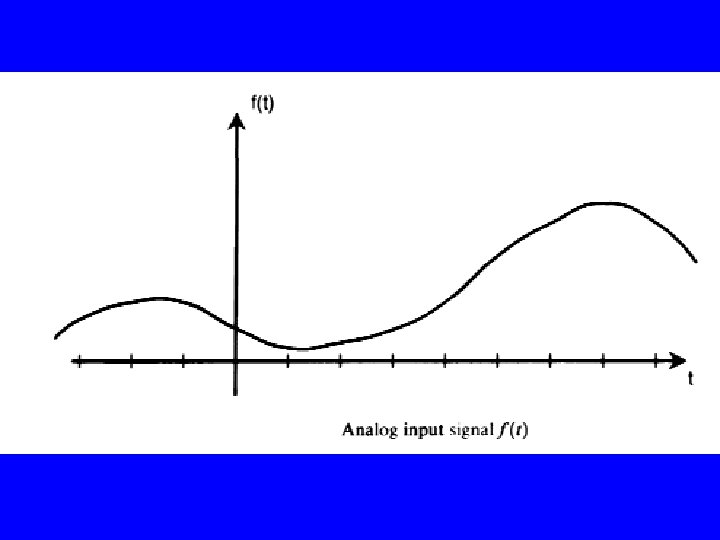
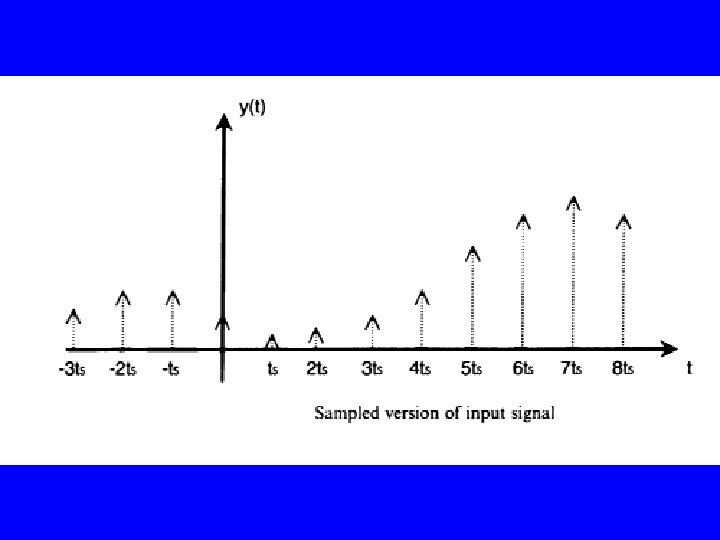
If we multiply these by our analog input signal, f(t), we obtain a train of pulses whose amplitudes are equal to the amplitude of f(t) at that moment in time. Mathematically, the output sampled waveform, y(t), is just the multiplication of z(t) with the input analog signal f(t):
Interpolation A digital-to-analog converter (DAC) converts digital signals to continuous (analog) signals. A general formula that describes a broad class of DACs is where p(t) is the characteristic pulse shape of the converter.
The equation state that the output signal is produced by adding together many pulses, each shifted in time. That is, at each sample time tn = n. Ts, a pulse p(t-n. Ts) is emitted with an amplitude The simplest pulse shape is a symmetric square pulse:
The figure below shows a pulse is Ts = 5 ms and a amplitude of 1.
The reconstructed waveform for the square pulse is a poor approximation of the original sine wave.
Although this a poor approximation, this is a useful model since many physically realizable DACs produce outputs that look exactly like this. Since a constant is a polynomial of zero order, and since the effect of the flat pulse is to hold or replicate each sample for Ts seconds, the use of a flat pulse is called a zero-order hold reconstruction.
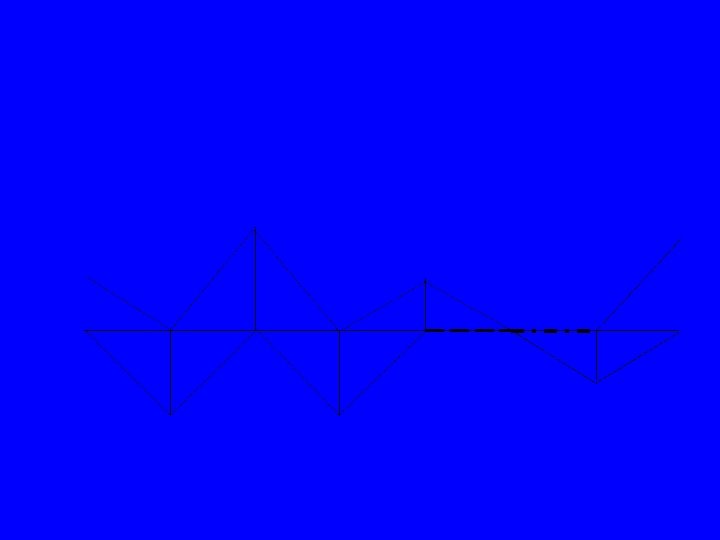
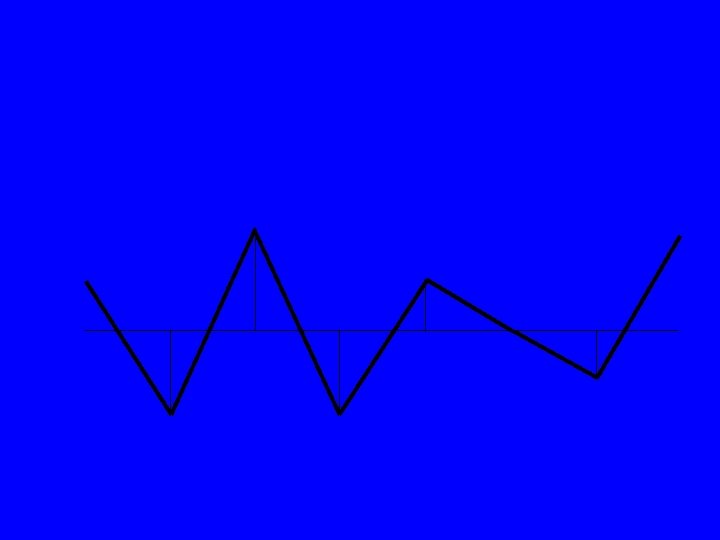
The triangular pulse is defined as a pulse consisting of the first-order polynomial (straightline segments:
Oversampling If the original waveform does not vary much over the duration of p(t), then we will also obtain a good construction. Oversampling, i. e. , using a sampling rate that is much greater than the Nyquist rate, can ensure this.