NESC Academy Pyrotechnic Shock Response Part 2 Aliasing


- Slides: 26
NESC Academy Pyrotechnic Shock Response Part 2 • • Aliasing Spurious Trend Removal
Introduction NESC Academy Analog anti-aliasing filters must be used for shock measurement, otherwise. . . • Aliasing can cause up to 20 d. B error in SRS plots • But a massive amount of ultra-high-frequency energy is required for this to happen • Example: near-field measurement of linear shaped charge • Has happened in laboratory component shock tests where detonation cord is used!
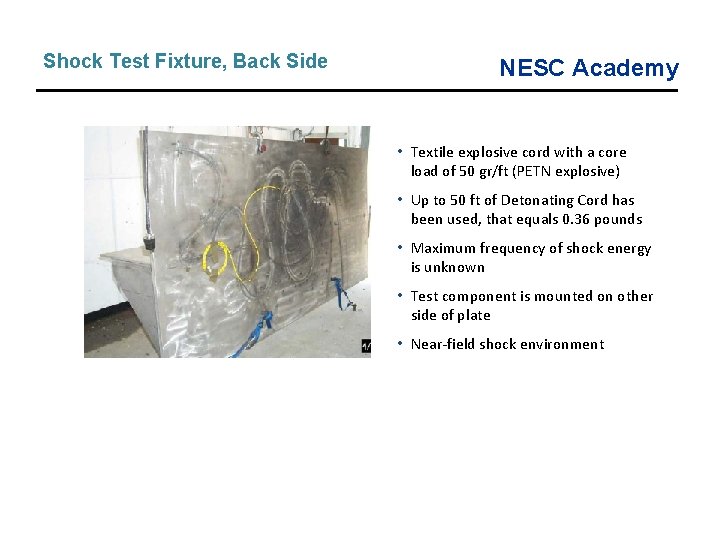
Shock Test Fixture, Back Side NESC Academy • Textile explosive cord with a core load of 50 gr/ft (PETN explosive) • Up to 50 ft of Detonating Cord has been used, that equals 0. 36 pounds • Maximum frequency of shock energy is unknown • Test component is mounted on other side of plate • Near-field shock environment
Case History NESC Academy Subtle Riddle. . . • A test lab was perform a shock test with a certain sample rate • The customer asked the test conductor to increase the sample rate • The test conductor said “Oh no, then we would have to increase the length of the detonation cord” Explanation. . . • Increasing the sample rate gives more accurate results • The test lab did NOT used anti-aliasing filters • High-frequency energy was reflected down to lower frequencies • The SRS result appeared to be within specified tolerances • In reality component was being under-tested • This error affected many components which had been tested over the years
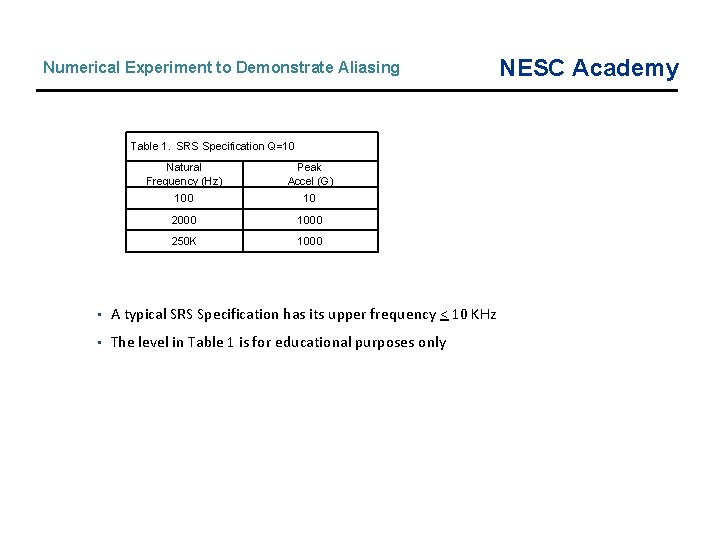
Numerical Experiment to Demonstrate Aliasing Table 1. SRS Specification Q=10 Natural Frequency (Hz) Peak Accel (G) 100 10 2000 1000 250 K 1000 • A typical SRS Specification has its upper frequency < 10 KHz • The level in Table 1 is for educational purposes only NESC Academy
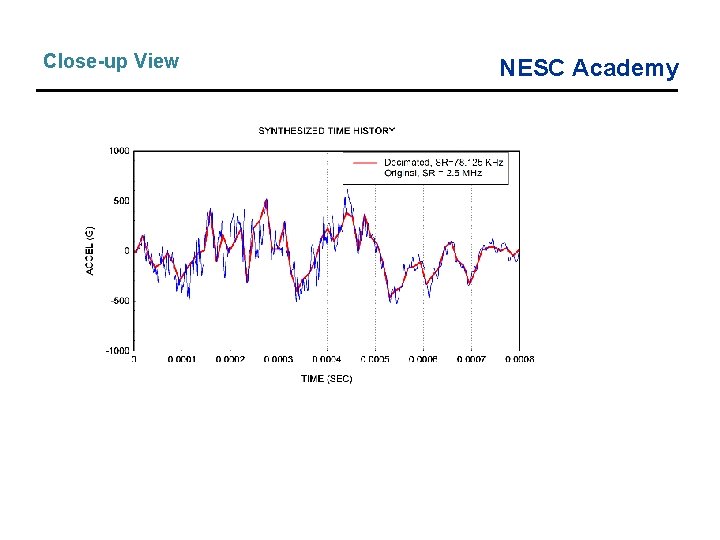
NESC Academy The top time history is synthesized to satisfy the spec in Table 1 • • The bottom time history was decimated by a factor of 32 with no lowpass filtering • Simulates potential aliasing
Close-up View NESC Academy
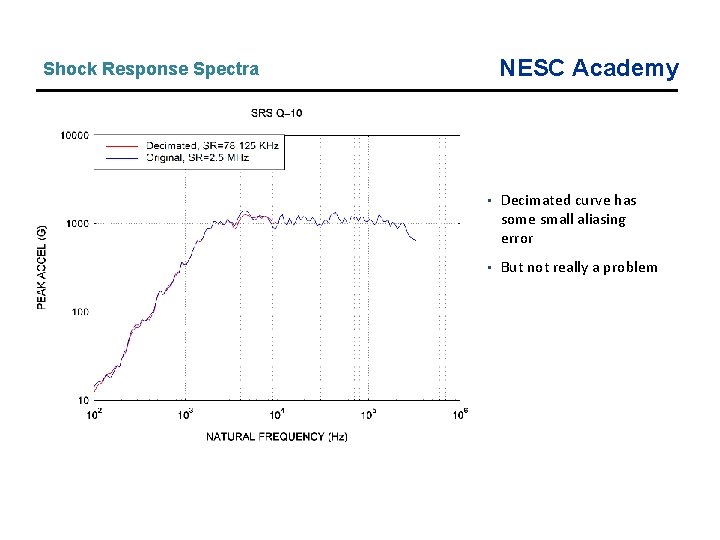
NESC Academy Shock Response Spectra • Decimated curve has some small aliasing error • But not really a problem
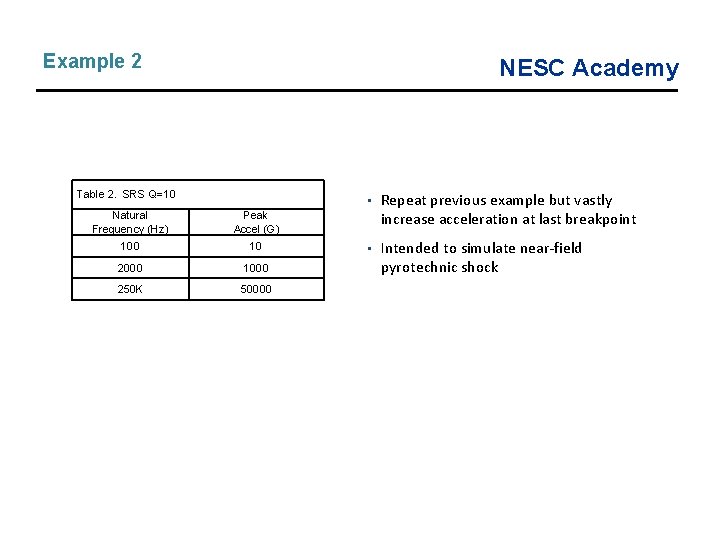
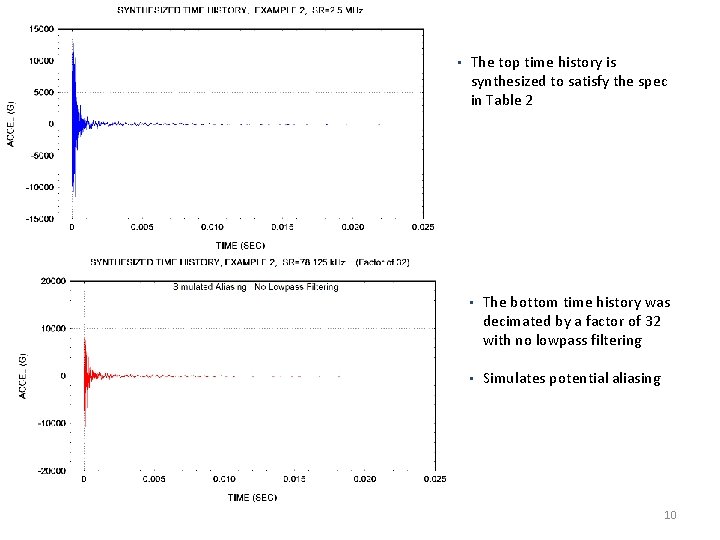
Example 2 NESC Academy Table 2. SRS Q=10 Natural Frequency (Hz) Peak Accel (G) 100 10 2000 1000 250 K 50000 • Repeat previous example but vastly increase acceleration at last breakpoint • Intended to simulate near-field pyrotechnic shock
• The top time history is synthesized to satisfy the spec in Table 2 • The bottom time history was decimated by a factor of 32 with no lowpass filtering • Simulates potential aliasing 10
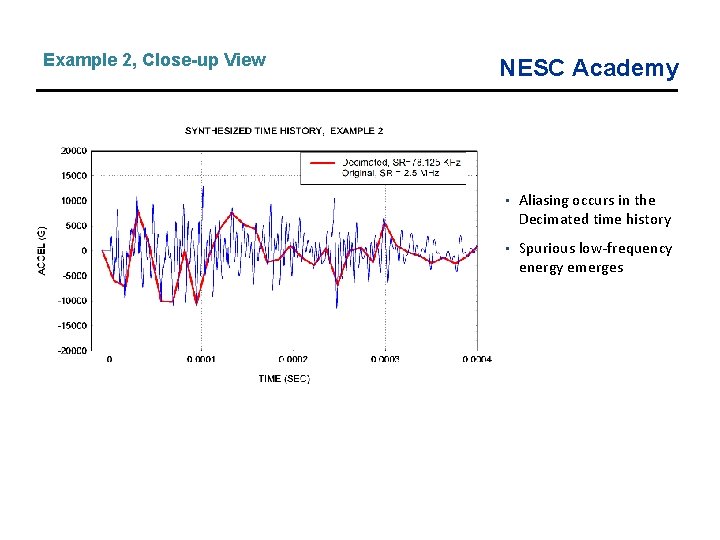
Example 2, Close-up View NESC Academy • Aliasing occurs in the Decimated time history • Spurious low-frequency energy emerges
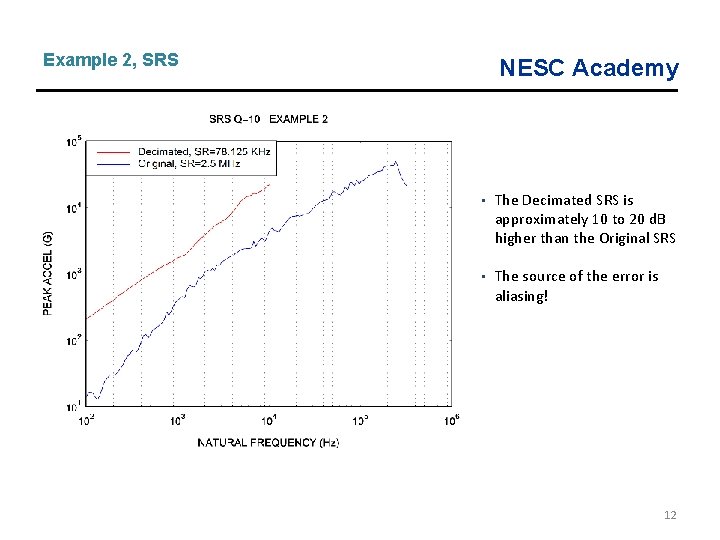
Example 2, SRS NESC Academy • The Decimated SRS is approximately 10 to 20 d. B higher than the Original SRS • The source of the error is aliasing! 12
Spurious Trends in Pyrotechnic Shock Data NESC Academy • Numerous problems can affect the quality of accelerometer data during pyrotechnic shock events (aside from aliasing) • A baseline shift, or zero shift, in the acceleration time history is perhaps the most common error source • Anthony Chu noted that this shift can be of either polarity and of unpredictable amplitude and duration • He has identified six causes of zero shift: a. b. c. d. e. f. Overstressing of sensing elements Physical movement of sensor parts Cable noise Base strain induced errors Inadequate low-frequency response Overloading of signal conditioner.
Spurious Trends, continued NESC Academy • Accelerometer resonant ringing is a special example • This is a particular problem if the accelerometer has a piezoelectric crystal as its sensing element • A piezoelectric accelerometer may have an amplification factor Q > 30 at resonance • This resonance may be excited by high-frequency pyrotechnic shock energy • Resonant ringing causes higher element stresses than expected
Spurious Trends (Continued) NESC Academy Chu notes that this may cause the signal conditioner to overload, as follows: • When a signal conditioner attempts to process this signal, one of its stages is driven into saturation • Not only does this clipping distort the in-band signals momentarily, but the overload can partially discharge capacitors in the amplifier, causing a long time-constant transient • This overload causes zero shift in the acceleration time history • This shift distorts the low-frequency portion of the shock response spectrum
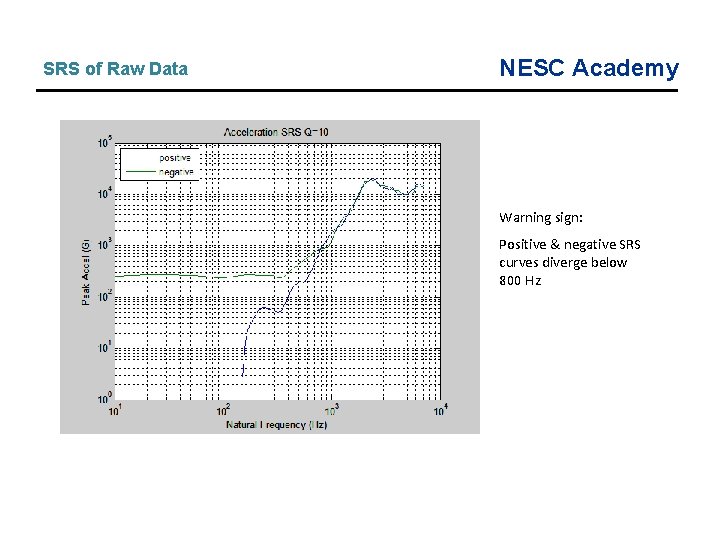
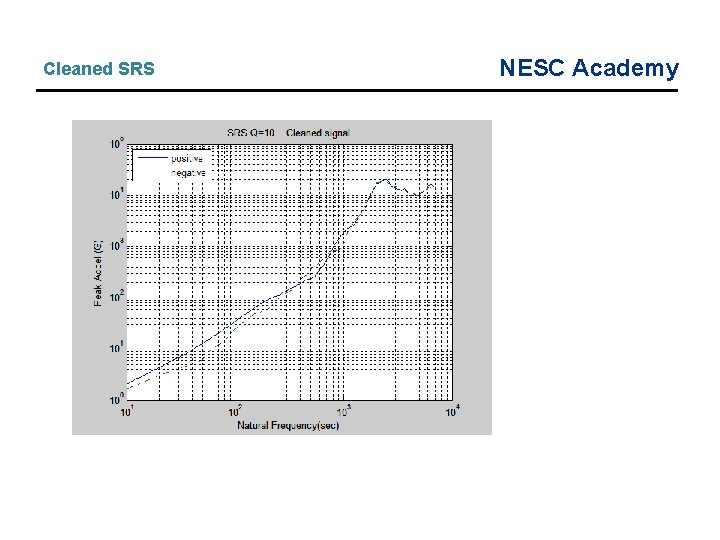
Evaluate Quality of Shock Data NESC Academy • Acceleration time history should oscillate somewhat symmetrically about the zero baseline • Integrated velocity should also oscillate about the zero baseline • Positive & negative SRS curves should be similar • SRS positive & negative curves should each have initial slopes from 6 to 12 d. B/octave • Otherwise editing is needed
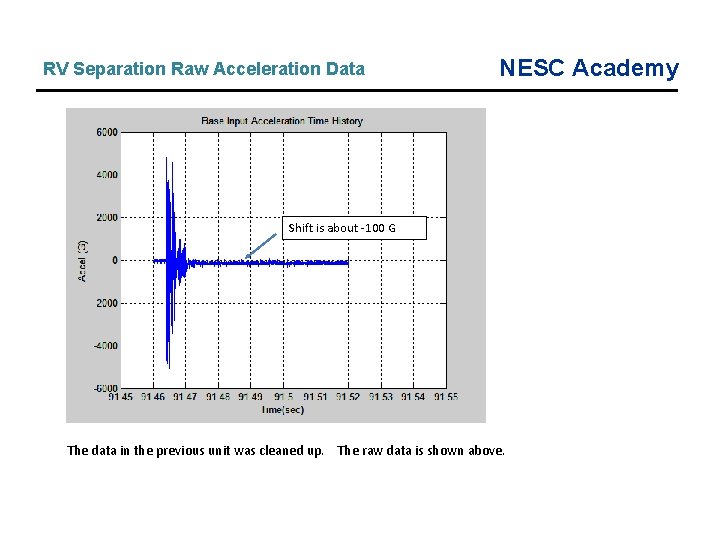
RV Separation Raw Acceleration Data NESC Academy Shift is about -100 G The data in the previous unit was cleaned up. The raw data is shown above.
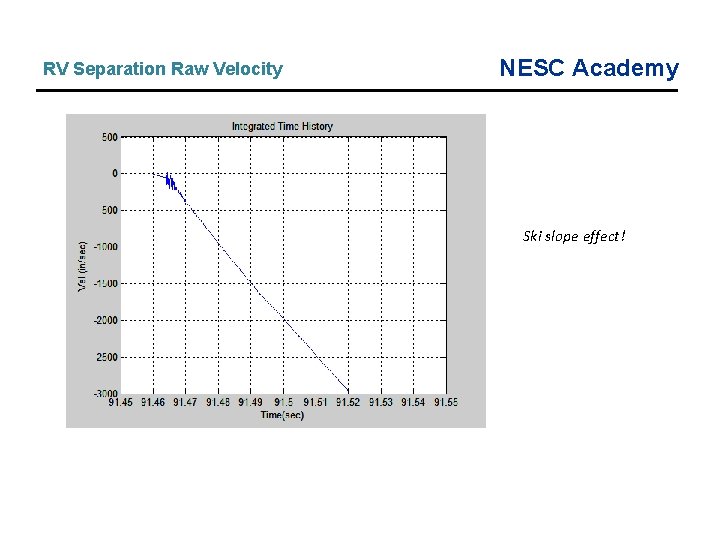
RV Separation Raw Velocity NESC Academy Ski slope effect!
SRS of Raw Data NESC Academy Warning sign: Positive & negative SRS curves diverge below 800 Hz
Data Surgery NESC Academy
Spurious Trend Removal • NESC Academy There is no one right way! • Data is too precious to discard, especially flight data • Goal is to obtain plausible estimate of the acceleration time history & SRS • So document whatever method that you use • Show before and after plots • Possible “cleaning” methods include polynomial trend removal and high pass filtering • In some cases spurious EMP spikes must be manually edited • Possible EMI from pyrotechnic charge initiation current into accelerometer signals • So “turn-the-crank” methods may not be effective
Mean Filter NESC Academy • A mean filtering method is demonstrated in this unit • The mean filter is a simple sliding-window filter that replaces the center value in the window with the average (mean) of all the values in the window • The mean filter is intended as a lowpass filter which smoothes the data • It may also be used as an indirect highpass filter by subtracting the mean filtered signal from the raw data • The indirect mean highpass filtering method is useful for cleaning pyrotechnic shock data • As an aside, mean filtering is commonly used to smooth optical images
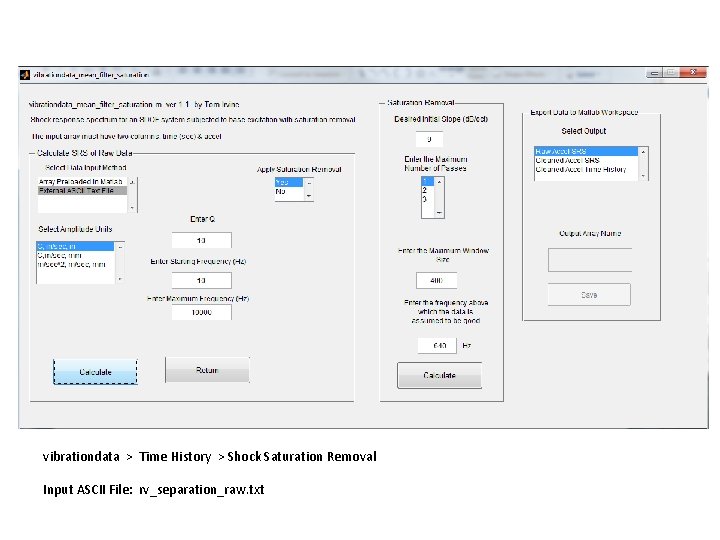
NESC Academy vibrationdata > Time History > Shock Saturation Removal Input ASCII File: rv_separation_raw. txt
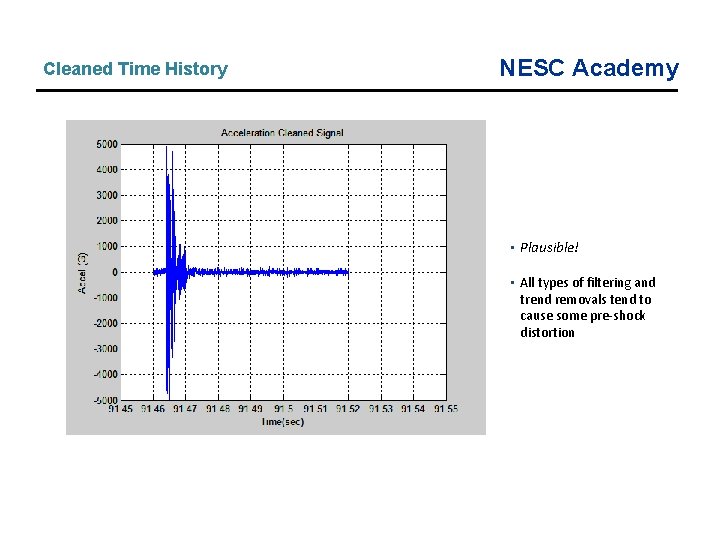
Cleaned Time History NESC Academy • Plausible! • All types of filtering and trend removals tend to cause some pre-shock distortion
Cleaned SRS NESC Academy
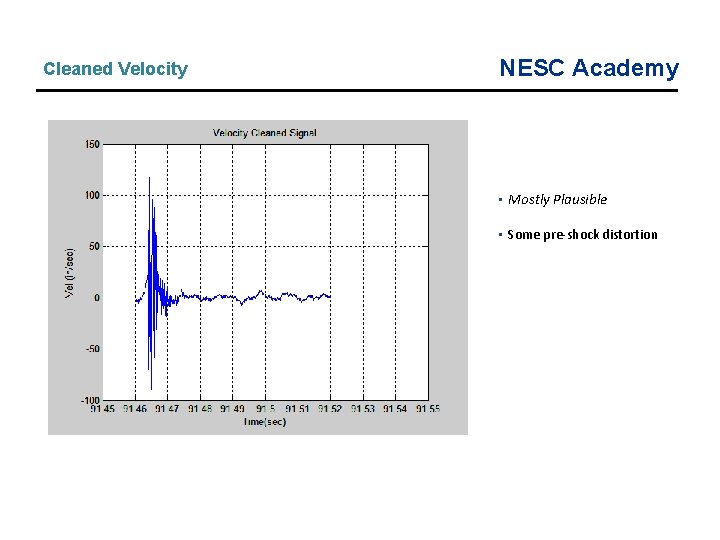
Cleaned Velocity NESC Academy • Mostly Plausible • Some pre-shock distortion