
Introduction For periodic waveforms the duration of the
- Slides: 19
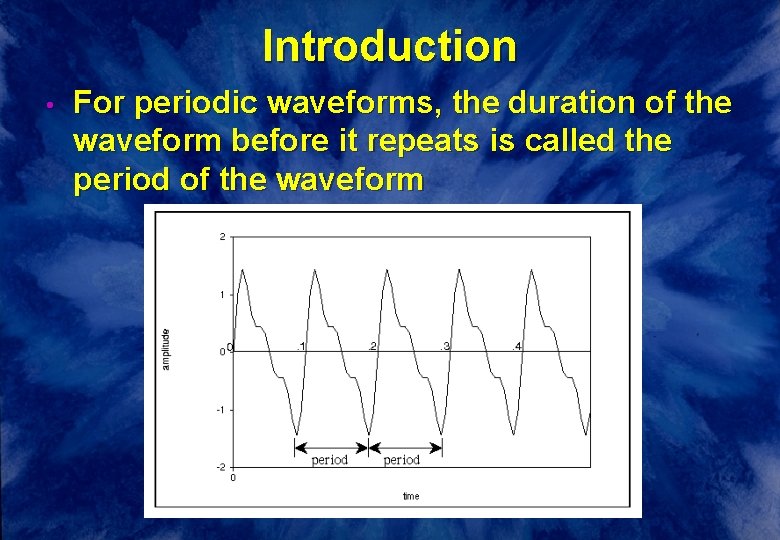
Introduction • For periodic waveforms, the duration of the waveform before it repeats is called the period of the waveform
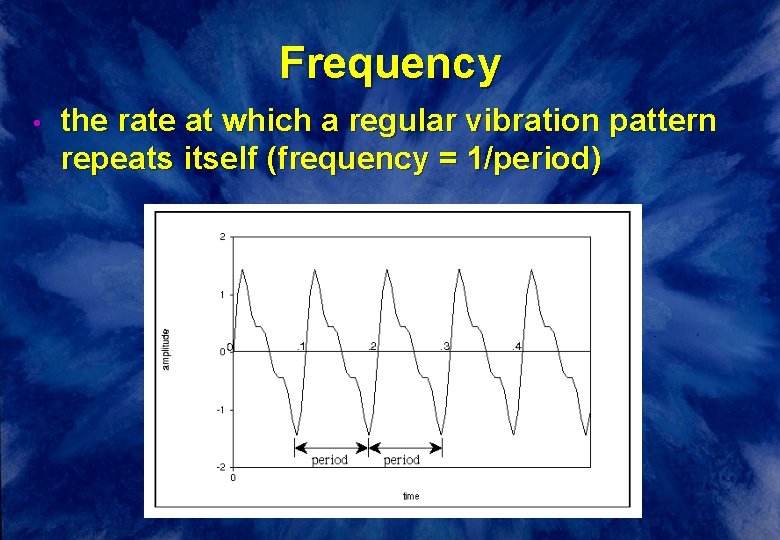
Frequency • the rate at which a regular vibration pattern repeats itself (frequency = 1/period)
Frequency of a Waveform • • The unit for frequency is cycles/second, also called Hertz (Hz). The frequency of a waveform is equal to the reciprocal of the period. frequency = 1/period
Frequency of a Waveform • Examples: frequency = 10 Hz period =. 1 (1/10) seconds frequency = 100 Hz period =. 01 (1/100) seconds frequency = 261. 6 Hz (middle C) period =. 0038226 (1/ 261. 6) seconds
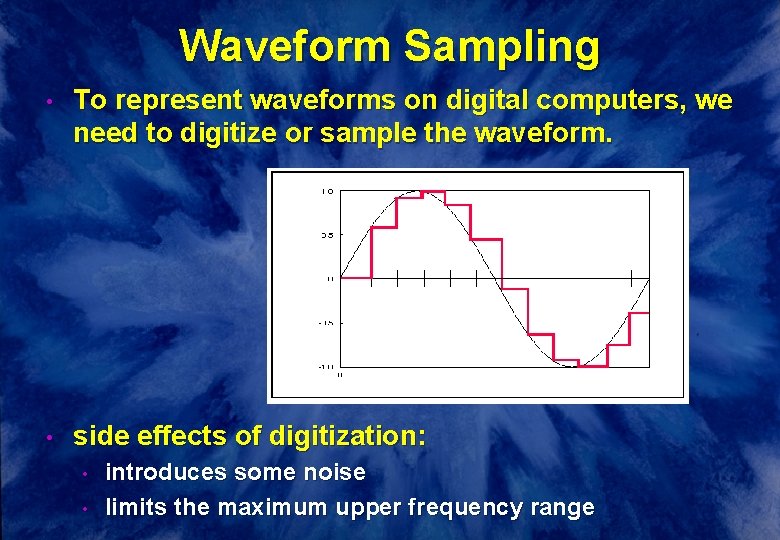
Waveform Sampling • To represent waveforms on digital computers, we need to digitize or sample the waveform. • side effects of digitization: • • introduces some noise limits the maximum upper frequency range
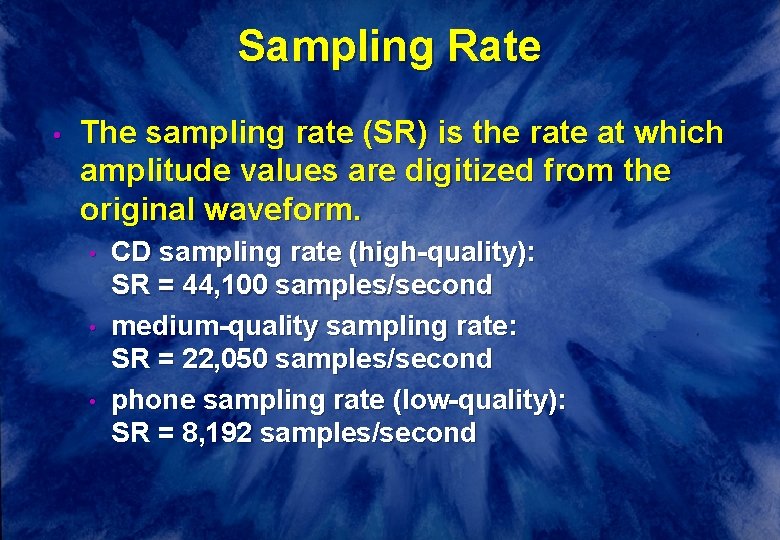
Sampling Rate • The sampling rate (SR) is the rate at which amplitude values are digitized from the original waveform. • • • CD sampling rate (high-quality): SR = 44, 100 samples/second medium-quality sampling rate: SR = 22, 050 samples/second phone sampling rate (low-quality): SR = 8, 192 samples/second
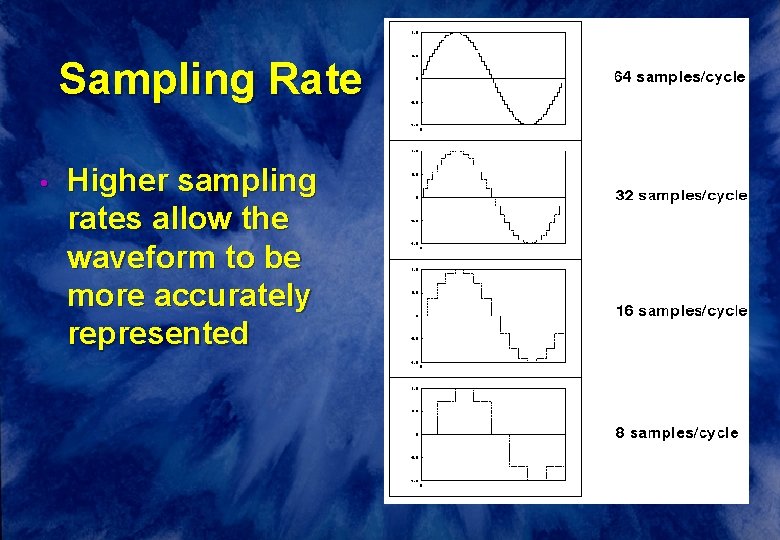
Sampling Rate • Higher sampling rates allow the waveform to be more accurately represented
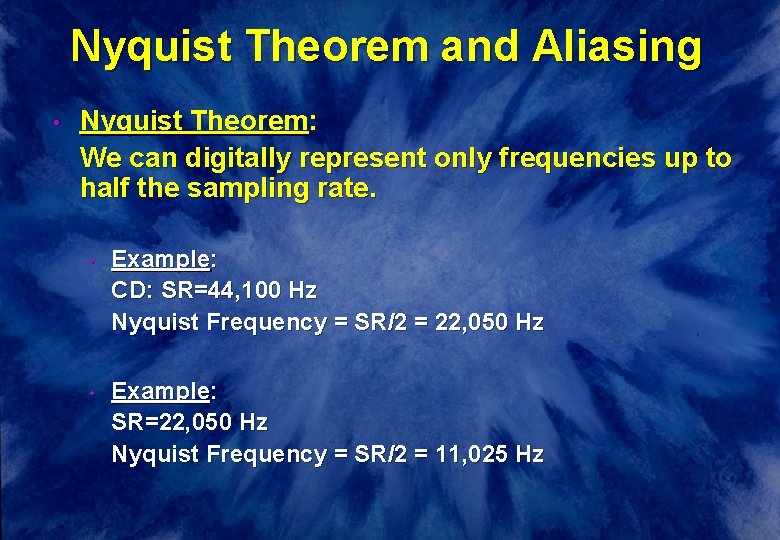
Nyquist Theorem and Aliasing • Nyquist Theorem: We can digitally represent only frequencies up to half the sampling rate. • Example: CD: SR=44, 100 Hz Nyquist Frequency = SR/2 = 22, 050 Hz • Example: SR=22, 050 Hz Nyquist Frequency = SR/2 = 11, 025 Hz
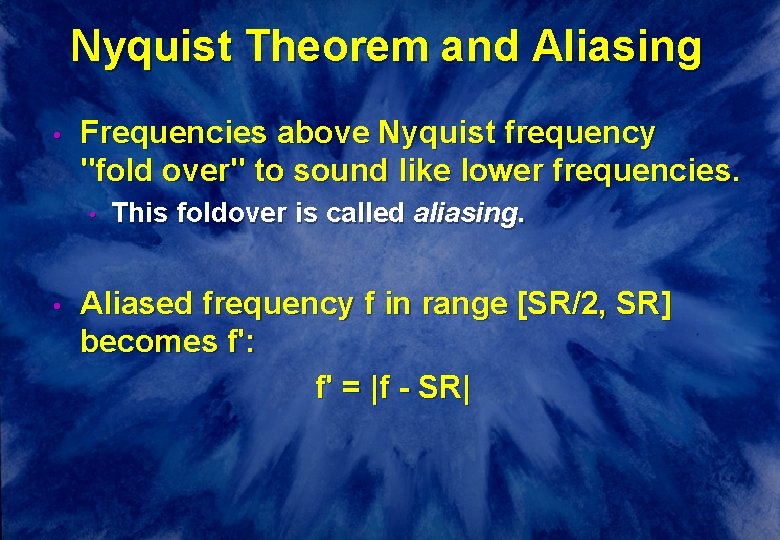
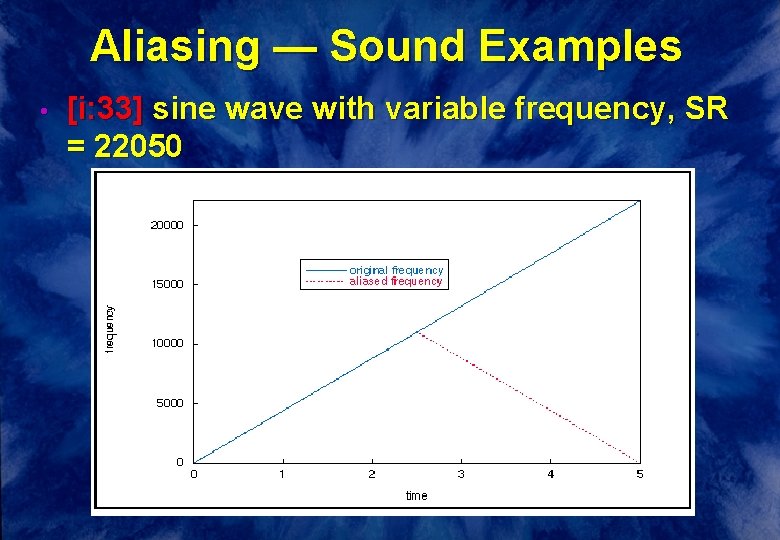
Nyquist Theorem and Aliasing • Frequencies above Nyquist frequency "fold over" to sound like lower frequencies. • • This foldover is called aliasing. Aliased frequency f in range [SR/2, SR] becomes f': f' = |f - SR|
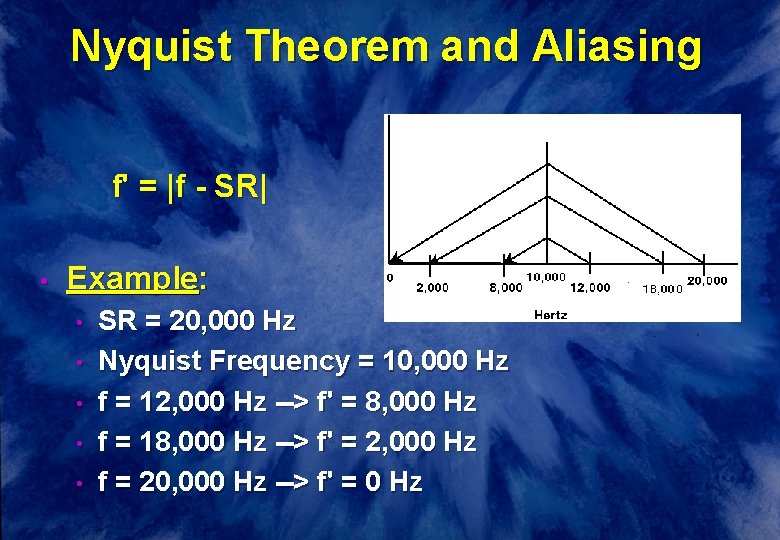
Nyquist Theorem and Aliasing f' = |f - SR| • Example: • • • SR = 20, 000 Hz Nyquist Frequency = 10, 000 Hz f = 12, 000 Hz --> f' = 8, 000 Hz f = 18, 000 Hz --> f' = 2, 000 Hz f = 20, 000 Hz --> f' = 0 Hz
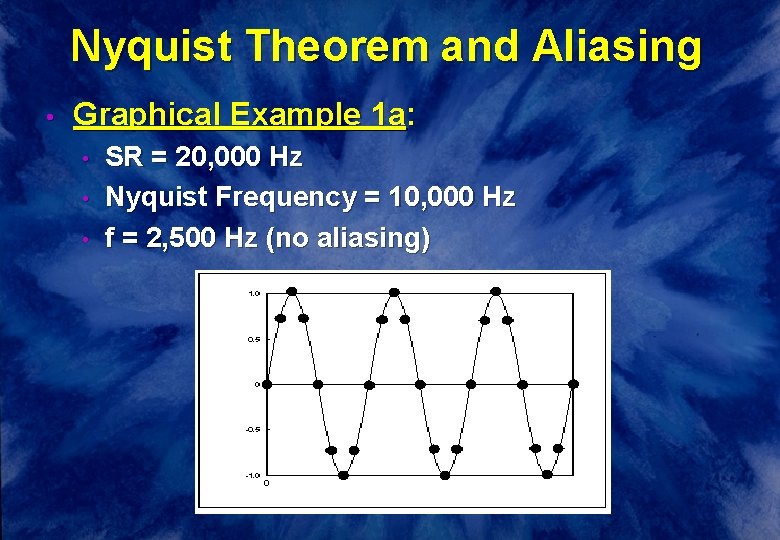
Nyquist Theorem and Aliasing • Graphical Example 1 a: • • • SR = 20, 000 Hz Nyquist Frequency = 10, 000 Hz f = 2, 500 Hz (no aliasing)
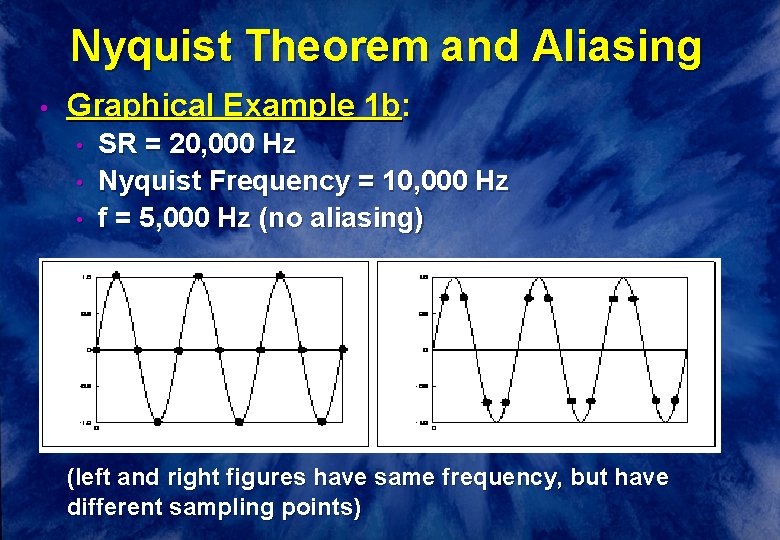
Nyquist Theorem and Aliasing • Graphical Example 1 b: • • • SR = 20, 000 Hz Nyquist Frequency = 10, 000 Hz f = 5, 000 Hz (no aliasing) (left and right figures have same frequency, but have different sampling points)
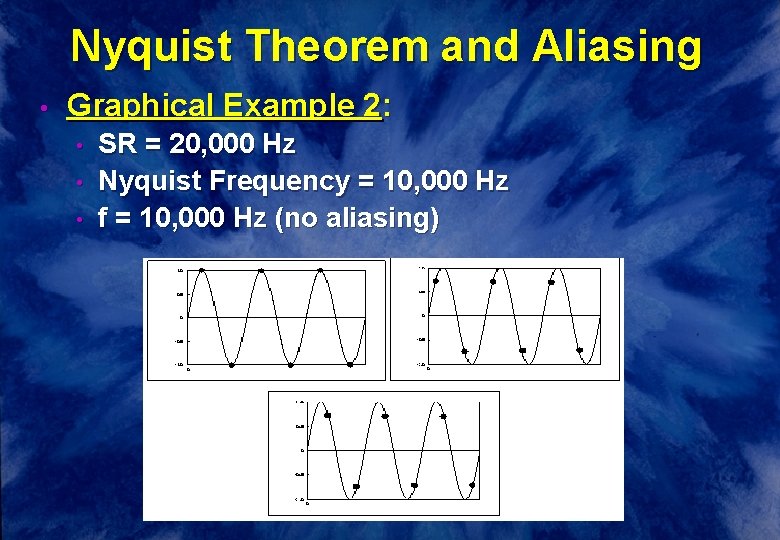
Nyquist Theorem and Aliasing • Graphical Example 2: • • • SR = 20, 000 Hz Nyquist Frequency = 10, 000 Hz f = 10, 000 Hz (no aliasing)
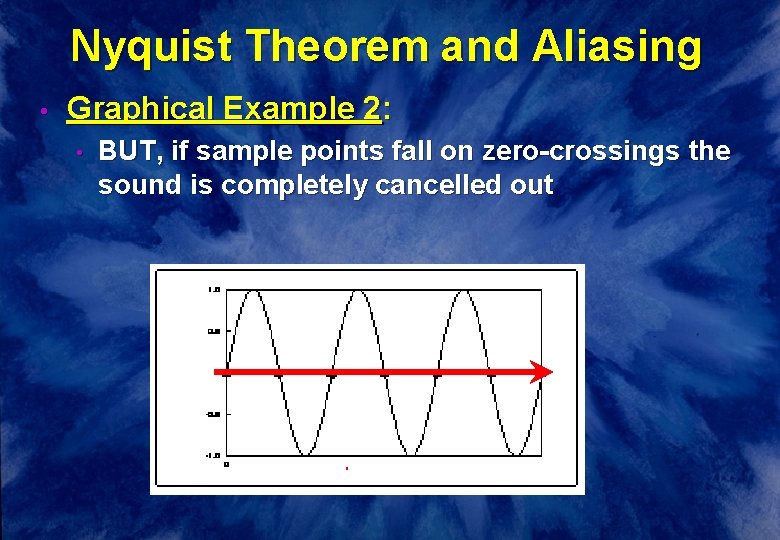
Nyquist Theorem and Aliasing • Graphical Example 2: • BUT, if sample points fall on zero-crossings the sound is completely cancelled out
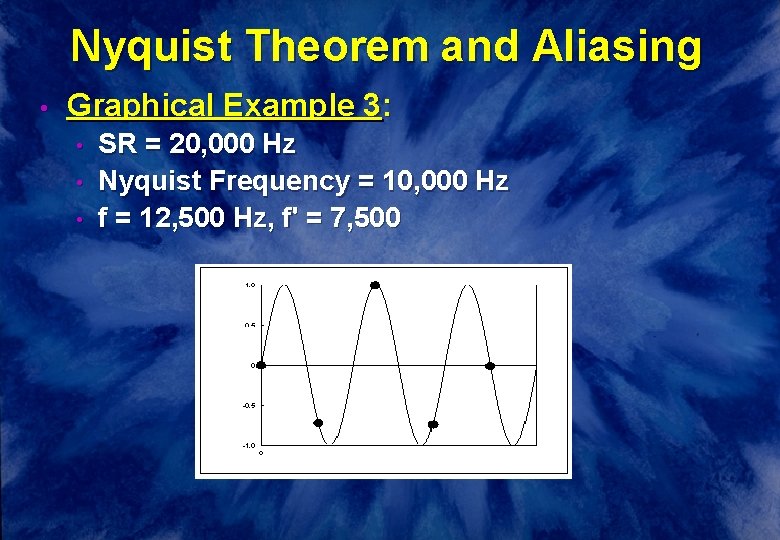
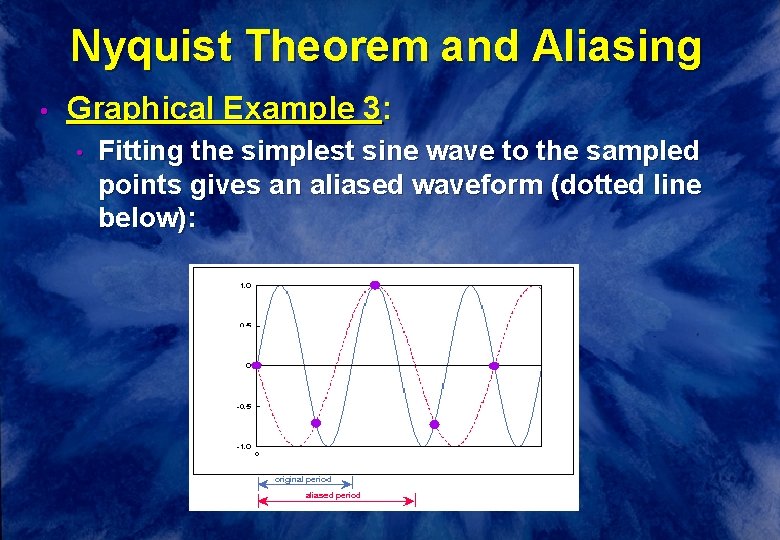
Nyquist Theorem and Aliasing • Graphical Example 3: • • • SR = 20, 000 Hz Nyquist Frequency = 10, 000 Hz f = 12, 500 Hz, f' = 7, 500
Nyquist Theorem and Aliasing • Graphical Example 3: • Fitting the simplest sine wave to the sampled points gives an aliased waveform (dotted line below):
Aliasing — Sound Examples • [i: 33] sine wave with variable frequency, SR = 22050
Aliasing — Sound Examples • Musical examples on the Bach trumpet: • • • [i: 34] SR=22050, highest frequency in music is about 7000 Hz. (no aliasing) [i: 35] SR=11025 (some aliasing; adds a little metallic quality) [i: 36] SR=4410 (lots of aliasing; sounds like bad video game)