research is designed to determine the degree of

- Slides: 38
research is designed to determine the degree of relationship between 2 or more variables. � Correlational � Also referred as “Descriptive Research” or “Associational Research”. Often naturally occurring variables are: Intelligence and GPA Aggression and watching TV Shows Alcohol consumption and driving ability
Relationships among two or more variables are studied without any attempt to influence them. There is no manipulation of variables in Correlational Research. With correlational research, we can only show the magnitude or degree of relationship or association between variables, NOT the CAUSE OF RELATIONSHIP.
CONT: Correlational studies can suggest that there is a relationship between two variables, they cannot prove that one variable causes a change in another variable. In other words, correlation does not equal causation. For example, a correlational study might suggest that there is a relationship between academic success and self-esteem, but it cannot show if academic success increases or decreases selfesteem. Other variables might play a role, including social relationships, cognitive abilities, personality, socio-economic status, and a myriad of other factors.
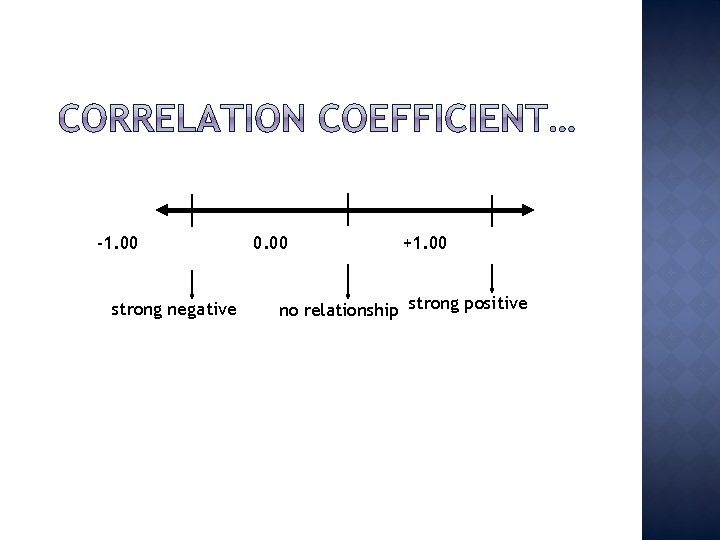
CORRELATION COEFFICIENT Correlational studies describe the variable relationship via a correlation coefficient. A correlation coefficient identifies Existence Degree [ -1. 00 to +1. 00] Direction Sign (+ or -) gives direction of relation The correlation coefficient, denoted by r.
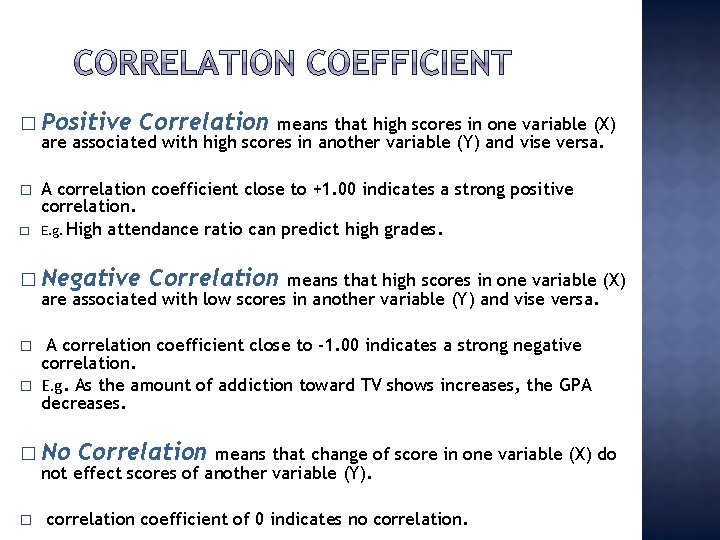
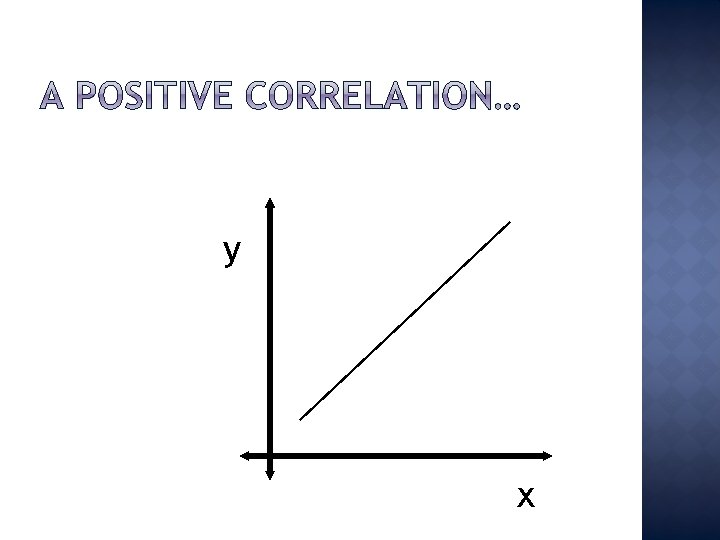
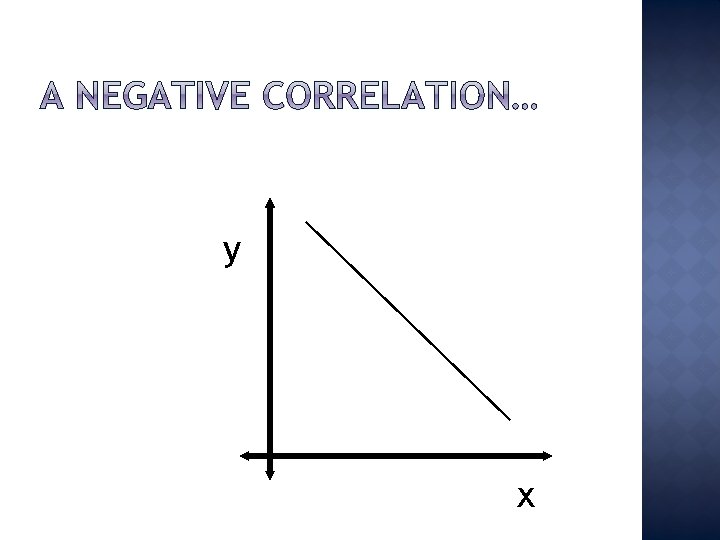
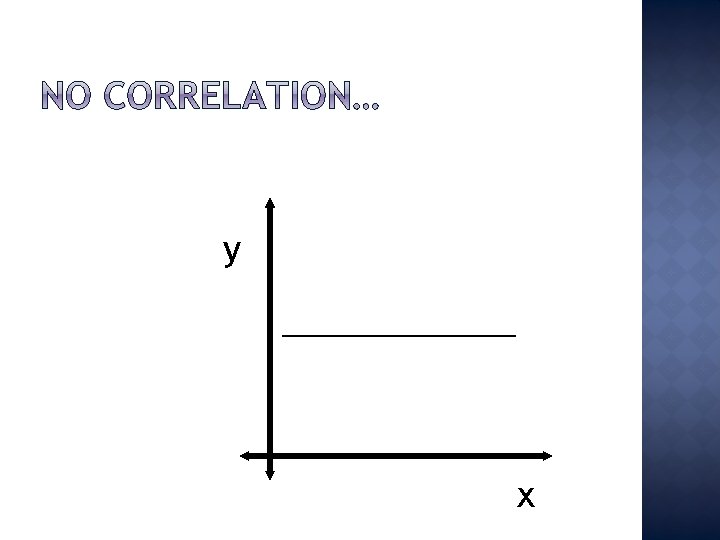
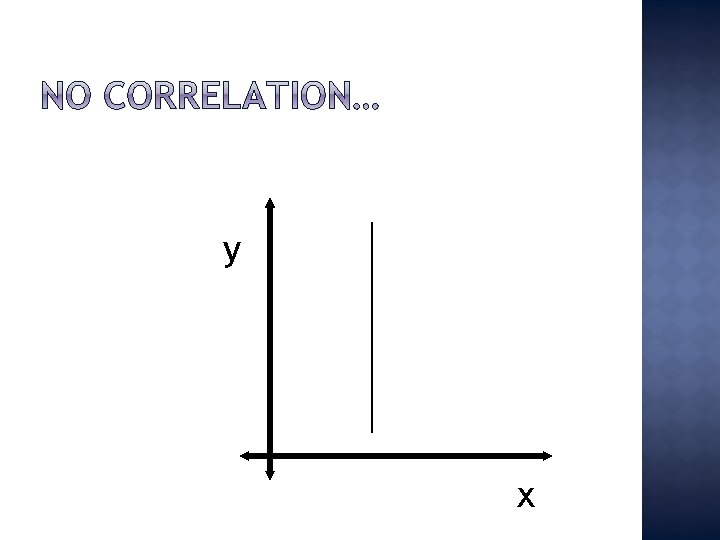
� Positive Correlation means that high scores in one variable (X) are associated with high scores in another variable (Y) and vise versa. � � A correlation coefficient close to +1. 00 indicates a strong positive correlation. E. g. High attendance ratio can predict high grades. � Negative Correlation means that high scores in one variable (X) are associated with low scores in another variable (Y) and vise versa. � � A correlation coefficient close to -1. 00 indicates a strong negative correlation. E. g. As the amount of addiction toward TV shows increases, the GPA decreases. � No Correlation means that change of score in one variable (X) do not effect scores of another variable (Y). � correlation coefficient of 0 indicates no correlation.
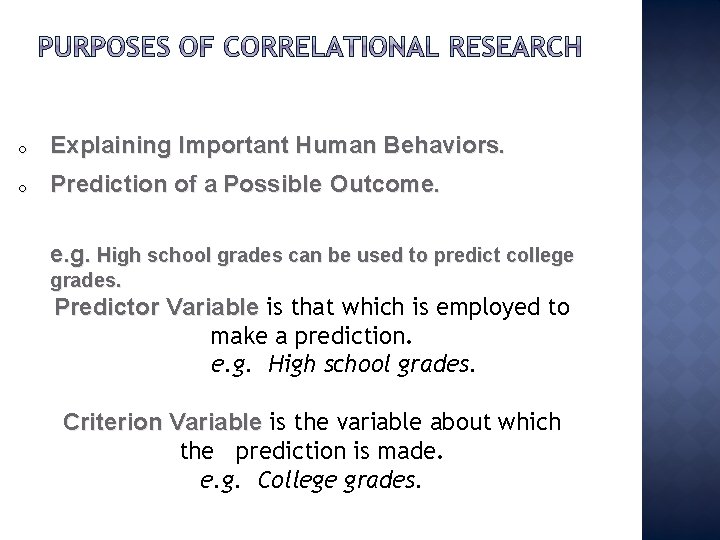
o Explaining Important Human Behaviors. o Prediction of a Possible Outcome. e. g. High school grades can be used to predict college grades. Predictor Variable is that which is employed to make a prediction. e. g. High school grades. Criterion Variable is the variable about which the prediction is made. e. g. College grades.
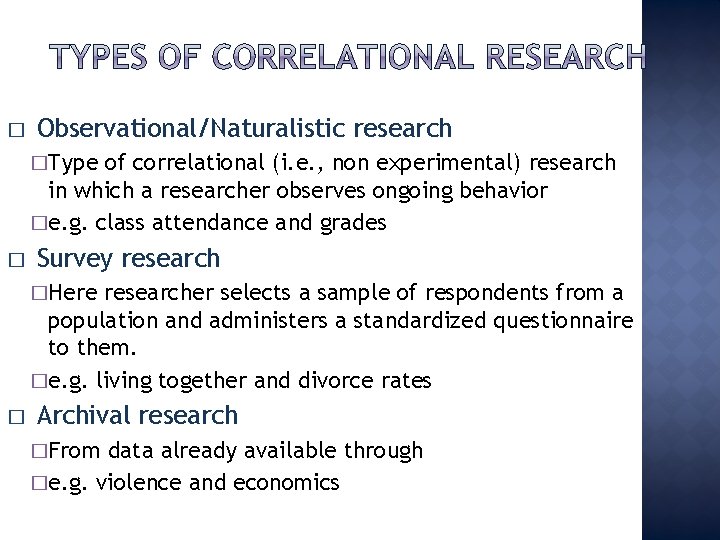
� Observational/Naturalistic research �Type of correlational (i. e. , non experimental) research in which a researcher observes ongoing behavior �e. g. class attendance and grades � Survey research �Here researcher selects a sample of respondents from a population and administers a standardized questionnaire to them. �e. g. living together and divorce rates � Archival research �From data already available through �e. g. violence and economics
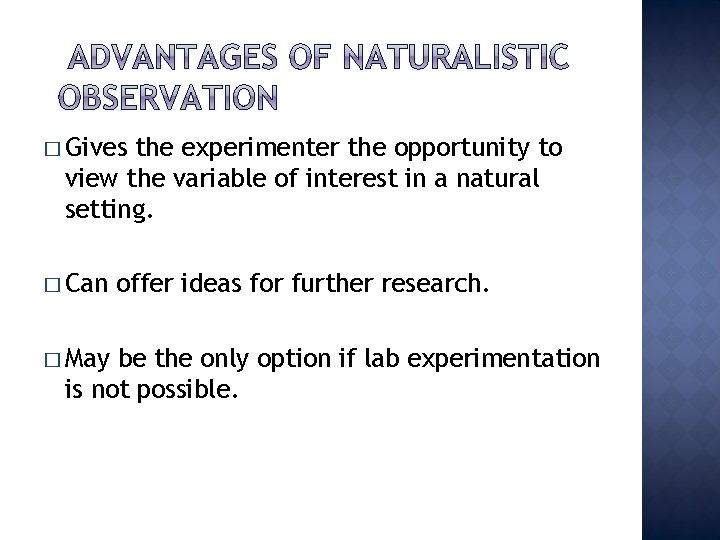
� Gives the experimenter the opportunity to view the variable of interest in a natural setting. � Can � May offer ideas for further research. be the only option if lab experimentation is not possible.
� Can be time consuming and expensive. � Does not allow for scientific control of variables. � Experimenters cannot control extraneous variables. � Subjects may be aware of the observer and may act differently as a result.
� It’s fast, cheap, and easy. Researchers can collect large amount of data in a relatively short amount of time. � More flexible than some other methods.
� Can be affected by an unrepresentative sample or poor survey questions. � Participants can affect the outcome. Some participants try to please the researcher, lie to make themselves look better, or have mistaken memories.
� The experimenter cannot introduce changes in participant behavior. � Enormous amounts of data provide a better view of trends, relationships, and outcomes. � Often less expensive than other study methods. Researchers can often access data through free archives or records databases.
� The researchers have not control over how data was collected. � Important date may be missing from the records. � Previous research may be unreliable.
CONT: Using particular instrument many times, there is possibility of instrument decay. Care must be taken to ensure observers don’t become tired, bored or inattentive
• Unconscious bias on the part of data gatherers when both instruments are scored by same person. • For example high score in first test may lead to examiner expectation of high score in second test. • Solution is to have different administrators for each test.
• Threat is there if different persons administer both instruments. • For example gender or age may effect specific responses, particularly in attitudinal instruments. • Can be avoided by having each instrument administered by different individual.
CONT: • Responding to first instrument may influence subject responses to second instrument. • Solution is to administer instruments at different times and contexts. • • It is not a problem of internal validity. • Loss of subject may create threat to external validity.
Basic steps in Correlational Research
� The description of problem in hand, which need to be analyzed. � The problem have to be selected, defined and delimited. �Is variable X related to Y? �How well does variable X predict variable Y? § What relationships exist among a number of variables and what predictions can be made based in them?
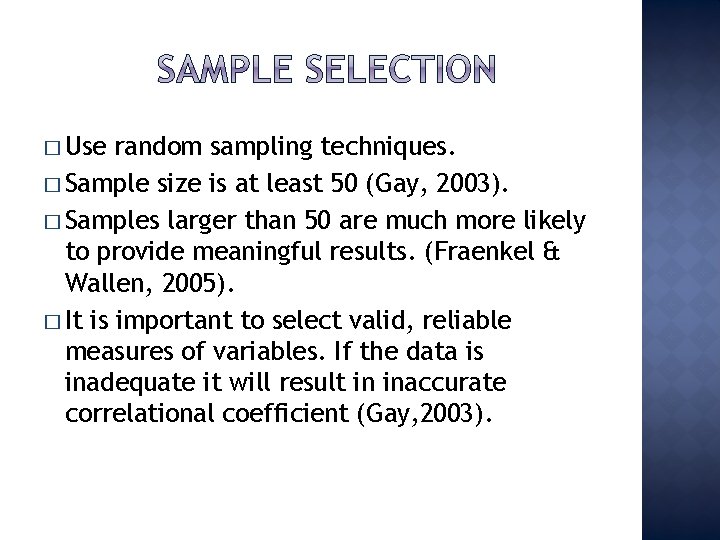
� Use random sampling techniques. � Sample size is at least 50 (Gay, 2003). � Samples larger than 50 are much more likely to provide meaningful results. (Fraenkel & Wallen, 2005). � It is important to select valid, reliable measures of variables. If the data is inadequate it will result in inaccurate correlational coefficient (Gay, 2003).
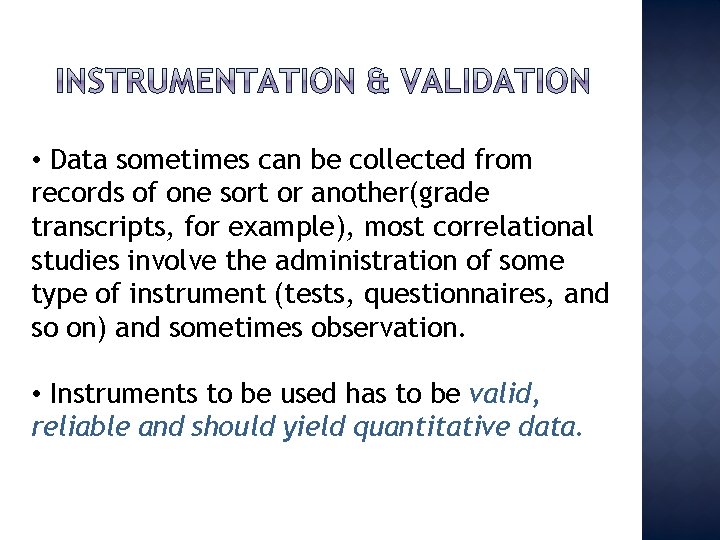
• Data sometimes can be collected from records of one sort or another(grade transcripts, for example), most correlational studies involve the administration of some type of instrument (tests, questionnaires, and so on) and sometimes observation. • Instruments to be used has to be valid, reliable and should yield quantitative data.
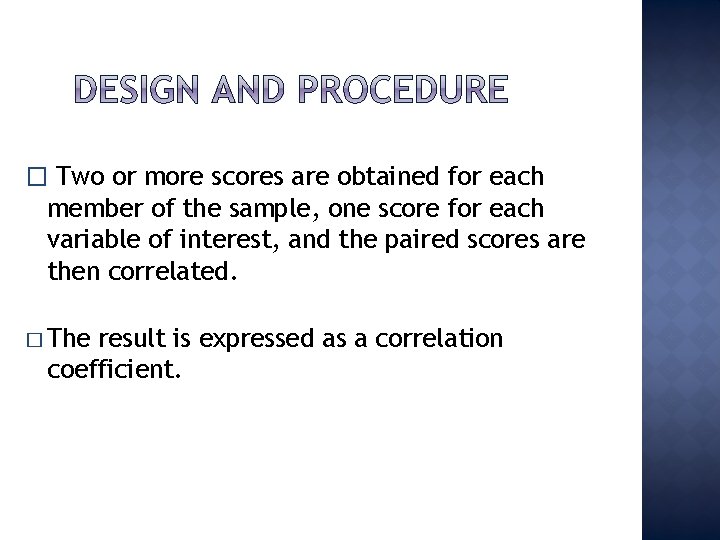
� Two or more scores are obtained for each member of the sample, one score for each variable of interest, and the paired scores are then correlated. � The result is expressed as a correlation coefficient.
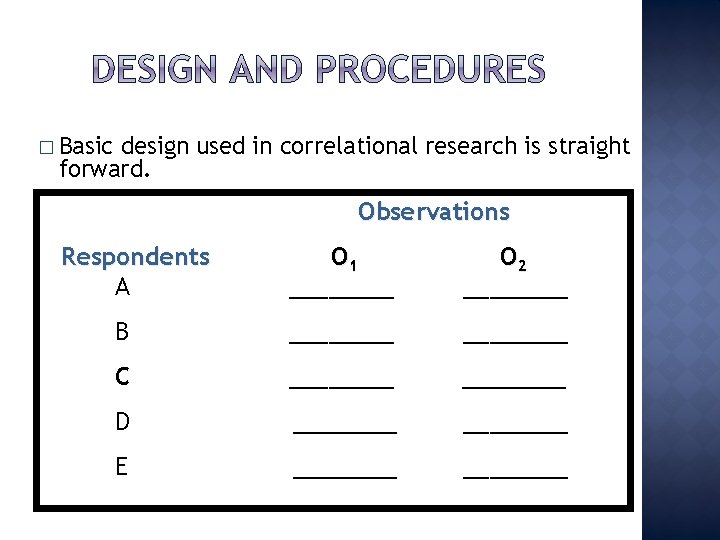
� Basic design used in correlational research is straight forward. Observations Respondents A O 1 ____ O 2 ____ B ________ C ________ D ________ E ________
� Collect the data for each of the variables to be studied with the use of the instruments the researcher has prepared/ selected.
• Correlation of two variables results in correlation coefficient. • Correlation coefficient is a decimal number between 0 and -1 and between 0 and +1. • Typically the Pearson’s Product Moment Correlation Coefficient or the Pearson’s r Correlation Coefficient is used for correlation analyses.
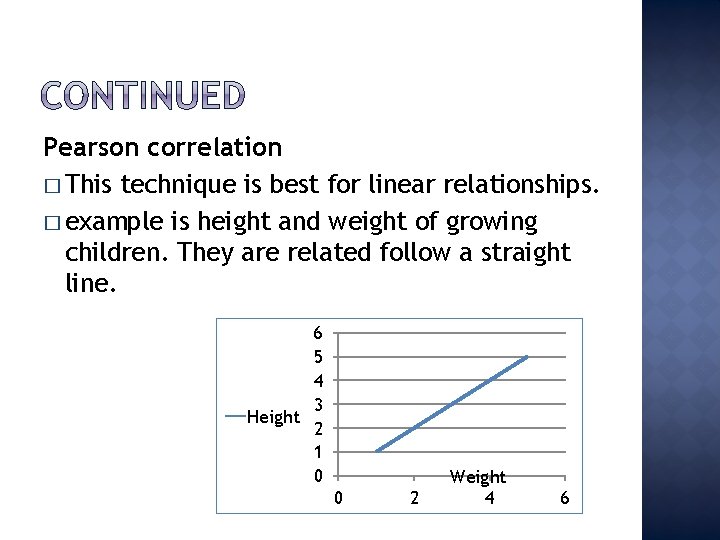
Pearson correlation � This technique is best for linear relationships. � example is height and weight of growing children. They are related follow a straight line. 6 5 4 3 Height 2 1 0 0 2 Weight 4 6
-1. 00 strong negative 0. 00 +1. 00 no relationship strong positive
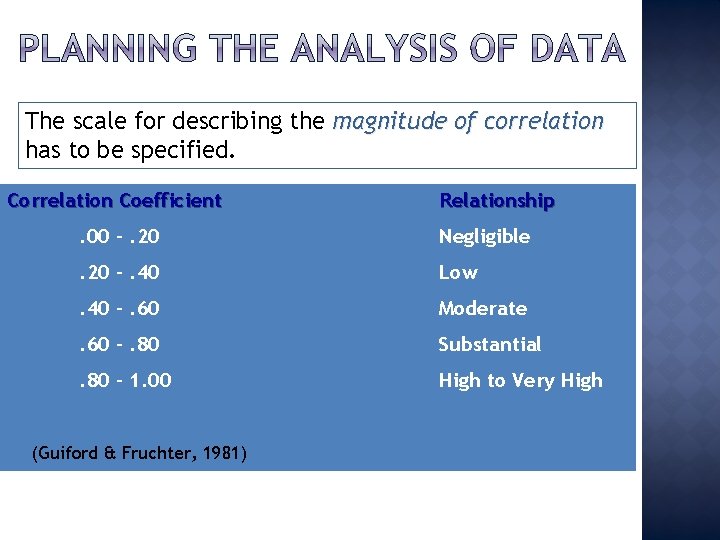
The scale for describing the magnitude of correlation has to be specified. Correlation Coefficient Relationship . 00 -. 20 Negligible . 20 -. 40 Low . 40 -. 60 Moderate . 60 -. 80 Substantial . 80 – 1. 00 High to Very High (Guiford & Fruchter, 1981)
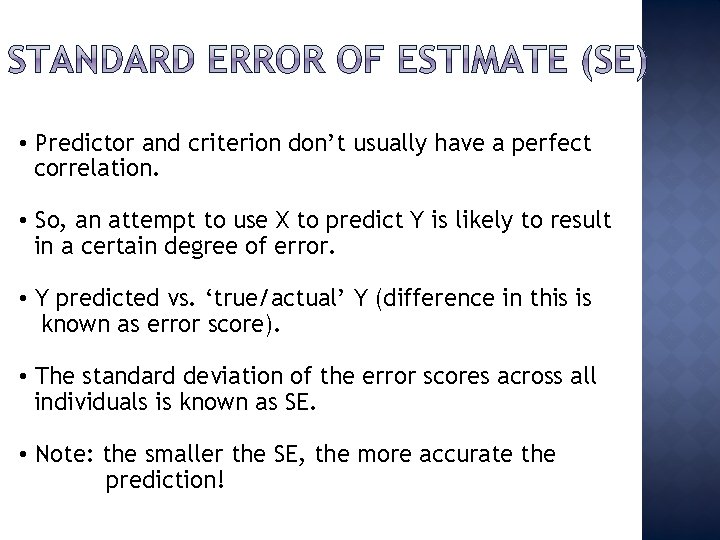
• Predictor and criterion don’t usually have a perfect correlation. • So, an attempt to use X to predict Y is likely to result in a certain degree of error. • Y predicted vs. ‘true/actual’ Y (difference in this is known as error score). • The standard deviation of the error scores across all individuals is known as SE. • Note: the smaller the SE, the more accurate the prediction!
y x
y x
y x
y x
• Findings for each problem posed in the study are summarized statistically and conclusions are drawn • Recommendations are formulated by the researcher based on the significant findings noted.
� Cherry, K. (n. d. ) Correlational studies: Psychology correlational studies. Retrieved from http: //psychology. about. com/od/research methods/a/correlational. html. research with � Fraenkel, R. , & Wallen, E. (2005). How to Design and Evaluate Research in Education (6 th ed. ). San Fransisco: Corwin. � Gay, L. R. (2003). Educational research (5 th ed. ). International University. � Muller, A. (2002). Education, income inequality, and mortality: A multiple regressions. Retrieved 10 th july, 2001, from http: //www. bmj. com/content/324/7328/23. � The survey system. Retrieved from http: //www. surveysystem. com/correlation. htm Florida: Florida