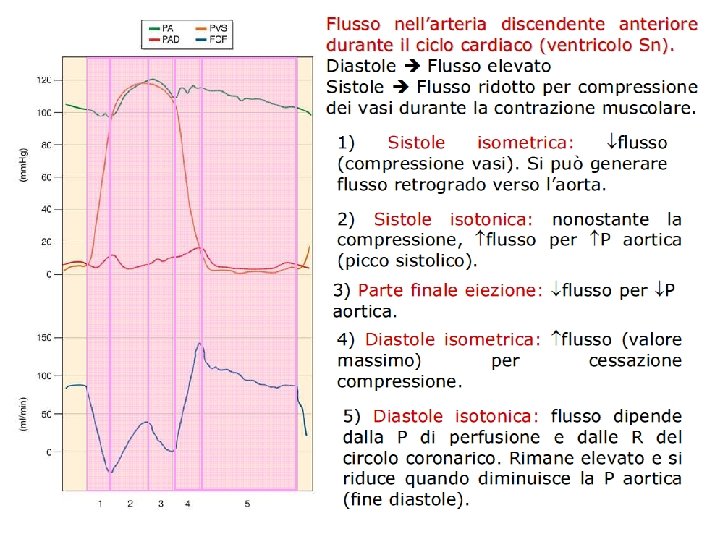
Pressione aortica Flusso aortico Pressione ventricolare Flusso circonflessa


 and")
 and coronary venous oxygen tension")


:")


 in a patient with proximal left")

- Slides: 29
Pressione aortica Flusso aortico Pressione ventricolare Flusso circonflessa 120 10 60 30 0 5 l/ min mm. Hg 90 0 100 0 ml/ min 50
Figure 17. Coronary blood flow and hemodynamic responses to treadmill exercise in dogs. Modified from Khouri et al. (672). L. Circ. = left circumflex coronary artery; Cor. = coronary; Syst. = systolic; Diast. = diastolic. See text for further explanation. Modified from (295) with permission of the American Physiological Society.
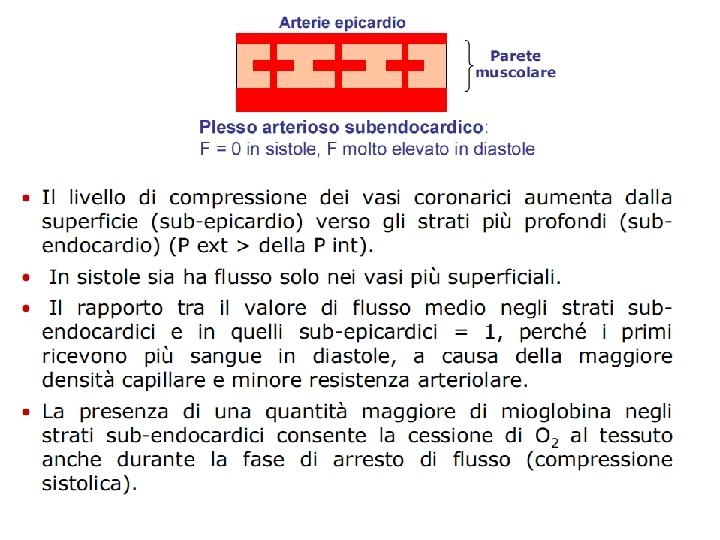
Figure 19. Graph showing a schematic drawing of the intramyocardial microvasculature (upper panel) and the extravascular forces acting on the coronary microvasculature during diastole (left lower panel) and systole (lower right panel). Abbreviations: PIM = intramyocardial pressure; PLUMEN = pressure in left ventricular lumen; PPERI = pressure in pericardial space; Left ventricular lumen pressure. See text for further explanation. Modified from (295) with permission of the American Physiological Society.
Figure 22. Relation beween myocardial oxygen consumption (MVO 2) and coronary venous oxygen tension (CVPO 2) in the right ventricle (RV) and the left ventricle (LV) in dogs during treadmill exercise. Note the lower levels of MVO 2 and higher levels of CVPO 2 in the RV compared to the LV. Data are from Hart et al. (496) for RV data and from Gorman et al. (431) for LV data. Data have been presented as mean ± SE. See text for further explanation. Modified from (295) with permission of the American Physiological Society.
Figure 26. Graph summarizing the structural and functional coronary microcirculatory adaptations to chronic exercise training. ACh = acetylcholine; M = muscarinic receptor; NE = norepinephrine; α 1 = α 1‐adrenergic receptor. β 2 = β 2‐adrenergic receptor. Modified from (295) with permission of the American Physiological Society.
Il cuore produce lavoro: gettata sistolica*pressione media in sistole= lavoro/sistole gettata cardiaca*pressione aortica media= lavoro minuto cardiaco= potenza Rendimento (efficienza)= lavoro prodotto/energia consumata gettata cardiaca*pressione aortica media /consumo O 2
Esempio (pressione in mm. Hg, gettata in l/min, cons. O 2 in unità arbitrarie): pressione=100, gettata=5 potenza=500, cons. O 2=10 pressione=100, pressione=200, gettata=10 gettata=5 potenza=1000, cons. O O 22== 15 25 Generare pressione è energeticamente costoso: l’aumento di pressione diminuisce il rendimento
http: //www. youtube. com/watch? v=t. BQa 8 IBz. P 6 I
From: Coronary Flow Reserve and Pharmacologic Stress Perfusion Imaging: Beginnings and Evolution J Am Coll Cardiol Img. 2009; 2(5): 664 -669. doi: 10. 1016/j. jcmg. 2008. 12. 024 Figure Legend: Coronary Flow at Resting Baseline and at Maximum After Pharmacologic Stress With Timing of Radionuclides for Perfusion Imaging Adapted with permission from Gould et al. (1). Date of download: 3/5/2014 Copyright © The American College of Cardiology. All rights reserved.
From: Coronary Flow Reserve and Pharmacologic Stress Perfusion Imaging: Beginnings and Evolution J Am Coll Cardiol Img. 2009; 2(5): 664 -669. doi: 10. 1016/j. jcmg. 2008. 12. 024 Figure Legend: Coronary Arteriogram and Arterial Diameter at Resting Baseline Conditions and at Maximum Flow in a Chronically Instrumented Animal Model The radiopaque sphere is a steel ball bearing 3. 18 mm in diameter implanted next to the coronary artery at surgery as a size reference. Flowmeter wires and an external additional reference bar are also seen. Black arrows indicate resting baseline conditions; white arrows indicate maximum flow. Adapted with permission from Gould et al. (15). Date of download: 3/5/2014 Copyright © The American College of Cardiology. All rights reserved.
Normal LV angiogram (top middle and right panels) in a patient with proximal left anterior descending coronary artery occlusion (LAD; black arrow; top left panel). Traupe T et al. Circulation. 2010; 122: 1210 -1220 Copyright © American Heart Association, Inc. All rights reserved.
Figure 1. Left anterior oblique view of the right coronary arteriogram. Koerselman J et al. Circulation. 2003; 107: 2507 -2511 Copyright © American Heart Association, Inc. All rights reserved.