Post 2004 Hurricane Field Survey Evaluation of the
- Slides: 45
Post 2004 Hurricane Field Survey Evaluation of the Relative Performance of the Standard Building Code and the Florida Building Code Kurt Gurley – UF Jeff Burton – IBHS Makola Abdullah – FAMU Forrest Masters – FIU Tim Reinhold – IBHS
Project Goal • Determine if 2002 code change reduced the vulnerability of residential single family homes • Quantitative rather then anecdotal – Physical damage – $ Loss ratio – Behaviors (mitigation & evacuation) • Stratify results by wind speed and code
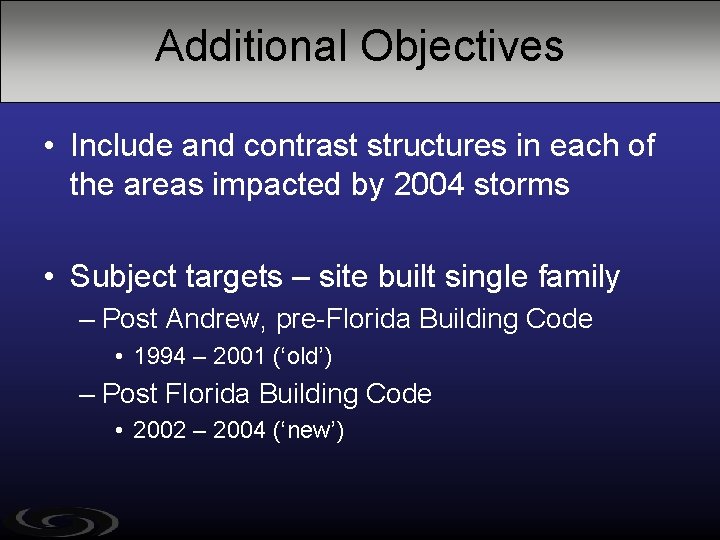
Additional Objectives • Include and contrast structures in each of the areas impacted by 2004 storms • Subject targets – site built single family – Post Andrew, pre-Florida Building Code • 1994 – 2001 (‘old’) – Post Florida Building Code • 2002 – 2004 (‘new’)
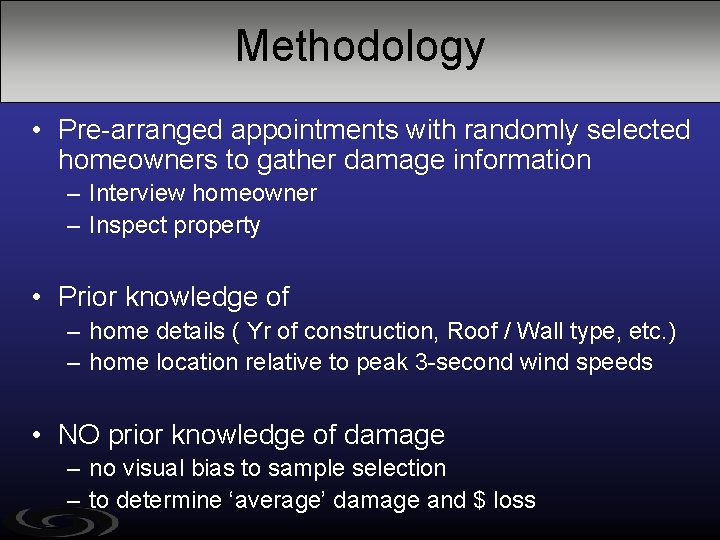
Methodology • Pre-arranged appointments with randomly selected homeowners to gather damage information – Interview homeowner – Inspect property • Prior knowledge of – home details ( Yr of construction, Roof / Wall type, etc. ) – home location relative to peak 3 -second wind speeds • NO prior knowledge of damage – no visual bias to sample selection – to determine ‘average’ damage and $ loss
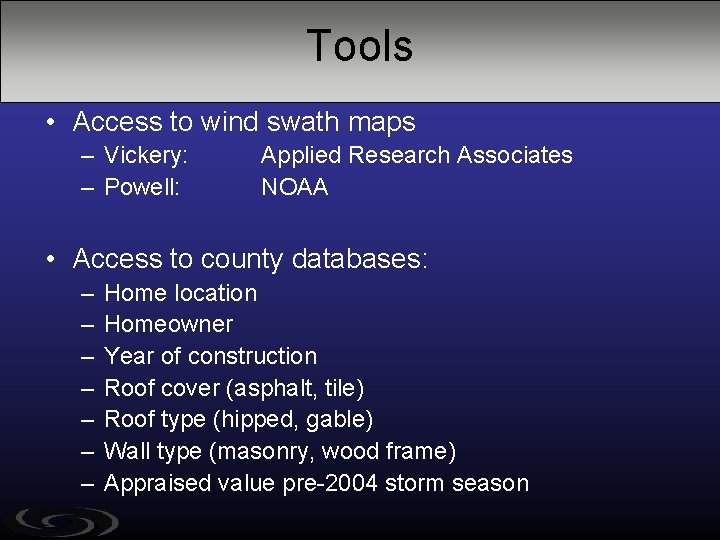
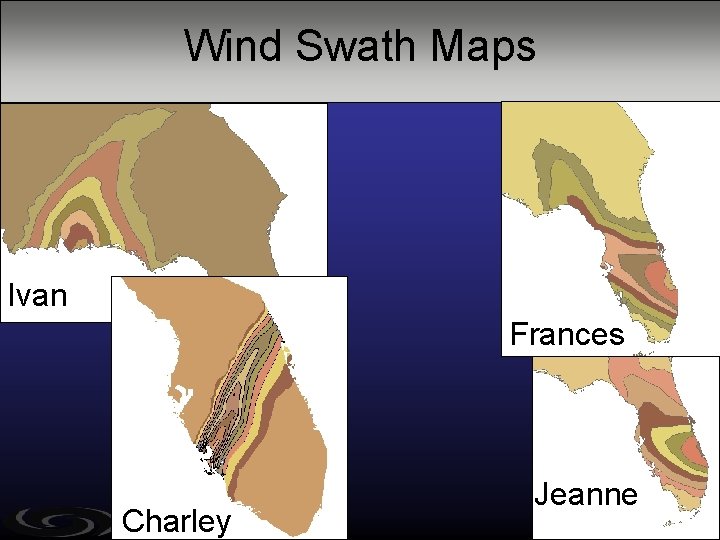
Tools • Access to wind swath maps – Vickery: – Powell: Applied Research Associates NOAA • Access to county databases: – – – – Home location Homeowner Year of construction Roof cover (asphalt, tile) Roof type (hipped, gable) Wall type (masonry, wood frame) Appraised value pre-2004 storm season
Wind Swath Maps Ivan Frances Charley Jeanne
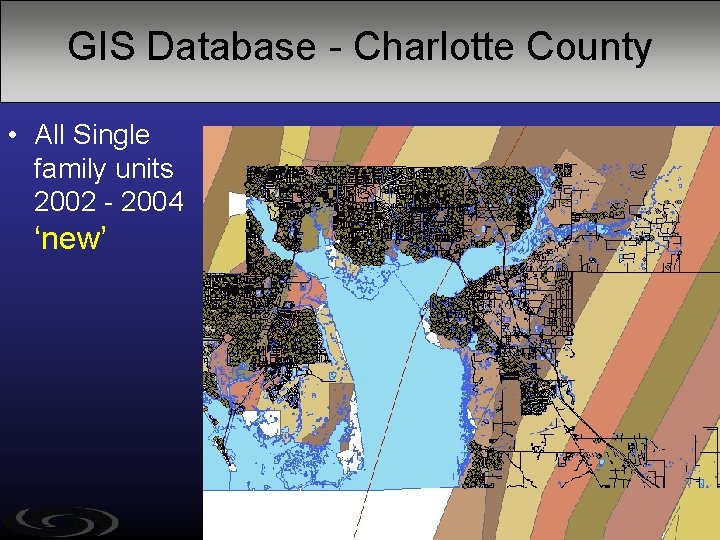
GIS Database - Charlotte County • All Single family units 2002 - 2004 ‘new’
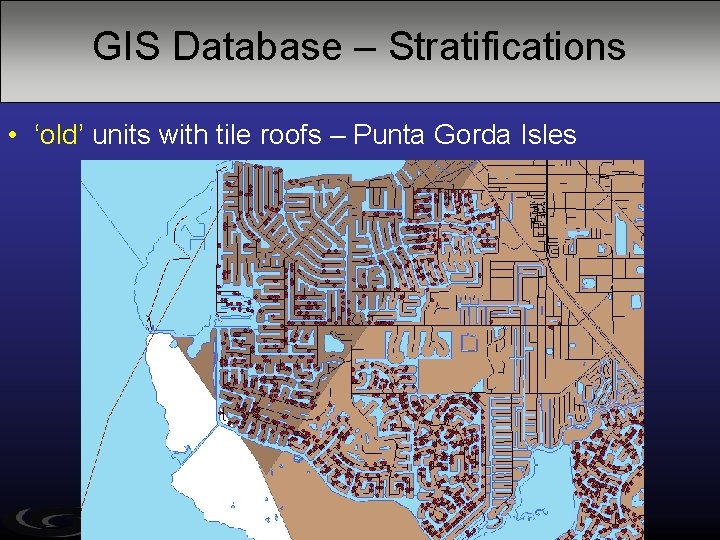
GIS Database – Stratifications • ‘old’ units with tile roofs – Punta Gorda Isles
Stratified Sampling Procedure • Overlay wind swath maps with homes that fit desired characteristics (age, roof cover, etc. ) • Randomly select homes across desired wind swath contours • The homeowners contacted by phone in random order (25% success rate)
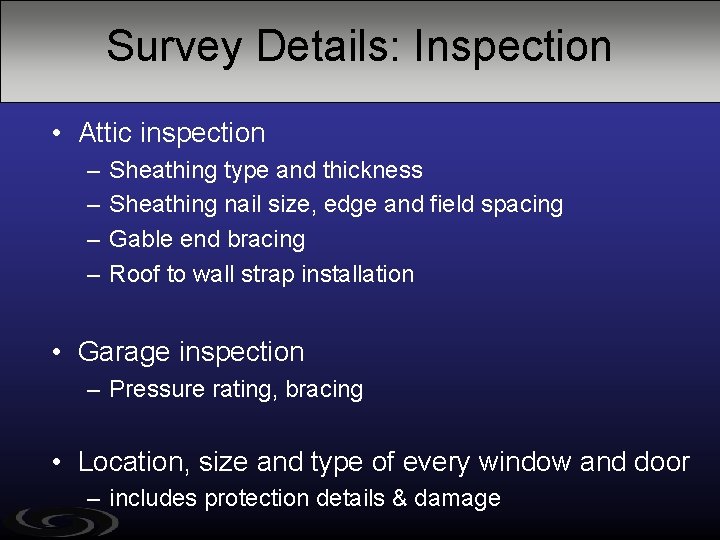
Survey Details: Inspection • Digital photographs – All angles and corners of subject – Surrounding terrain • Distance to adjacent large objects in all directions • Sketch elevations and plan view
Survey Details: Inspection • Attic inspection – – Sheathing type and thickness Sheathing nail size, edge and field spacing Gable end bracing Roof to wall strap installation • Garage inspection – Pressure rating, bracing • Location, size and type of every window and door – includes protection details & damage
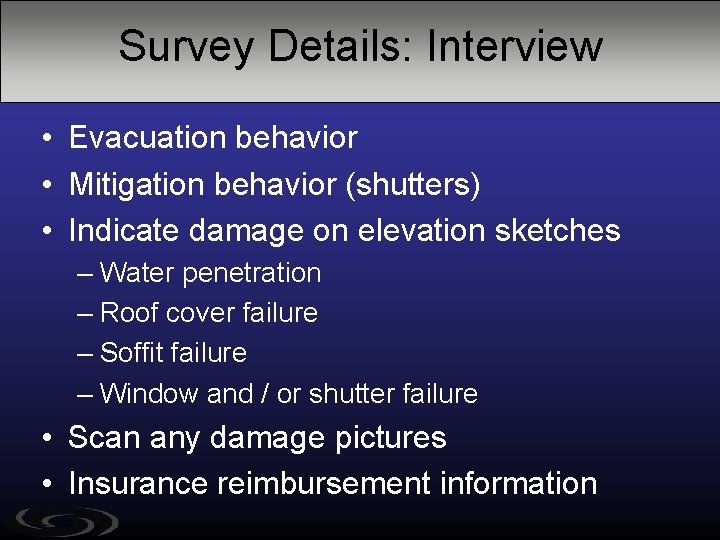
Survey Details: Interview • Evacuation behavior • Mitigation behavior (shutters) • Indicate damage on elevation sketches – Water penetration – Roof cover failure – Soffit failure – Window and / or shutter failure • Scan any damage pictures • Insurance reimbursement information
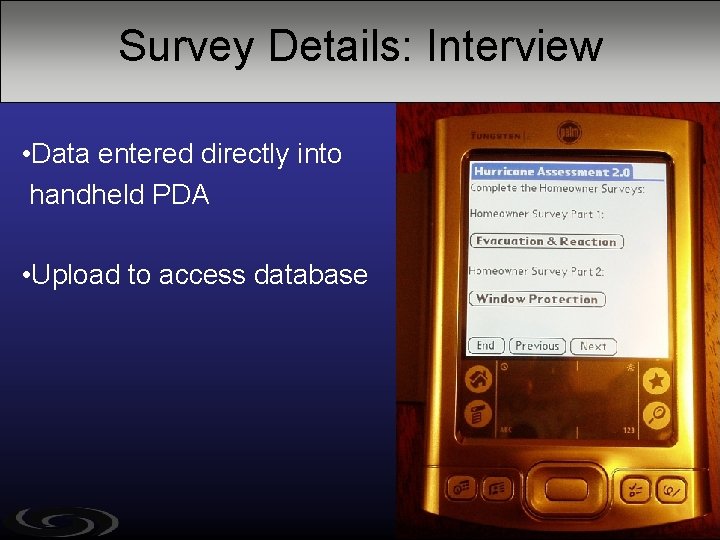
Survey Details: Interview • Data entered directly into handheld PDA • Upload to access database
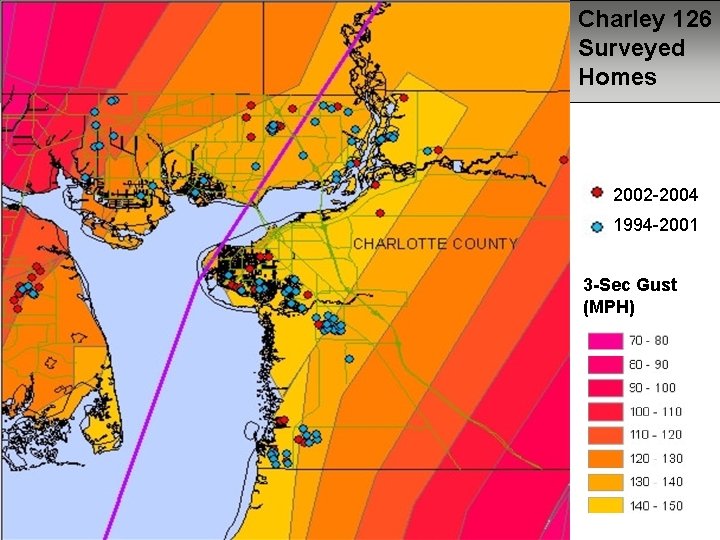
Charley Surveyed Homes Charley 126 Surveyed Homes 2002 -2004 1994 -2001 3 -Sec Gust (MPH)
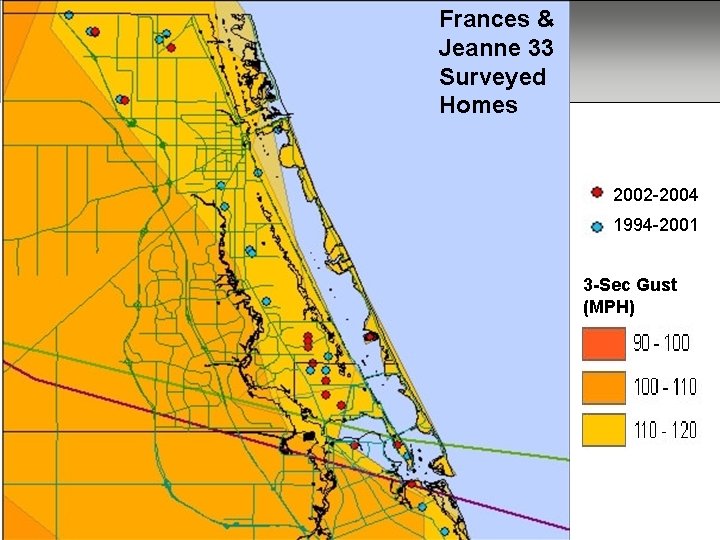
Frances & Frances and Jeanne 33 Surveyed Homes 2002 -2004 1994 -2001 3 -Sec Gust (MPH)
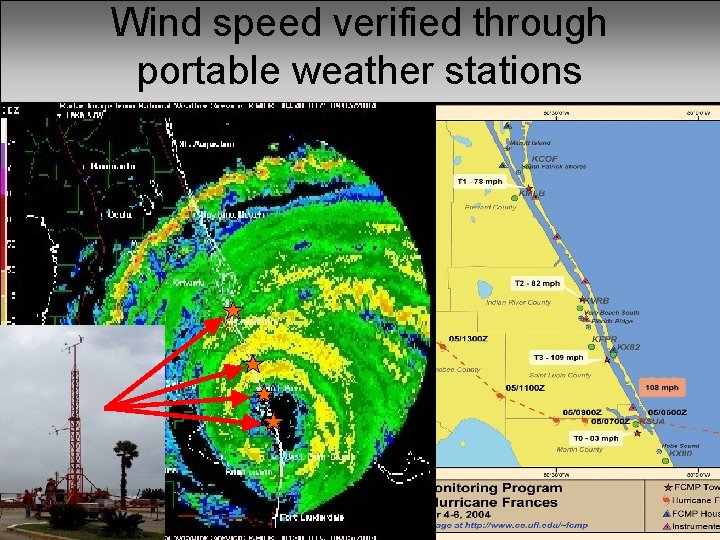
Wind speed verified through portable weather stations
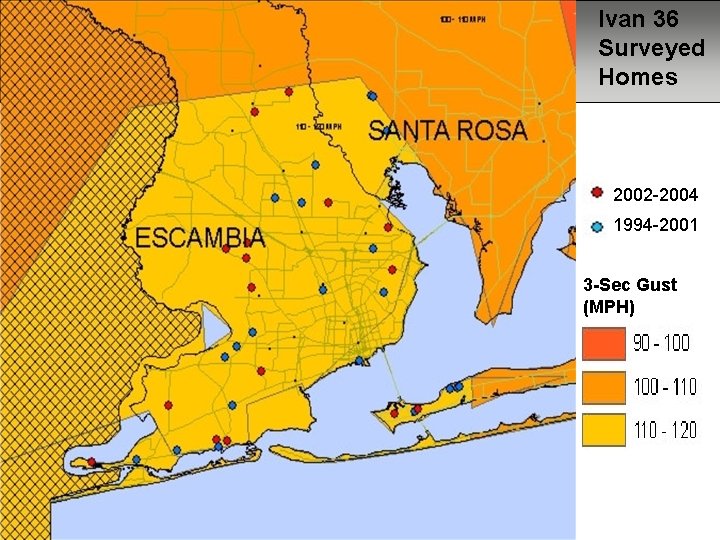
Ivan Surveyed Homes Ivan 36 Surveyed Homes 2002 -2004 1994 -2001 3 -Sec Gust (MPH)
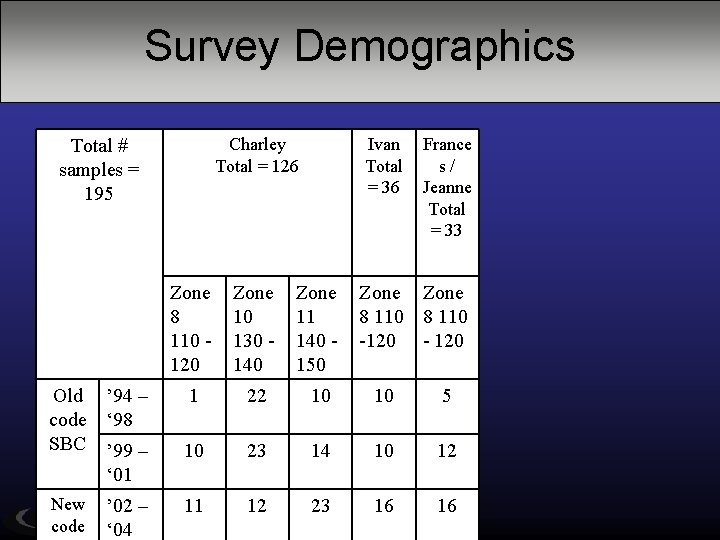
Survey Demographics Charley Total = 126 Total # samples = 195 Old ’ 94 – code ‘ 98 SBC ’ 99 – ‘ 01 New code ’ 02 – ‘ 04 Ivan Total = 36 France s/ Jeanne Total = 33 Zone 8 110 120 Zone 10 130 140 Zone 11 140 150 Zone 8 110 -120 - 120 1 22 10 10 5 10 23 14 10 12 11 12 23 16 16
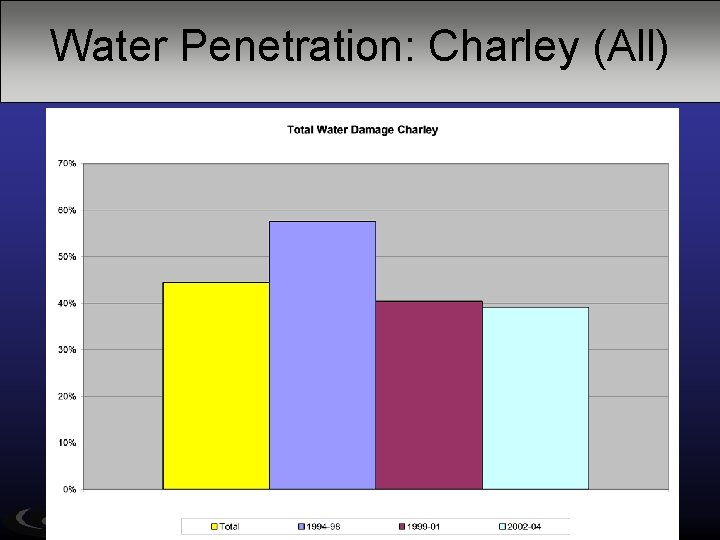
Water Penetration: Charley (All) Old New
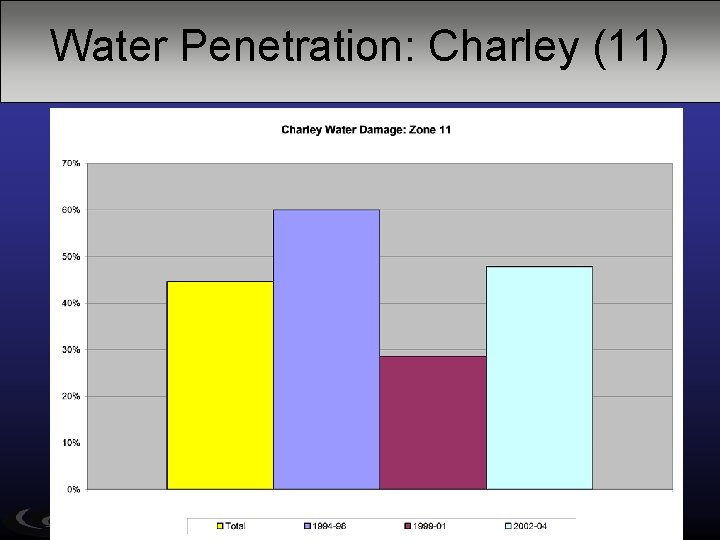
Water Penetration: Charley (11) Old New
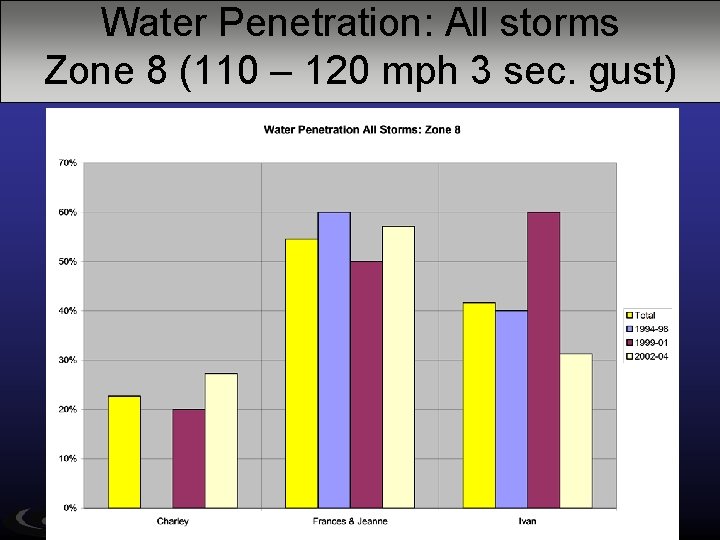
Water Penetration: All storms Zone 8 (110 – 120 mph 3 sec. gust) Old New
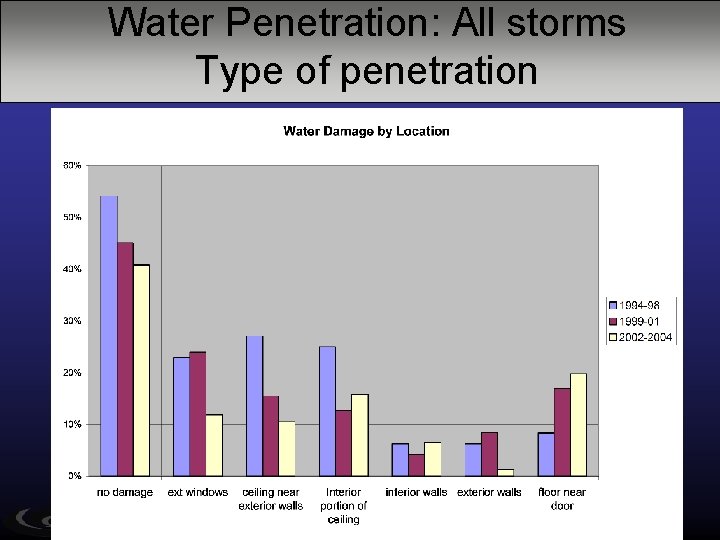
Water Penetration: All storms Type of penetration Old New
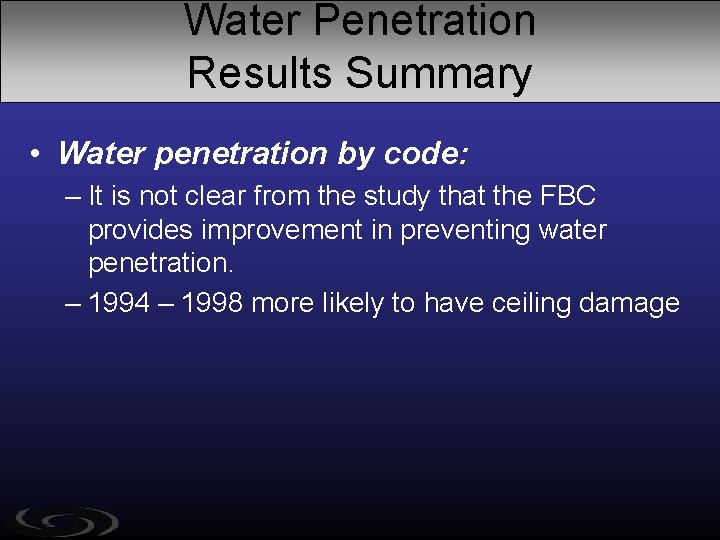
Water Penetration Results Summary • Water penetration by code: – It is not clear from the study that the FBC provides improvement in preventing water penetration. – 1994 – 1998 more likely to have ceiling damage
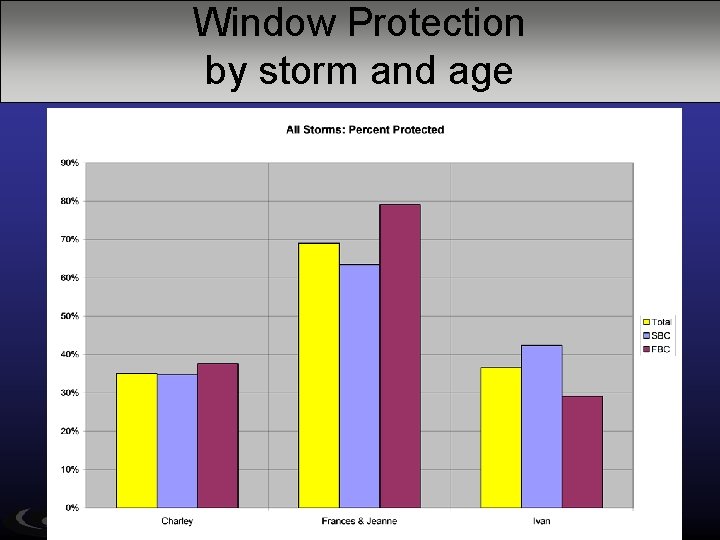
Window Protection by storm and age Old New
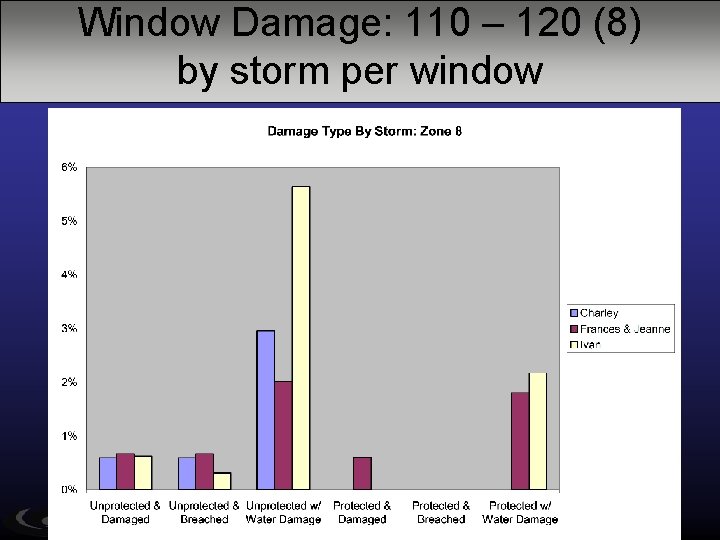
Window Damage: 110 – 120 (8) by storm per window Old New
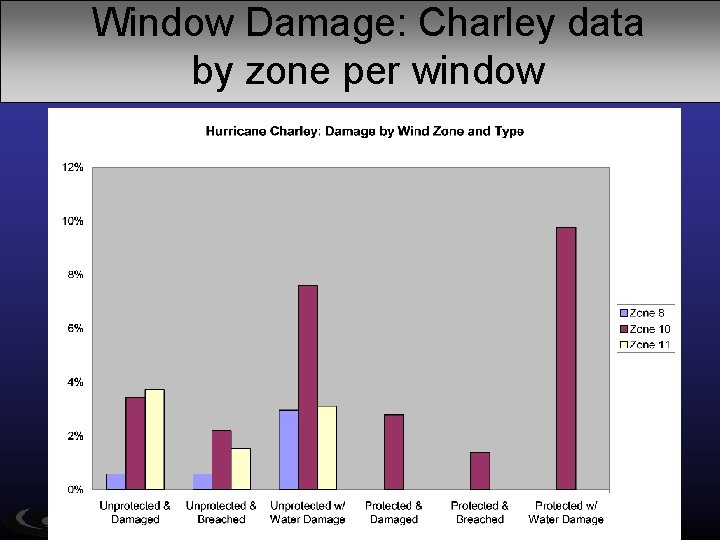
Window Damage: Charley data by zone per window Old New
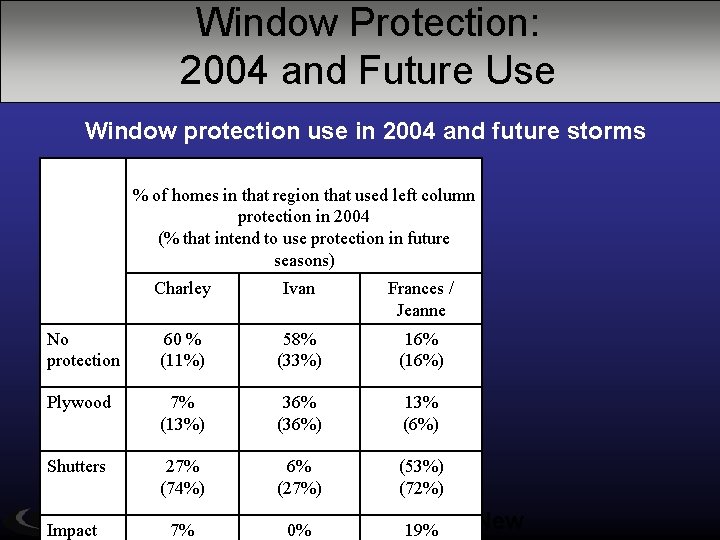
Window Protection: 2004 and Future Use Window protection use in 2004 and future storms % of homes in that region that used left column protection in 2004 (% that intend to use protection in future seasons) Charley Ivan Frances / Jeanne No protection 60 % (11%) 58% (33%) 16% (16%) Plywood 7% (13%) 36% (36%) 13% (6%) Shutters 27% (74%) 6% (27%) (53%) (72%) Impact 7% Old 0% 19% New
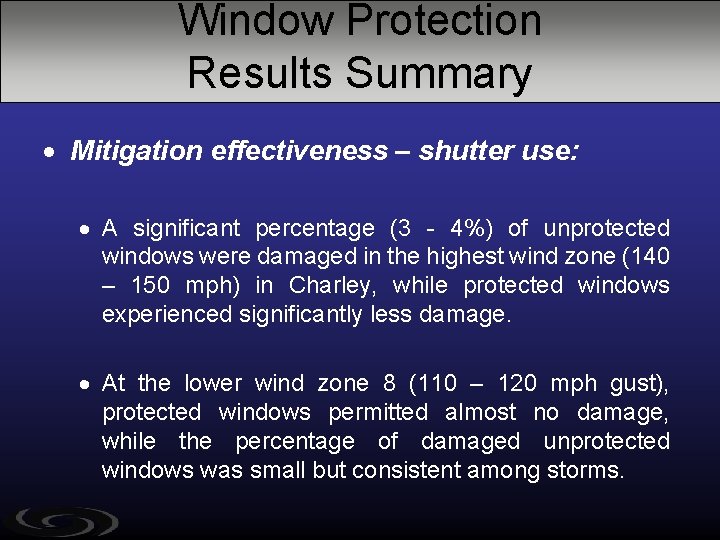
Window Protection Results Summary Mitigation effectiveness – shutter use: A significant percentage (3 - 4%) of unprotected windows were damaged in the highest wind zone (140 – 150 mph) in Charley, while protected windows experienced significantly less damage. At the lower wind zone 8 (110 – 120 mph gust), protected windows permitted almost no damage, while the percentage of damaged unprotected windows was small but consistent among storms.
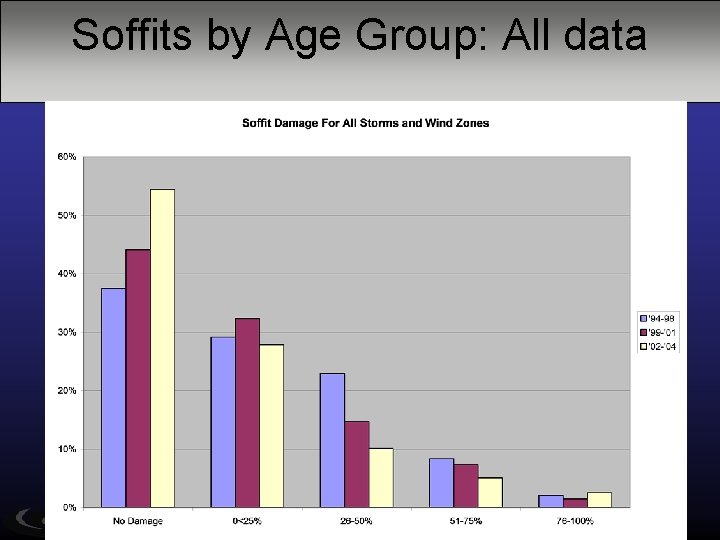
Soffits by Age Group: All data
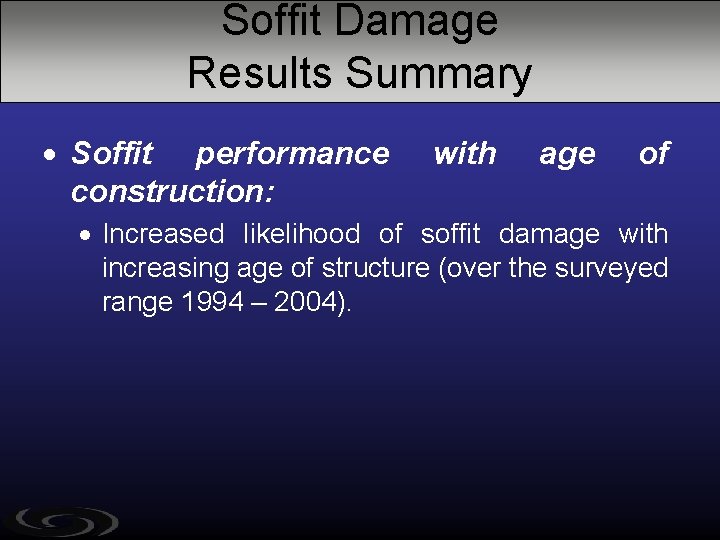
Soffit Damage Results Summary Soffit performance construction: with age of Increased likelihood of soffit damage with increasing age of structure (over the surveyed range 1994 – 2004).
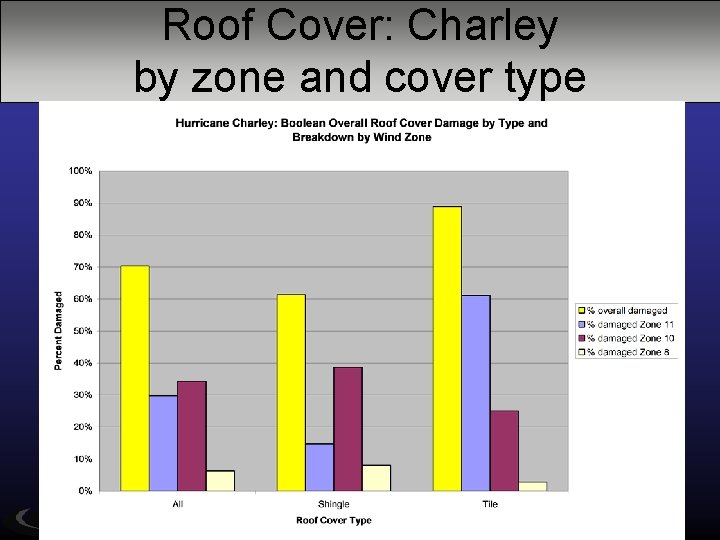
Roof Cover: Charley by zone and cover type
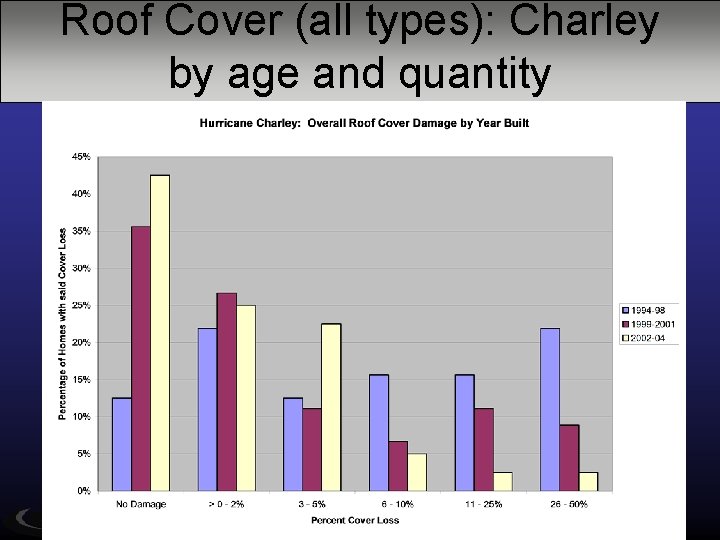
Roof Cover (all types): Charley by age and quantity
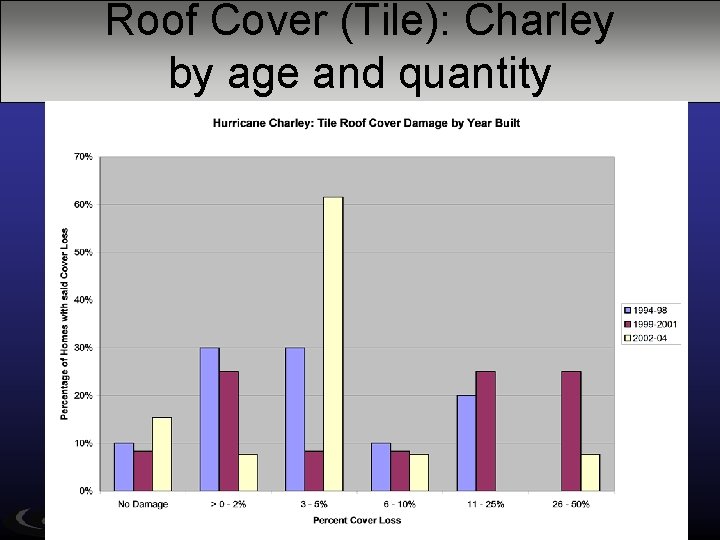
Roof Cover (Tile): Charley by age and quantity
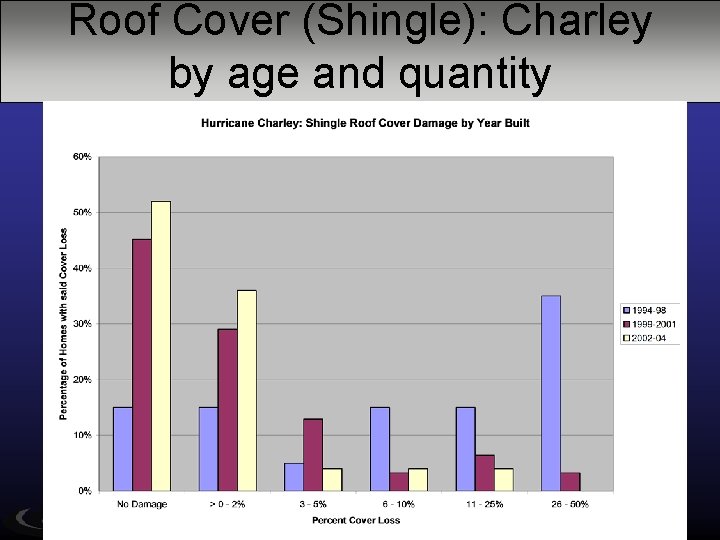
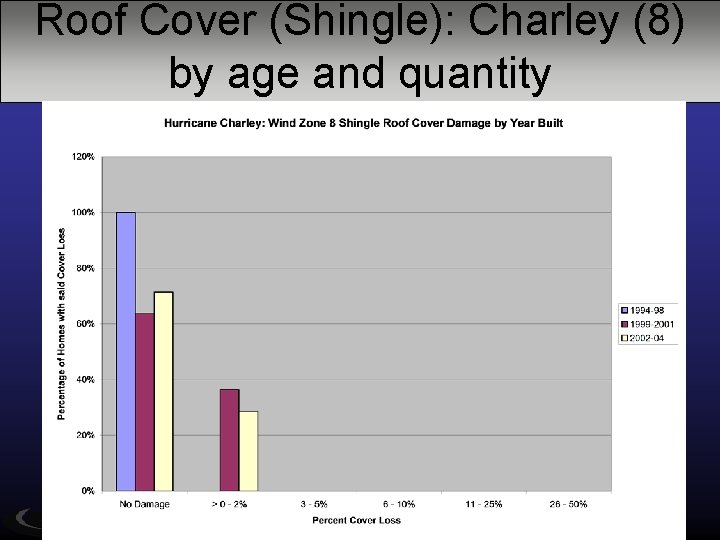
Roof Cover (Shingle): Charley by age and quantity
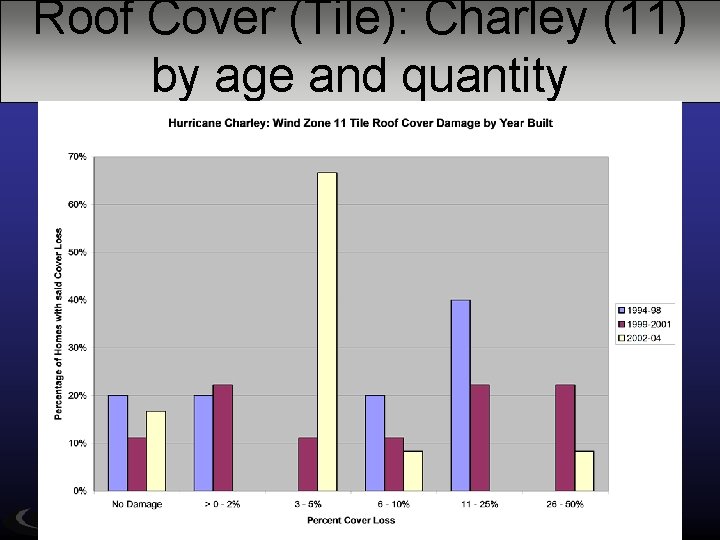
Roof Cover (Tile): Charley (11) by age and quantity
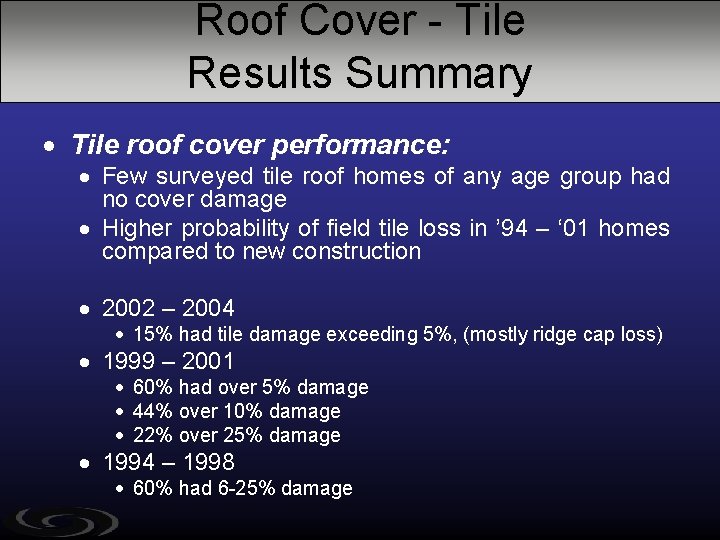
Roof Cover - Tile Results Summary Tile roof cover performance: Few surveyed tile roof homes of any age group had no cover damage Higher probability of field tile loss in ’ 94 – ‘ 01 homes compared to new construction 2002 – 2004 15% had tile damage exceeding 5%, (mostly ridge cap loss) 1999 – 2001 60% had over 5% damage 44% over 10% damage 22% over 25% damage 1994 – 1998 60% had 6 -25% damage
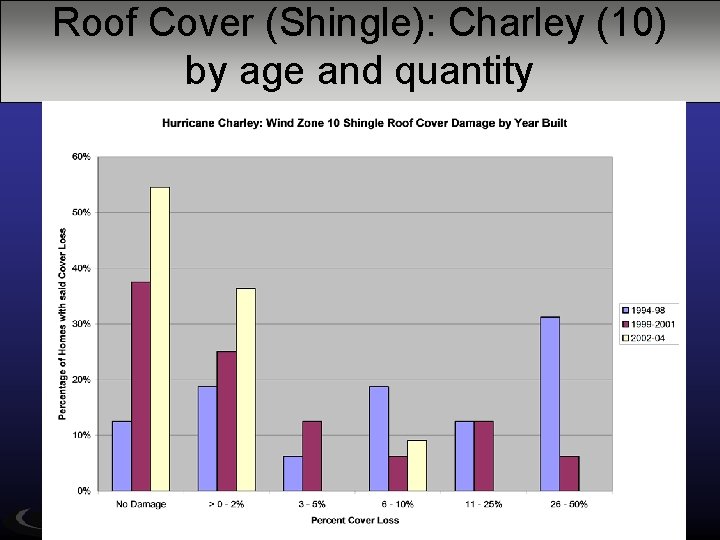
Roof Cover (Shingle): Charley (10) by age and quantity
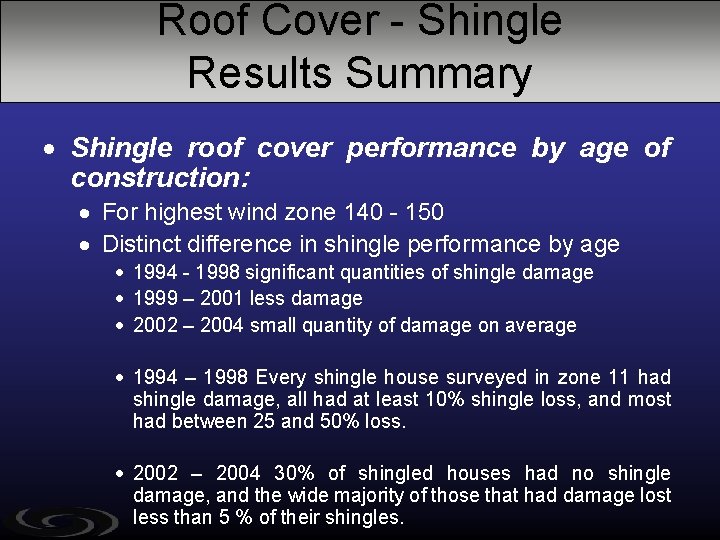
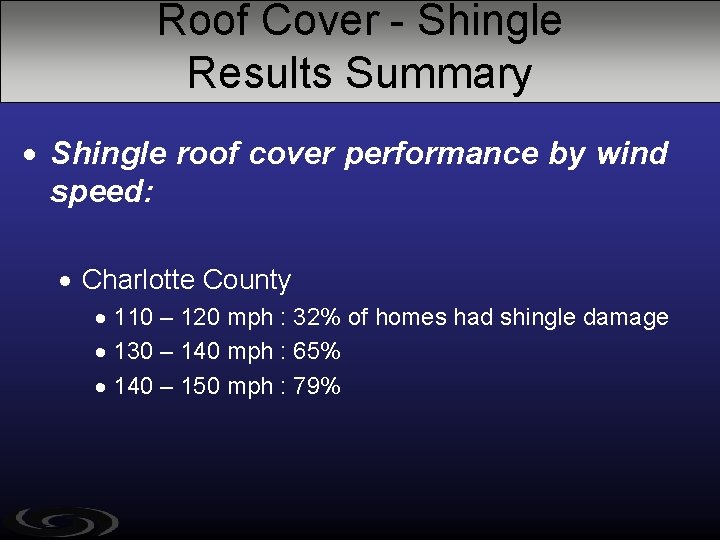
Roof Cover - Shingle Results Summary Shingle roof cover performance by age of construction: For highest wind zone 140 - 150 Distinct difference in shingle performance by age 1994 - 1998 significant quantities of shingle damage 1999 – 2001 less damage 2002 – 2004 small quantity of damage on average 1994 – 1998 Every shingle house surveyed in zone 11 had shingle damage, all had at least 10% shingle loss, and most had between 25 and 50% loss. 2002 – 2004 30% of shingled houses had no shingle damage, and the wide majority of those that had damage lost less than 5 % of their shingles.
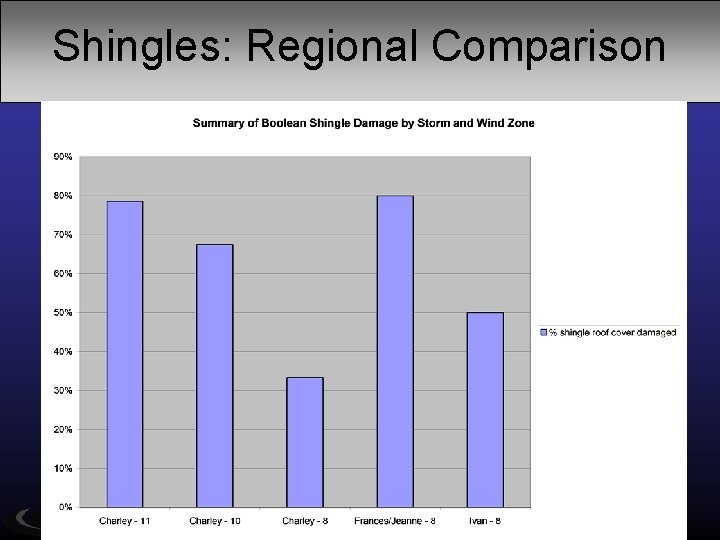
Shingles: Regional Comparison
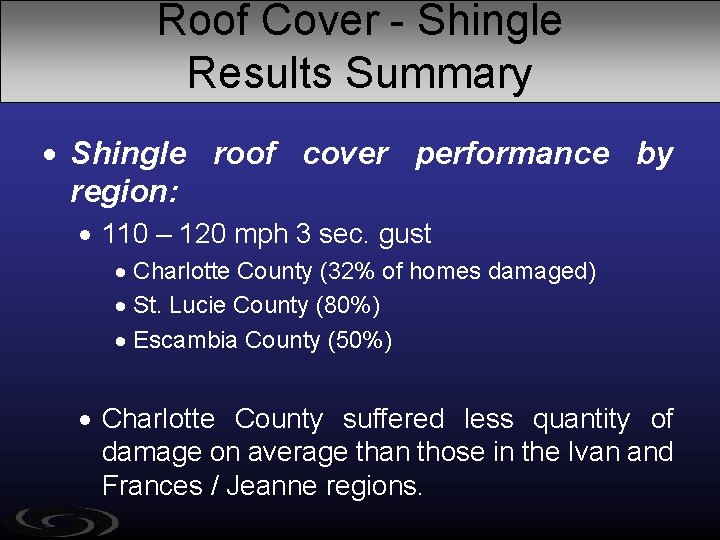
Roof Cover - Shingle Results Summary Shingle roof cover performance by wind speed: Charlotte County 110 – 120 mph : 32% of homes had shingle damage 130 – 140 mph : 65% 140 – 150 mph : 79%
Roof Cover (Shingle): Charley (8) by age and quantity
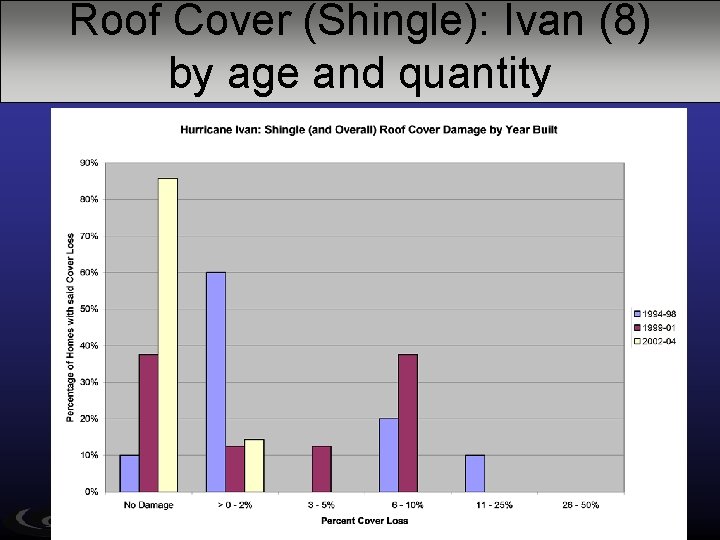
Roof Cover (Shingle): Ivan (8) by age and quantity
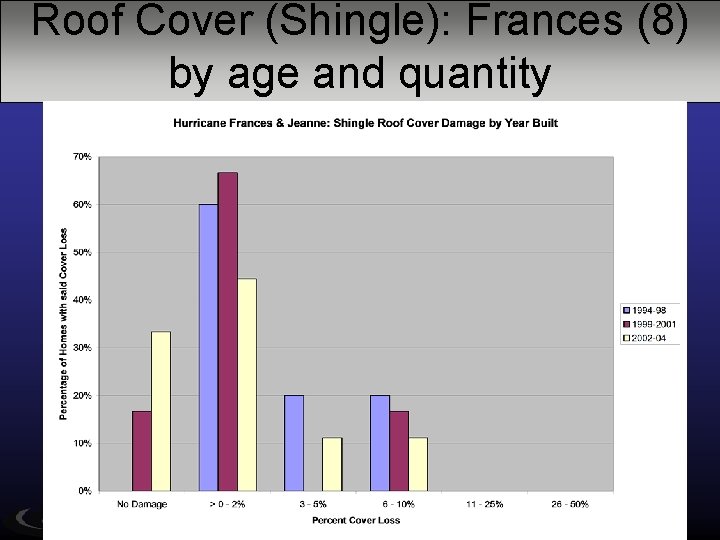
Roof Cover (Shingle): Frances (8) by age and quantity
Roof Cover - Shingle Results Summary Shingle roof cover performance by region: 110 – 120 mph 3 sec. gust Charlotte County (32% of homes damaged) St. Lucie County (80%) Escambia County (50%) Charlotte County suffered less quantity of damage on average than those in the Ivan and Frances / Jeanne regions.
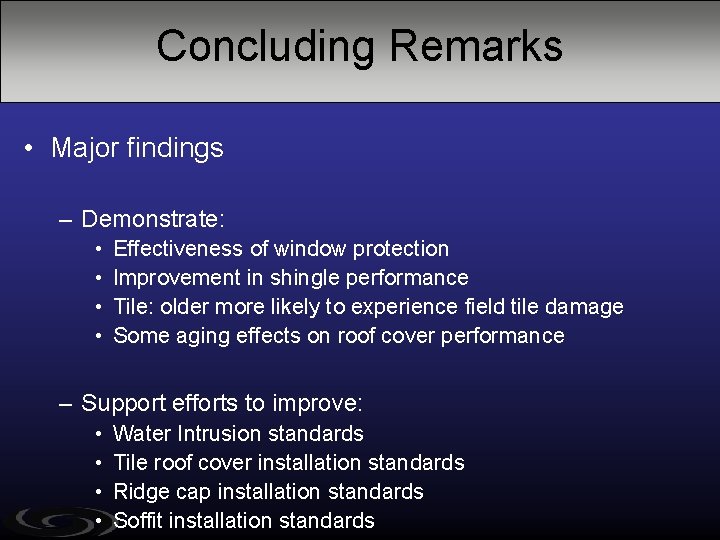
Concluding Remarks • Major findings – Demonstrate: • • Effectiveness of window protection Improvement in shingle performance Tile: older more likely to experience field tile damage Some aging effects on roof cover performance – Support efforts to improve: • • Water Intrusion standards Tile roof cover installation standards Ridge cap installation standards Soffit installation standards