Learning Rules and Clusters for Network Anomaly Detection


:")
")
 – Given training")


 • PHAD uses prior probabilities: P(Z) • ALAD")


 from")


 • Last")


 PROBE LERAD-all only Both LERAD-tcp only 7 23")
, ~20")
 • DARPA 99 data set: attacks are real,")


 • Clusters with fixed")


 Probe 28 19 (70%) DOS 45 25")


- Slides: 40
Learning Rules and Clusters for Network Anomaly Detection Philip Chan, Matt Mahoney, Muhammad Arshad Florida Institute of Technology
Outline • • Related work in anomaly detection Rule Learning algorithm: LERAD Cluster learning algorithm: CLAD Summary and ongoing work
Related Work in Anomaly Detection • Host-based – STIDE (Forrest et al. , 96): system calls, instance-based – (Lane & Brodley, 99): user commands, instance-based – ADMIT (Sequeira & Zaki, 02): user commands, clustering • Network-based – NIDES (SRI, 95): addresses and ports, probabilistic – SPADE (Silicon Defense, 01): addresses and ports, probabilistic – ADAM (Barbara et al. , 01): hybrid anomaly-misuse detection
LERAD: Learning Rules for Anomaly Detection (ICDM 03)
Probabilistic Models • Anomaly detection: – P(x | D No. Attacks) – Given training data with no attacks, estimate the probability of seeing event x – Easier if event x was observed during training • actually, since x is normal, we aren’t interested in its likelihood – Harder if event x was not observed (zero frequency problem) • we are interested in the likelihood of anomalies
Estimating Probability with Zero Frequency • r = number of unique values in an attribute in the training data • n = number of instances with the attribute in the training data • Likelihood of observing a novel value in an attribute is estimated by: p=r/n (Witten and Bell, 1991)
Anomaly Score • Likelihood of novel event = p • During detection, if a novel event (unobserved during training) actually occurs: – anomaly score = 1/p [surprise factor]
Example • Training Sequence 1 = a, b, c, d, e, b, f, g, c, h – P(Novel. Letter) = 8/10 – Z is observed during detection, anomaly score = 10/8 • Training Sequence 2 = a, a, b, b, b, a, a – P(Novel. Letter) = 2/10 – Z is observed during detection, anomaly score = 10/2
Nonstationary Model • More likely to see a novel value if novel values were seen recently (e. g. , during an attack) • During detection, record when the last novel value was observed • ti = number of seconds since the last novel value in attribute Ai • Anomaly score for Ai: Scorei = ti / pi • Anomaly score for an instance = Si Scorei
LEarning Rules for Anomaly Detection (LERAD) • PHAD uses prior probabilities: P(Z) • ALAD uses conditional probabilities: P(Z|A) • More accurate to learn probabilities that are conditioned on multiple attributes: P(Z|A, B, C…) • Combinatorial explosion • Fast algorithm based on sampling
Rules in LERAD • • If the antecedent is satisfied, the Z attribute has one of the values z 1, z 2, z 3… • Unlike association rules, our rules allow a set of values in the consequent • Unlike classification rules, our rules don’t require a fixed attribute as the consequent
Semantics of a Rule • • If the antecedent is satisfied but none of the values in the Z attribute is matched, the anomaly score is n/r (similar to PHAD/ALAD) • r = size of Z (# of unique values in Z) • n = # of tuples that satisfy the antecedent and have the Z attribute (support) •
Overview of the Algorithm • Randomly select pairs of tuples (packets, connections, …) from a sample of the training data • Create candidate rules based on each pair • Estimate the score of each candidate rule based on a sample of the training data • Prune the candidate rules • Update the consequent and calculate the score for each rule using the entire training set
Creating Candidate Rules • Find the matching attributes; for example, given this randomly selected pair of tuples: • <A=1, B=2, C=3, D=4> and <A=1, B=2, C=3, D=6> • Attributes A, B, and, C match • Create these rules: • A=1, B=2 => C=? • B=2, C=3 => A=? • A=1, C=3 => B=?
Estimating Rule Scores • Randomly pick a sample from the training set to estimate the score (n/r) for each rule • The consequent of each rule is now estimated • n/r=100/3 • n/r=10/2 • n/r=200/100 • The larger the score (n/r), the higher the confidence that the rule captures normal behavior
Pruning Candidate Rules • To reduce the amount of time for learning from the entire training set and during detection • High scoring rules: more confidence for top rules • Redundancy check: some rules are not necessary • Coverage check: minimum set of rules that describe the data
Redundancy Check • Rule 1: • Rule 2 is more general than Rule 1, which is redundant and can be removed • Rule 3: • Rule 2 and Rule 3 don’t overlap • Rule 4: • Rule 4 is more general than Rule 3, remove Rule 3
Coverage Check • A rule can cover multiple tuples, but a tuple can only be covered by one rule (highest-scoring rule). • Rules are checked in descending order of scores • For each rule in the candidate rule set – mark tuples that are covered by the rule • Rules that don’t cover any tuples are removed • Our coverage check includes the redundancy check
Final Training • The selected rules are trained on the entire training set: consequent and score are updated • n/r=100000/5 • n/r=4000/2 • 90% for training the rules • 10% for validating the rules: rules that cause false alarms are removed (being conservative--the remaining rules are highly predictive)
Scoring during Detection • Score for a matched rule that is violated S = t * n/r where t is the duration since the last time the rule was violated (anomaly occurred wrt the rule) • Anomaly score for the tuple = Si Si
Attributes Used in LERAD-tcp • TCP connections are reassembled (similar to ALAD) • Last 2 bytes of the destination IP address • 4 bytes of the source IP address • Source and destination ports • Duration (from the first packet to the last) • Length, TCP flags • First 8 strings in the payload (delimited by space/new line)
Attributes used in LERAD-all • Attributes used in LERAD-tcp • UDP and ICMP header fields
Experimental Data and Parameters • DARPA 99 data set • Training: Week 3; Testing: Weeks 4 & 5 • Training: 35 K tuples (LERAD-tcp); 69 K tuples (LERAD-all) • Testing: 178 K tuples (LERAD-tcp); 941 K tuples (LERAD-all) • 1, 000 pairs of tuples were sampled to form candidate rules (more didn’t help much) • 100 tuples were sampled to estimate scores for candidate rules (more didn’t help much)
Experimental Results • Average of 5 runs • 10 false alarms per day • 201 attacks; 74 “hard-to-detect” attacks (Lippmann, 2000) • LERAD-tcp: ~117 detections (58%); ~45 “hard-to -detect” (60%) • LERAD-all: ~112 detections (56%); ~41 “hard-todetect” (55%)
LERAD-all vs. LERAD-tcp Detections (10 FA/Day) PROBE LERAD-all only Both LERAD-tcp only 7 23 0 Do. S 10 30 8 R 2 L 0 30 5 U 2 R 0 10 10 Total 17 93 23
Experimental Time Statistics • Preprocessing: ~7. 5 minutes (2. 9 GB, training set), ~20 minutes (4 GB, test set) • LERAD-tcp: ~6 seconds (4 MB, training), ~17 seconds (17 MB, testing) • LERAD-all: ~12 seconds (8 MB, training), ~95 seconds (91 MB, testing) • 50 -75 learned final rules
Results from Mixed Data (RAID 03) • DARPA 99 data set: attacks are real, background is simulated • Compared with collected real data • Artifacts: smaller range of values, little “crud, ” values stop growing • Modified LERAD: 87 detections, 49 (56%) legitimate • Mixed data: 30 detections, 25 (83%) legitimate
CLAD: Clustering for Anomaly Detection (In Data Mining against Cyber Threats, Kumar et al. , 03)
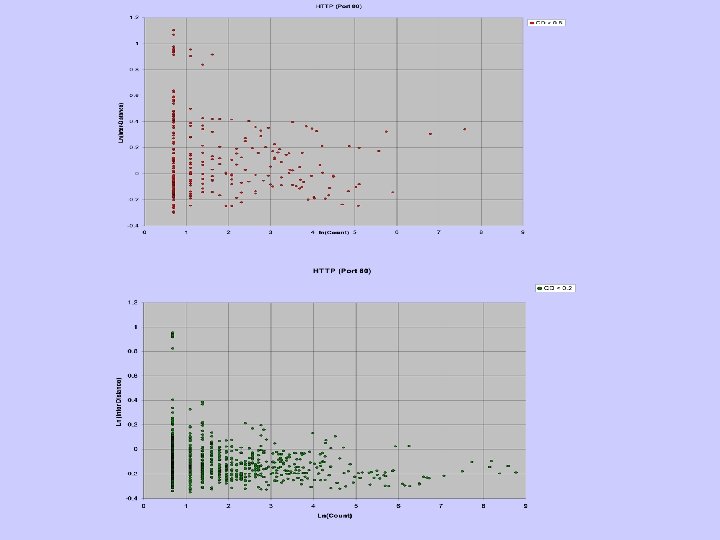
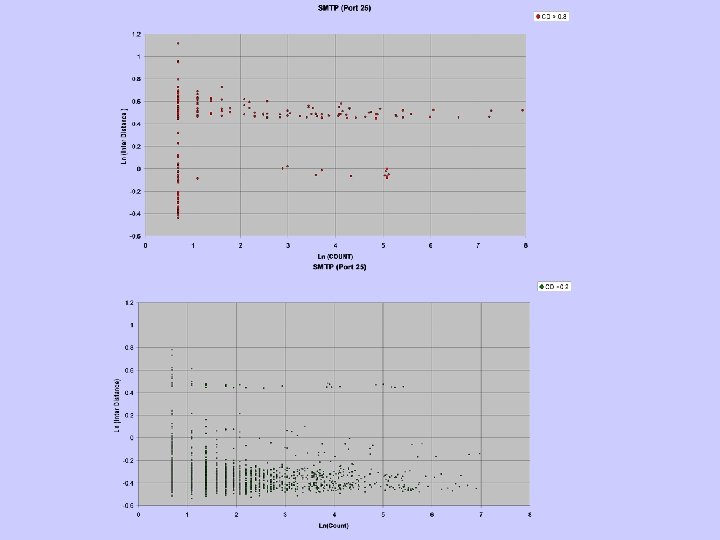
Finding Outliers • Cluster the data points • Outliers: points in far away and sparse clusters • Inter-cluster distance: average distance from the rest of the clusters • Density: number of data points in a fixedvolume cluster
CLAD • Simple efficient clustering algorithm (large amount of data) • Clusters with fixed radius • If a point is within the radius of an existing cluster – Add the point to the cluster • Else – The point becomes the centriod of a new cluster
CLAD Issues • Distance for discrete attributes – Values that are more frequent are likely to be more normal and are consider “closer” – Difference in frequency of discrete values • Power-law distributions: logarithm • Radius of clusters – Select a small random sample – Calculate the distance of all pairs – Average of the smallest 1%
Sparse and Dense Regions • Outliers are in distant and sparse regions • However, an attack might generate many connections and can make its neighborhood not sparse. • (distant and sparse) or (distant and dense) – Distant: distance > avg(distance) + sd(distance) – Sparse: density < avg(density) – sd(density) – Dense: density > avg(density) + sd(density)
Experiments • Weeks 1, 2, 4, and 5 • No explicit training-testing, looking for outliers • A model for each port • Ports with less than 1% traffic are lumped into the “Others” model • Anomaly scores are normalized in SD’s, the “Combined” model simply merges the scores from different models
Results Attack Type Attacks Detections (10 FA/Day) Probe 28 19 (70%) DOS 45 25 (55%) R 2 L 15 (37%) 41 U 2 R/Data 37 14 (38%) Total 151 74 (49%)
LERAD vs. CLAD LERAD CLAD Assume all training data are normal Training data can have unlabeled attacks Off-line algorithm On-line algorithm Concise and comprehensible models Harder to explain alerts Efficient detection Comparing large # of centroids
Ongoing Work • On-line, noise-tolerant LERAD • Applying LERAD to system calls, including arguments • Tokenizing payload to create features
Data Mining for Computer Security Workshop at ICDM 03 Melbourne, FL Nov 19, 2003 www. cs. fit. edu/~pkc/dmsec 03/
http: //www. cs. fit. edu/~pkc/id/ Thank you Questions?