Galaxy Clusters LSS 1 Clusters of Galaxies Clusters


 billion years ago the Universe was a")


, extended to southern hemisphere")

 Spatial distribution of galaxies:")


 nuclei")


")
")
")

")


")


")


 = -k.")


 by")


 One of the most common things to measure using X-ray")


 and galaxies (2 d. F)")


- Slides: 81
Galaxy Clusters & LSS 1
• • • Clusters of Galaxies: Clusters are systems a few Mpc across, typically containing at least 50 -100 luminous galaxies within the central 1 Mpc Clusters are gravitationally bound Clusters are filled with hot x-ray gas ~20% of galaxies live in clusters, most live in groups or in the “field” But it is hard to draw the line between group and cluster, ~50% of galaxies live in clusters or groups Clusters have higher densities than groups, contain a majority of E’s and S 0’s while groups are dominated by spirals
Coma, ~10, 000 galaxies
Modern Cosmology 13. 7 (+/– 0. 2) billion years ago the Universe was a very hot and dense soup of elementary particles and radiation. • • The Universe expanded and cooled. It underwent a brief period of inflation during which it expanded exponentially. • After 300, 000 years the Universe became optically-thin because it had cooled enough for electrons and protons to (re)combine. The microwave background dates from this time. • 90% of the matter in the Universe is in a form (dark matter) that interacts gravitationally but not electromagnetically.
Structure in the Universe Quantum fluctuations early in the Universe lead to some regions having higher densities than others. • • These differences increase since over-dense regions collapse faster under their own gravity than under-dense regions. The dark matter collapses faster than the baryons since the latter are restrained by interactions with photons. • At recombination these differences leave their imprint on the microwave background as observed by COBE, WMAP, … • After recombination, the dark matter over-densities continue to collapse and the baryons can now fall into the gravitational potential wells produced by the dark matter.
X-rays from Clusters of Galaxies The baryons thermalize to > 106 K making clusters strong X-ray sources. • • Most of the baryons in a cluster are in the X-ray emitting plasma - only 10 -20% are in the galaxies. Coma cluster mass (r < 1. 5 Mpc) Total X-ray emitting Plasma Galaxies 1. 3 x 10¹⁵ Mo 1. 3 x 10¹⁴ Mo 1. 4 x 10¹³ Mo 10% 1%
Clusters of Galaxies as Laboratories • Clusters of galaxies are self-gravitating accumulations of dark matter which have trapped hot plasma (intracluster medium - ICM) and galaxies. • If clusters are fair samples of the Universe (which they ought to be) then studying the contents of clusters can be a way of doing cosmology. • For example, the ratio of baryons to dark matter measured in clusters ought to be the same as that in the Universe as a whole. So, measuring this ratio in clusters provides an independent check on the results from eg WMAP
3000 Mpc long and 30 Mpc thick slice through z=0 simulation
Dark matter and X-ray emission simulation
Simulating the Universe • Computer simulations now follow the evolution of the dark matter and baryons by including • gravity • magnetic fields • heating by shocks • conduction • cooling • turbulent mixing • heating by radiation • Challenges are to include stellar formation, evolution, and death as well as the formation and effects of active galactic nuclei.
Coma cluster with XMM Briel et al. 2001
Optical image with X-ray isointensity contours
• Abell Catalog: Nearby clusters catalogued by Abell (1958), extended to southern hemisphere by Abell et al (1989) �By visual inspection of the POSS (& ESO) plates �Define region of radius 1. 5 h Mpc (Abell radius) �Count galaxies within R between with an apparent magnitude -1 A • • between m 3 and m 3 + 2 (where m 3 is the magnitude of the 3 rd brightest cluster member) Abell catalogued 4073 rich clusters (2712 in north) Richness class defined by number of galaxies with m < m 3 + 2 over background �Richness class 1 -2 -3 -4 correspond to N=50 -80 -130 -200 300, comprising 1224, 383, 68, and 6 clusters respectively in original catalogue �Note that 1030 clusters (of 2712) have N=30 -49 (richness class 0), catalogue is incomplete here
• Cluster classifications: Abell also classified clusters as: � Regular: ~circularly symmetrical w/ a central concentration, members are predominantly E/S 0’s (e. g. , Coma) � Irregular: ~less well defined structure, more spirals (e. g. , Hercules, Virgo) • Bautz-Morgan classification scheme (1970), based on brightest galaxy in cluster � I: Cluster has centrally located c. D galaxy � II: central galaxy is somewhere between a c. D and a giant elliptical galaxy (e. g. , Coma) � III: cluster has no dominant central galaxy • Oemler (1974) classified clusters by galaxy content � c. D clusters: 1 or two dominant c. D galaixes, E: S 0: S ~3: 4: 2 � Spiral rich: E: SO: S~1: 2: 3 (similar to the field) � Spiral poor: no dominant c. D, E: S 0: S~1: 4: 2
• • Cluster classifications: There are correlations (of course!) Spatial distribution of galaxies: �c. D clusters & regular clusters: spatial distribution is smooth and circularly symmetric, space density increases rapidly towards cluster centre �Spiral-rich and irregular clusters are not symmetric, little central concentration. Spatial density is ~ uniform �Spiral-poor clusters are intermediate • Morphological segregation: �In spiral-rich clusters, radial distribution of E, SO, and S galaxies is about the same �In c. D and spiral-poor clusters, relative space density of spirals decreases rapidly to cluster core (morphologydensity relation)
Cluster classifications: Property/Class Regular Intermediate Irregular Bautz-Morgan I, I-II, II II-III Content E/S 0 rich Spiral-poor Spiral-rich E: S 0: S ratio 3: 4: 2 1: 2: 3 Symmetry Spherical Intermediate Irregular Central concentration High Moderate Very little Examples Coma, A 2199 A 194, A 539 Virgo, A 228
Cluster classifications: • • What does it all mean? Regular, c. D clusters have had time to “relax” and reach dynamic equilibrium Intermediate and Irregular clusters are still in the process of coming together, have not yet reached dynamic equilibrium c. D galaxies have probably formed by merging in the central regions �Many show multiple nuclei, merging! �Show extended outer envelopes compared to luminous ellipticals, accrete additional material due to tidal stripping of other galaxies, or gas cooling onto the c. D
c. D galaxy with multiple (6!) nuclei
Surface brightness of a c. D galaxy
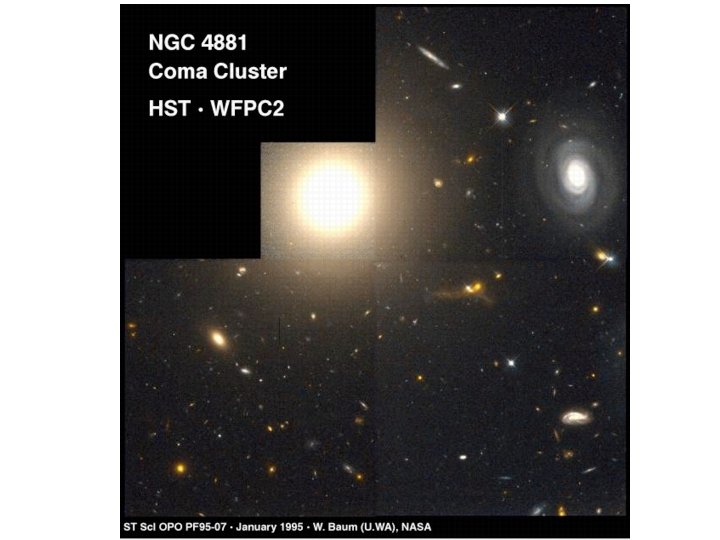
The Coma cluster: • • • Nearest, rich cluster of galaxies Distance = 90 Mpc Diameter = 4 -5° on the sky, 6 -8 Mpc >10, 000 galaxies!! �Mostly d. E’s �Of the bright galaxies, <10% spirals, rest are ellipticals or lenticulars (E/S 0 s) Roughly spherical in shape, probably virialized, 2 c. D galaxies in the centre
Coma, central portions
Coma, entire cluster
Coma w/ ROSAT
Coma w/ Chandra
Coma x-ray & optical
• • • The Virgo cluster: Irregular cluster Distance = 16 Mpc, closest cluster to us Diameter = 10° on the sky, 3 Mpc ~2000 galaxies, mostly dwarfs (d. E’s) Bright galaxies – 20% ellipticals, rest are spirals (Virgo is “spiral-rich”) �Ellipticals near center, spirals in outskirts �M 87 (c. D galaxy) in the center �Virgo is very clumpy w/ lots of substructure �Some parts of cluster may still be falling in, not virialized �Lots of hot, intracluster gas (x-ray) �Also many intracluster stars …
Virgo, ~2, 000 galaxies
Virgo Bingelli (1997)
Virgo Bingelli (1997)
Virgo Bingelli (1997)
Virgo, w/ROSAT
Bingelli (1988)
Perseus, ~400 galaxies From the SDSS
Hercules, <100 galaxies
• Morphology-Density Relation: First quantified by Alan Dressler in 1980 in his study of 6000 galaxies in 55 rich clusters and 15 field regions �Local projected galaxy density defined by area enclosing the • • nearest 10 galaxies brighter than MV < -21. 4 Later extended to poor groups Both regular & irregular clusters follow the SAME morphology-density relation �The key parameter is local density, not radius �Does environment affect galaxy formation? Do ellipticals only form in dense environments? �Or are spirals converted to ellipticals and S 0 s in dense environments? ? � Possible relevant physical processes include merging, ram pressure stripping, and galaxy harrasment (more on this later)
Morphology-Density Relation (Dressler 1980)
Measuring the masses of clusters: • • One way is to measure the velocities of galaxies in cluster Assuming the cluster is “virialized”, �½ PE + KE = 0 �KE = ∑ ½ m v = ½ M<v > = 3/2 Mσ �M = mass of cluster �σ = measured radial velocity dispersion �<v > = 3σ , why? ? ? �PE = -3/5 GM /<R>, for a uniform i i 2 2 spherical distribution �M = 5<R>σ 2 /G 2 2
Measuring the masses of clusters: • • • Zwicky was the first one to do this (in 1933!) for the Coma cluster, observing only 8 galaxies Found M> 5 × 10¹⁴ M Calculated mass-to-light ratio and determined that about 90% of the mass necessary to account for observed ratio was missing and therefore invisible, or "dark". But nobody believed him …
Virial masses of clusters: • Poor clusters �σ ~ 500 -800 km/s �D ~ 1 -3 Mpc �M ~ 10 h M 14 • -1 Rich clusters �σ > 800 km/s �D ~ a few Mpc �M ~ 10 h M �Mass to light ratio of the cluster ~ several hundred M 15 • -1 Even more dark matter! It’s everywhere …. /L
HI Gas Deficiency • • Evidence for stripping of gas in cluster spirals has been found from HI measurements Most deficient spirals are found in cluster cores (another environmental dependency) HI deficiency also correlates with X-ray luminosity (which correlates with cluster richness) It is the outer disks of the spirals that are missing
HI Deficiency in 3 clusters Giovanelli & Haynes 1985
HI Deficiency vs X-ray luminosity
Image courtesy of NRAO/AUI and Chung et al. , Columbia Minimum credit line: Image courtesy of NRAO/AUI and Chung et al. , Columbia University.
Butcher-Oemler Effect • • • In 1978, Butcher & Oemler found that the fraction of blue galaxies in two clusters at z=0. 4 was significantly higher than in Coma This was later extended to larger samples of clusters, and to higher redshifts Star formation is decreasing rapidly in clusters as a function of redshift (why? ? ) HST allowed us to push to higher redshifts and to study the morphologies of these high-redshift clusters Clusters are a great laboratory for studying galaxy evolution!!
Fraction of Blue galaxies redshift Butcher & Oemler (1984)
CL 0939 z=0. 41
CL 0939 z=0. 41
CL 0939 z=0. 41 RBS 797 z=0. 35
CL 1252 z=1. 24 Blakeslee et al. 2003 w/ACS
Text CL 1252 z=1. 24 Rosati et al. 2004
• Hot x-ray gas: As we have seen, clusters are full of hot x-ray gas �T ~ 10 – 108 K, emission is from free-free emission (as in groups, but hotter) 7 �In fact, many distant clusters are now being discovered via x-ray surveys (such as the ROSAT survey) �Temperatures are not uniform, we see patches of “hot spots” which are not obviously associated with galaxies. May have been heated as smaller galaxies (or clumps of galaxies) fell into the cluster �In densest regions, gas may cool and sink toward the cluster centre as a “cooling flow” �Unlikely that all of it has escaped from galaxies, some must be around from cluster formation process. It is heated via shocks as the gas falls into the cluster potential �But some metals, must be from stars in galaxies �X-ray luminosity correlates with cluster classification, regular clusters have high x-ray luminosity, irregular clusters have low x-ray luminosity
Basic properties • Total masses • X-ray luminosities 1014 — 1015 Mo 1043 — 1046 erg/s • Temperatures 106 — 108 K • Central densities 10– 2 • Extent several Mpc • L α T 3 X 10– 3 cm-3 — (10% ICM)
• • Masses of clusters from x-ray gas: We have: M(r) = -k. T/μm. HG (dlnρ /dlnr) r So if we know dlnρ /dlnr, we can measure the mass distribution of cluster If the cluster is spherically symmetric this can be derived from x-ray intensity and spectral observations For Virgo, �Find M(r<1. 8 Mpc)~1. 5 – 5. 5 x 10 M �But the gaseous mass (from x-ray luminosity) is only ~ 4 – 5. 5 x 14 1013 M �Typical cluster masses: �Total: 5 x 10 M to 5 x 10 � Luminous mass: ~5% � Gaseous mass: 10 -30% � Dark matter: 60 -85% !!!!! 14 15 M
Masses of clusters from x-ray gas: • If we assume the cluster is in hydrostatic equilibrium, �d. P/dr = -(GM(r)/r )ρ , ρ =density of the gas, P=pressure �From the ideal gas law: P= (ρ /μm )k. T , μ= mean molecular 2 H weight (~0. 6 for an ionized plasma), m. H = mass of the hydrogen atom, k=Boltzman constant �So, d. P/dr = (k/μm )(T dρ /dr + ρ d. T/dr) = -(GM(r)/r )ρ �(k. Tρ /μm )(r/ρ dρ /dr + r/T d. T/dr) = -(GM(r)/r )ρ x r �k. T/μm G (dlnρ /dlnr + dln. T/dlnr) = -M(r)/ r �And finally, M(r) = -k. T/μm G (dlnρ /dlnr + dln. T/dlnr) r �If the gas is isothermal, dln. T/dln. R = 0, so �M(r) = -k. T/μm G (dlnρ /dlnr) r 2 H H H H
Luminosity temperature relation from ASCA observations Mushotzky 2004 based on Horner 2001
Relation to optical properties • The X-ray temperature is linearly correlated with the velocity dispersion of the galaxies. • Clusters with a central, large galaxy (c. D) have X-ray emission sharply peaked on the location of the galaxy. • More luminous clusters have more galaxies with a smaller fraction of spirals. • More luminous clusters have a larger proportion of their baryons in the X-ray emitting plasma.
Finding clusters • Clusters of galaxies were first identified (in the 1930 s) by looking for groupings of galaxies on photographic plates. • Modern optical surveys (using eg SDSS data) combine colour and spectroscopic redshifts to identify clusters. • In the X-ray clusters are easy to find - just look for extended sources outside the Galactic plane. Follow-up optical spectroscopy then supplies the redshift.
What we try to measure in X-rays From the spectrum we can measure a mean temperature, a redshift, and abundances of the most common elements (heavier than He). • • With good S/N we can extract a spectrum from several positions in the cluster and measure the spatial distribution of temperatures and abundances. • Surface brightness maps can be used to deduce the ICM density and look for sharp features such as shocks and “cold fronts”.
Temperature and abundance profiles for PKS 0745
Isothermal models It is often assumed that the cluster gravitational potential is a self-gravitating isothermal sphere. A useful analytic approximation due to King gives the total density as : ρ (r) = ρ (1 + (r/r )2)– 3/2 0 c If the ICM is itself isothermal and sitting in this potential then the density of the ICM follows the law : ρ (r) = ρ ICM (1 + (r/r )2)– 3β/2 ICM, 0 c β = ∝m σ /k. T p 2 ICM
Surface brightness profile If we now calculate the expected X-ray emission from this density profile and then project onto the sky to get surface brightness with angle from the center of the cluster we predict : S(θ ) = S (1 + (θ /θ )2 )– 3β+1/2 0 c This works remarkably well outside the core regions of the cluster.
Surface brightness profiles from ROSAT Neumann & Arnaud 1999
The gravitating mass (again!) One of the most common things to measure using X-ray observations of clusters is the total gravitating mass (ie including the dark matter). We can do this because the ICM is in hydrostatic equilibrium. So, at every radius the gravitational force must be balanced by pressure : ∇P = –ρ ∇φ ICM Assuming spherical symmetry and the perfect gas law gives : M(<r) = –(k. Tr/Gmpu) (d ln ne/d ln r + d ln T/d ln r)
The gravitating mass II Thus if we can measure the temperature and density at different positions then we can derive the gravitational potential and hence the amount and distribution of the dark matter. There are two other ways to get the gravitational potential : • The galaxies act as test particles moving in the potential so their redshift distribution provides a measure of total mass. • The gravitational potential acts as a lens on light from background galaxies.
Top Questions on Clusters of Galaxies Can we derive accurate and unbiassed masses from simple observables such as luminosity and temperature ? • • Does the gravitational potential have the same shape as the baryons (stars and gas) ? • What is happening in the centers of clusters - how does the radio galaxy and the ICM interact ? • What is the origin of the metals in the ICM and when were they injected ? • What is the origin of the entropy of the ICM ?
Why do we care ? Cosmological simulations predict distributions of masses. If we have enough data to measure temperatures at several radii in the cluster then we can estimate the mass. For many clusters, especially those at high redshift, we will not have enough data to do this. If we want to use large X-ray selected samples of clusters of galaxies to measure cosmological parameters then we must be able to relate simple observables (e. g. X-ray luminosity and temperature) to theoretical masses.
Cosmology with Clusters
Mass-Temperature relation Red points are higher redshift clusters. Jones et al. 2004
Clusters as cosmology test particles Clusters of galaxies are formed from the extreme high end (“high sigma peaks”) of the initial fluctuation spectrum. They exist at the intersections of the Cosmic Web. • The way that structure evolves depends on the geometry and contents of the Universe (total density, dark matter density, dark energy density, …). • • Because clusters are formed from the high sigma peaks their numbers and evolution in time depend sensitively on cosmological parameters.
Galaxy Survey COSPAR Workshop, Durban 2004
Cluster Survey COSPAR Workshop, Durban 2004
Guzzo LCDM SCDM Power spectrum from X-ray clusters (REFLEX) and galaxies (2 d. F)
Dark Matter in Clusters Ever since the work of Zwicky in the 1930 s we have known that there is apparently more gravitating mass in clusters than we observe from the light. The standard solution is that there is non-baryonic “dark matter” which interacts gravitationally but not electromagnetically. There a number of theoretical proposals for what this dark matter might be — axions, WIMPs, … but none have been detected in the laboratory. A few people have suggested that gravity is not 1/r 2 on large distances and that no dark matter is required.
Using mergers to test dark matter An alternative method has been proposed by Markevitch. In a merger of the two clusters their dark matter cores will pass through each other but the ICM will interact. The gravitational potential will thus be offset from the ICM. In the opposing picture, where there is no dark matter, the gravitational potential must follow the ICM (which in this case is the dominant source of the gravitational potential).
Chandra image of 1 E 0657 -56 “Bullet” COSPAR Workshop, Durban 2004
Lensing mass contours on optical image. Lensing mass contours on Chandra image. Markevitch et al. 2004
89
Origin of Entropy in the ICM The entropy of the ICM measures the importance of nongravitational effects. These include heating due to supernovae or quasars, pre-heating of the IGM at high redshift, and radiative cooling. These are all major uncertainties in galaxy formation models. The ICM preserves the information on these processes which occurred at higher redshifts. Understanding entropy in groups and clusters will provide clues to the formation mechanisms for most of the stars in the Universe.
If cluster evolution depended only on gravity then clusters would be self-similar with L α T 2. The observed steeper law means that extra entropy is added and has a larger effect on less massive clusters and groups. X The observed L α T 3 relation can be explained by accretion of high entropy gas at moderate to high redshifts, heating of gas inside the potential well, or cooling which removes gas from the ICM. The latter preferentially removes cooler gas hence raises the mean temperature of that remaining. X
L α T 2 L α T 3 Luminosity temperature relation from ASCA observations Mushotzky 2004 based on Horner 2001