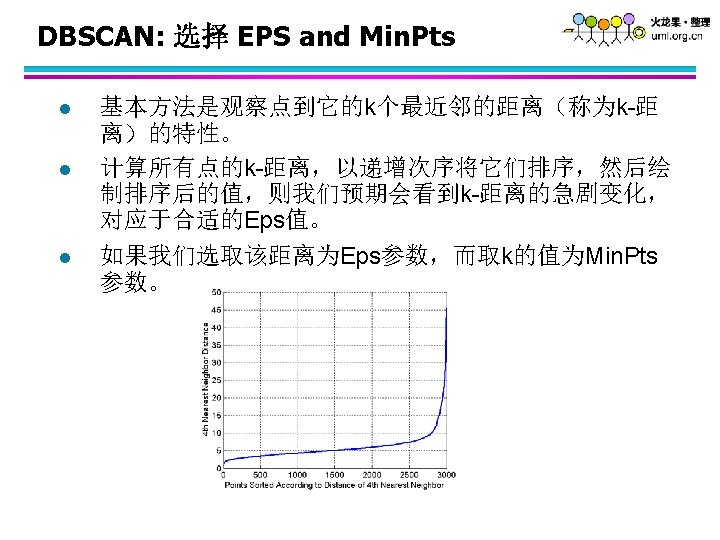
How many clusters Six Clusters Two Clusters Four

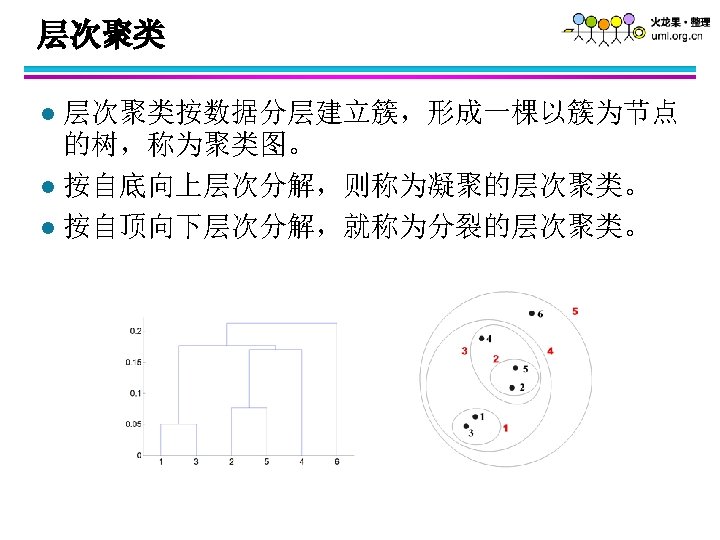
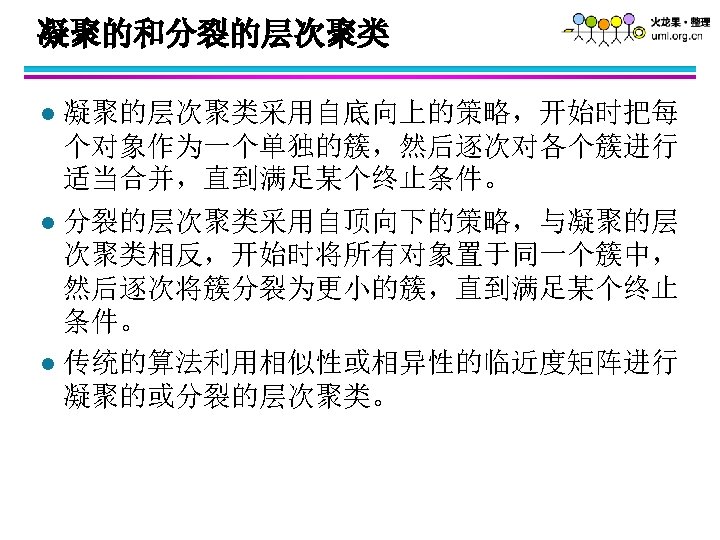
 层次聚类(Hierarchical Clustering) 互斥(重叠)聚类(exclusive clustering) 非互斥聚类(non-exclusive) 模糊聚类(fuzzy clustering)")

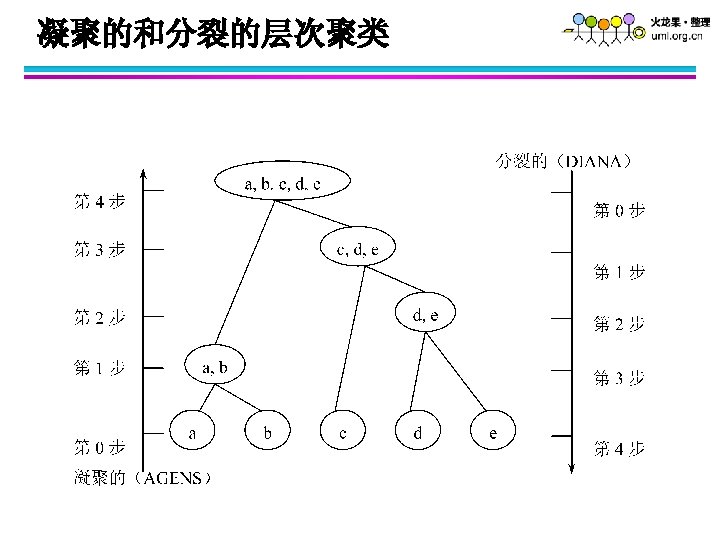
 l 层次聚类是嵌套簇的集族,组织成一棵树。 Traditional Hierarchical Clustering Non-traditional Hierarchical Clustering Traditional Dendrogram Non-traditional Dendrogram")


")
")
")


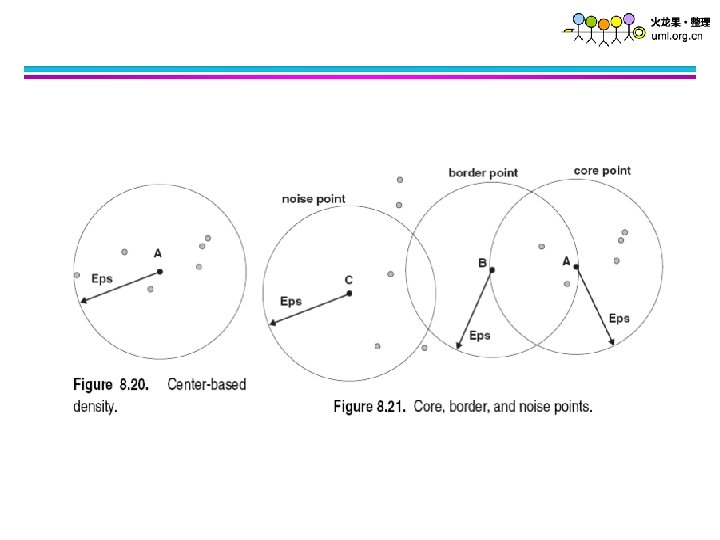

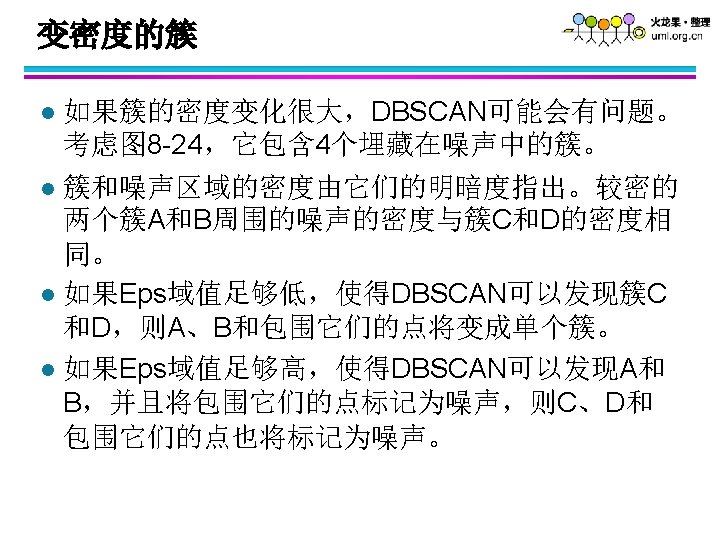
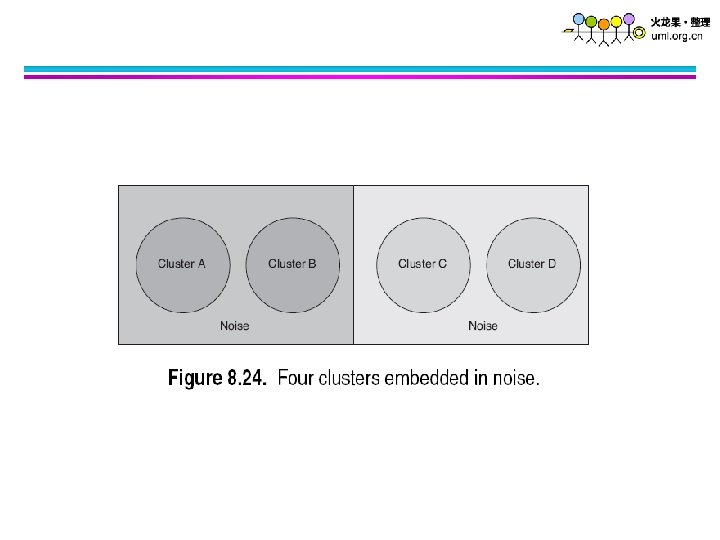
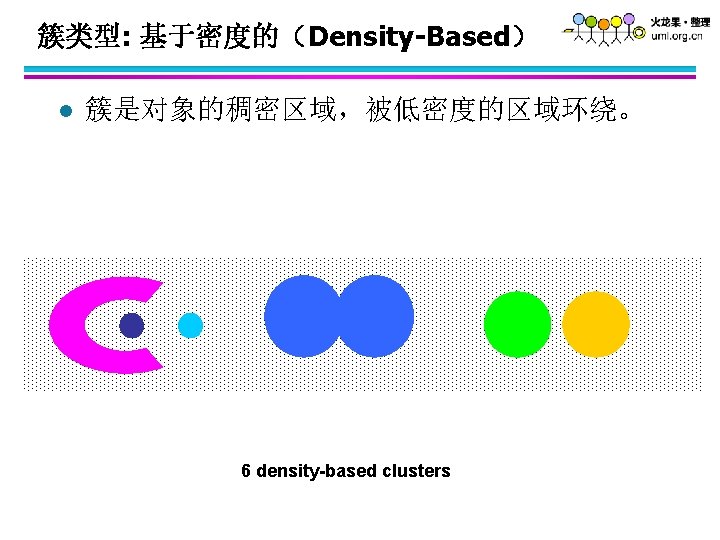
. Original Points • Varying densities • High-dimensional data (Min. Pts=4,")


- Slides: 84
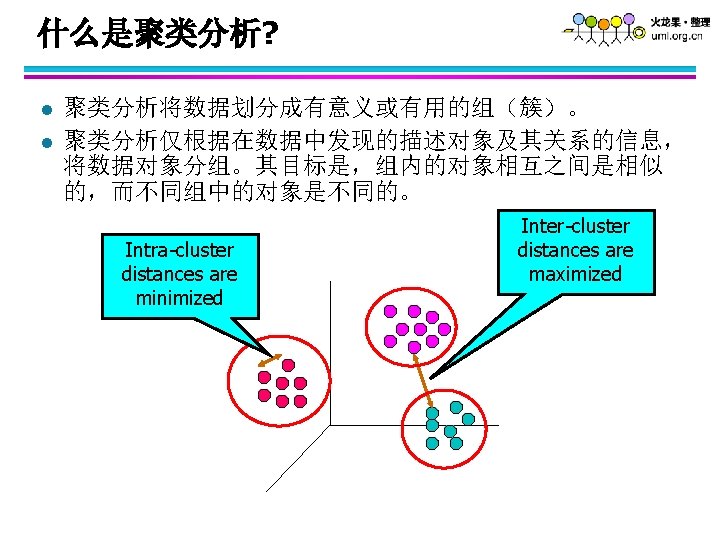
聚类的复杂性 How many clusters? Six Clusters Two Clusters Four Clusters
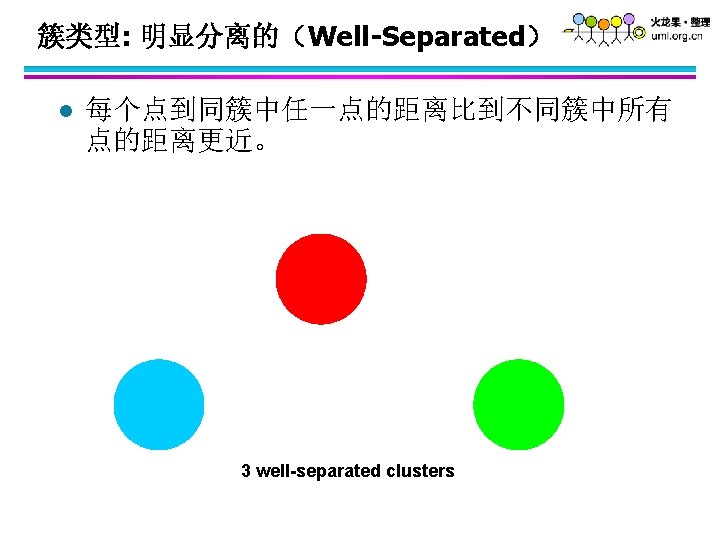
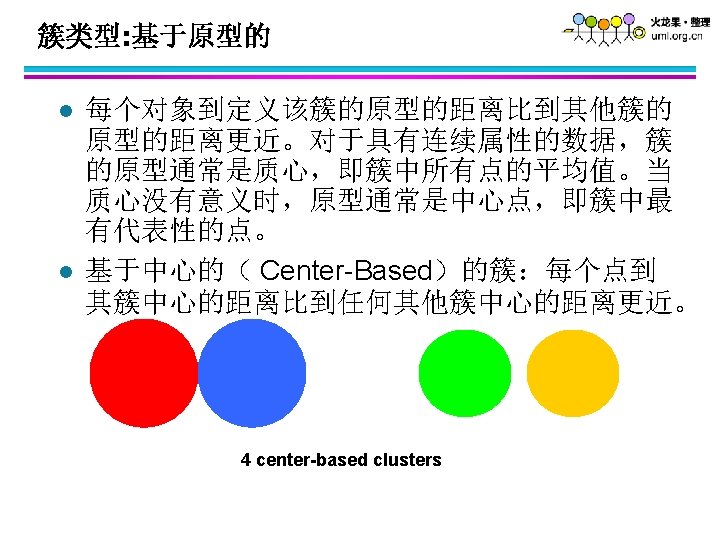
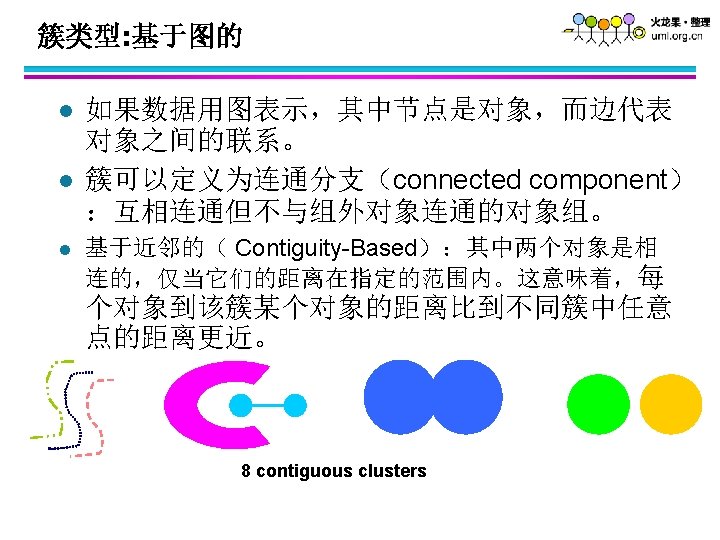
不同的聚类类型 l l l l 划分聚类(Partitional Clustering) 层次聚类(Hierarchical Clustering) 互斥(重叠)聚类(exclusive clustering) 非互斥聚类(non-exclusive) 模糊聚类(fuzzy clustering) 完全聚类(complete clustering) 部分聚类(partial clustering)
层次聚类(Hierarchical Clustering) l 层次聚类是嵌套簇的集族,组织成一棵树。 Traditional Hierarchical Clustering Non-traditional Hierarchical Clustering Traditional Dendrogram Non-traditional Dendrogram
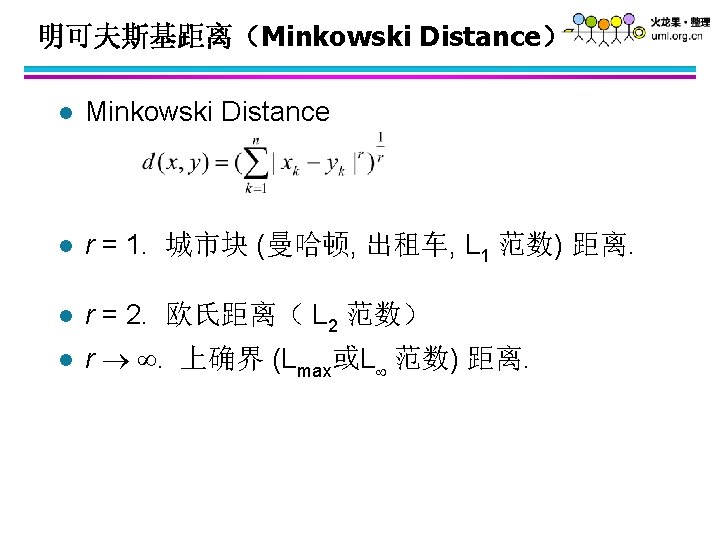
数据对象之间的相异度 l Euclidean Distance
余弦相似度 l If d 1 and d 2 are two document vectors, then cos( x, y ) = (x y) / ||x|| ||y|| , l Example: x= 3205000200 y= 1000000102 x y= 3*1 + 2*0 + 0*0 + 5*0 + 0*0 + 2*1 + 0*0 + 0*2 = 5 ||x|| = (3*3+2*2+0*0+5*5+0*0+0*0+2*2+0*0)0. 5 = (42) 0. 5 = 6. 481 ||y|| = (1*1+0*0+0*0+0*0+1*1+0*0+2*2) 0. 5 = (6) 0. 5 = 2. 245 cos( d 1, d 2 ) = 0. 3150
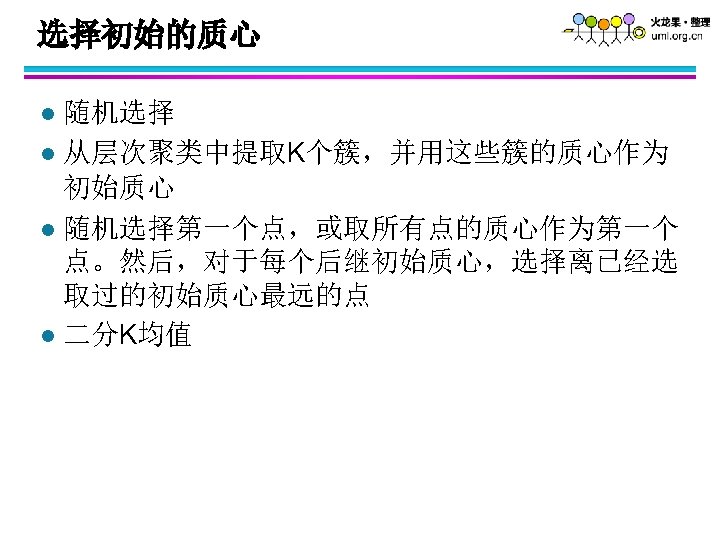
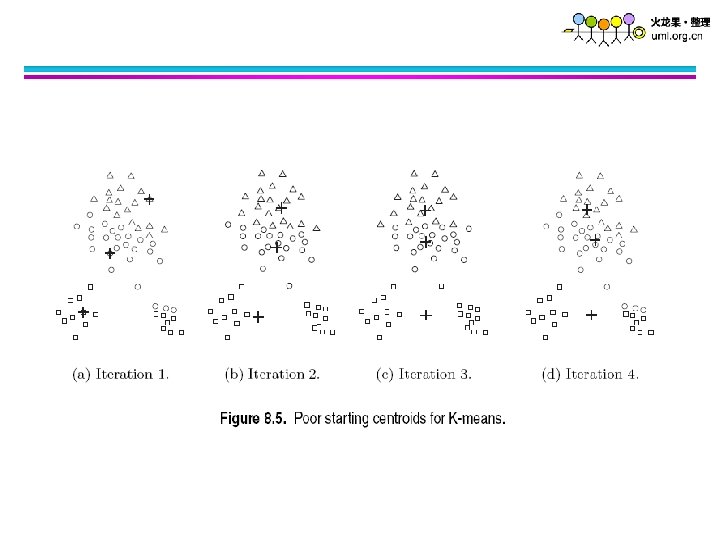
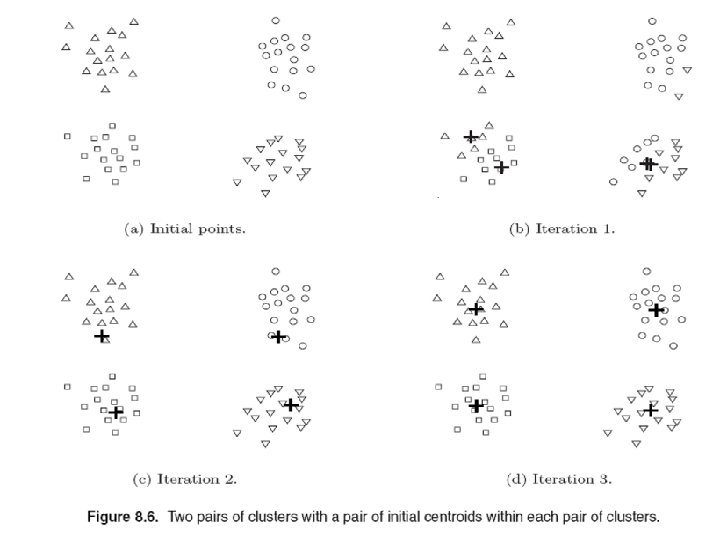
K-means 的局限性 l K-means has problems when clusters are of differing – Sizes大小 – Densities密度 – Non-globular shapes非球形
Limitations of K-means: Differing Sizes Original Points K-means (3 Clusters)
Limitations of K-means: Differing Density Original Points K-means (3 Clusters)
Limitations of K-means: Non-globular Shapes Original Points K-means (2 Clusters)
K-means 局限性的克服 Original Points K-means Clusters One solution is to use many clusters. Find parts of clusters, but need to put together.
Overcoming K-means Limitations Original Points K-means Clusters
Overcoming K-means Limitations Original Points K-means Clusters
起始步骤 l Start with clusters of individual points and a proximity matrix p 1 p 2 p 3 p 4 p 5. . . Proximity Matrix . . .
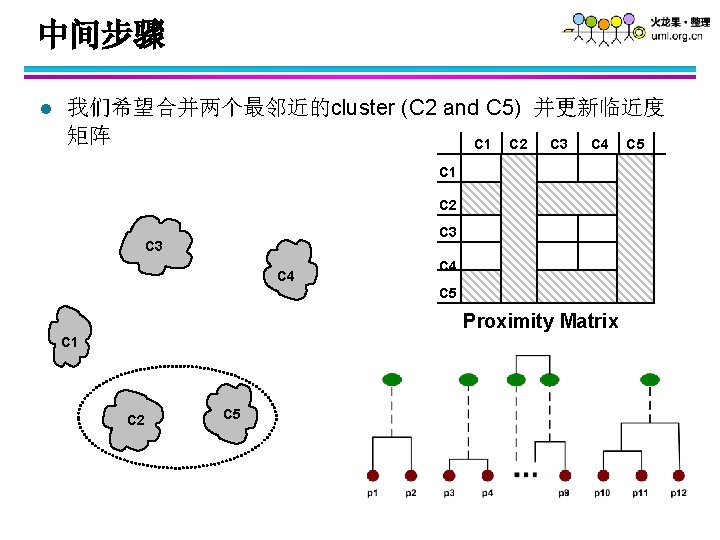
中间步骤 l 经过部分融合之后 ,我们得到一些cluster C 1 C 2 C 3 C 4 C 5 Proximity Matrix C 1 C 2 C 5
最终合并 l 如何更新临近度矩阵? C 1 C 2 U C 5 C 3 C 4 ? ? ? C 3 ? C 4 ? Proximity Matrix C 1 C 2 U C 5
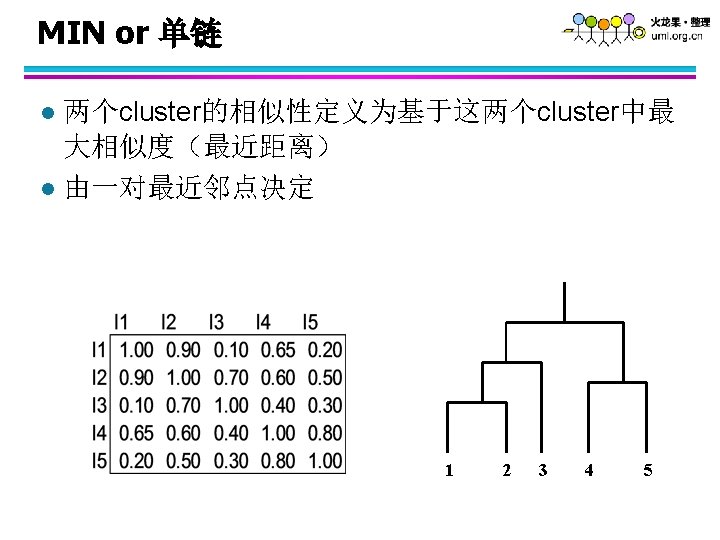
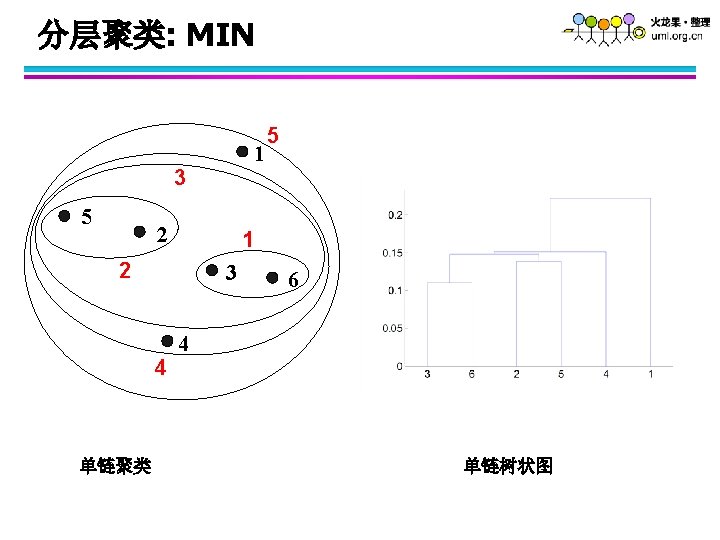
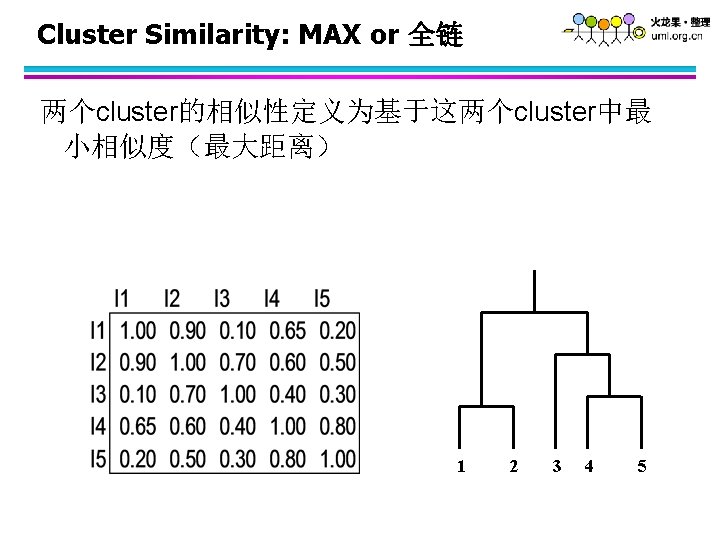
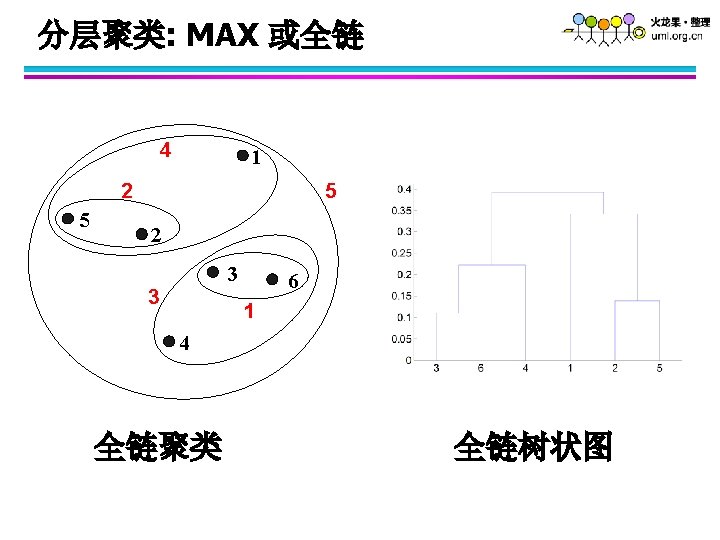
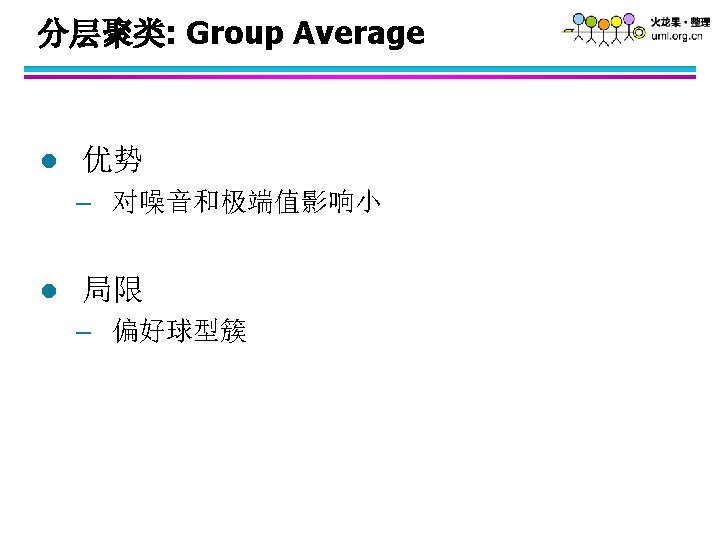
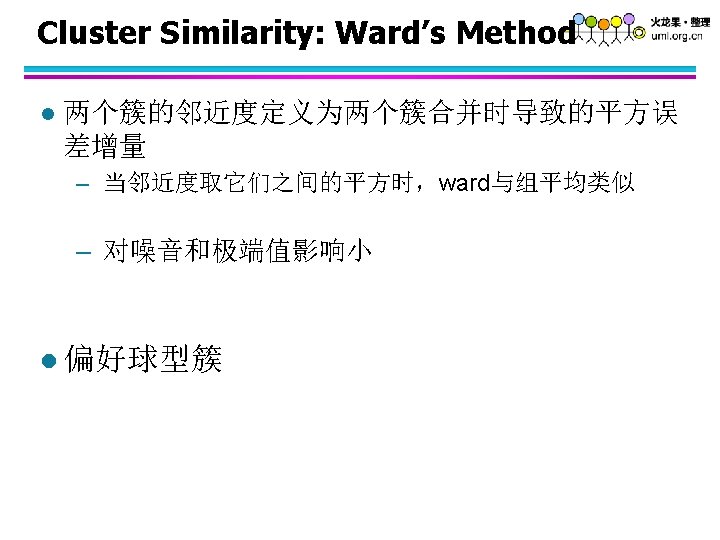
如何定义cluster间的相似性 p 1 Similarity? p 2 p 3 p 4 p 5 p 1 p 2 p 3 p 4 l l l p 5 MIN. MAX. Group Average. Proximity Matrix Distance Between Centroids Other methods driven by an objective function – Ward’s Method uses squared error . . .
如何定义cluster间的相似性 p 1 p 2 p 3 p 4 p 5 p 1 p 2 p 3 p 4 l l l p 5 MIN. MAX. Group Average. Proximity Matrix Distance Between Centroids Other methods driven by an objective function – Ward’s Method uses squared error . . .
如何定义cluster间的相似性 p 1 p 2 p 3 p 4 p 5 p 1 p 2 p 3 p 4 l l l p 5 MIN. MAX. Group Average. Proximity Matrix Distance Between Centroids Other methods driven by an objective function – Ward’s Method uses squared error . . .
如何定义cluster间的相似性 p 1 p 2 p 3 p 4 p 5 p 1 p 2 p 3 p 4 l l l p 5 MIN. MAX. Group Average. Proximity Matrix Distance Between Centroids Other methods driven by an objective function – Ward’s Method uses squared error . . .
如何定义cluster间的相似性 p 1 p 2 p 3 p 4 p 5 p 1 p 2 p 3 p 4 l l l MIN MAX Group Average Distance Between Centroids 其它方法 – Ward’s Method 利用平方误差增量 p 5 . . . Proximity Matrix . . .
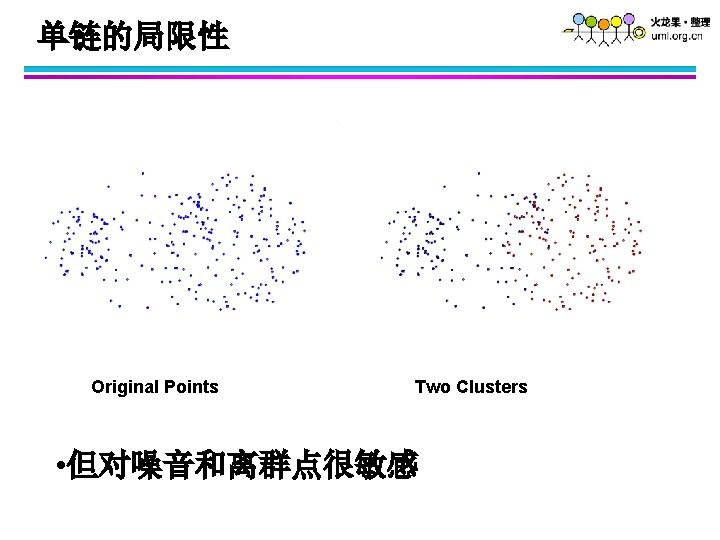
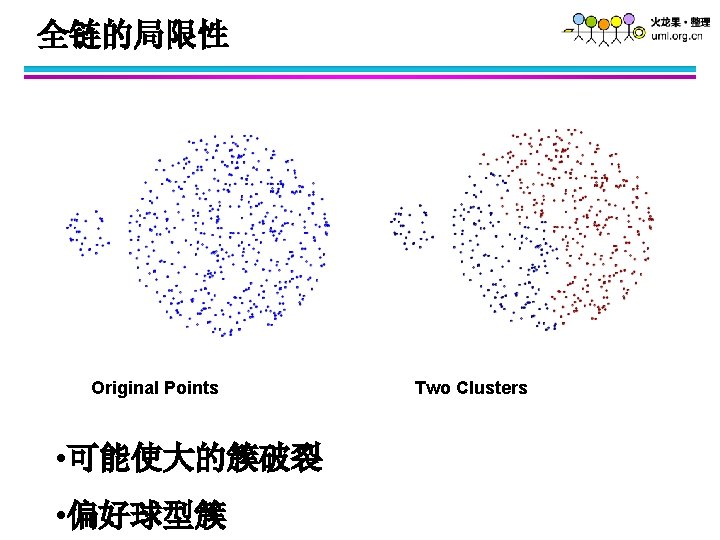
全链的优势 Original Points • 对噪音和离群不敏感 Two Clusters
分层聚类: Group Average 5 4 1 2 5 2 3 6 1 4 3 Nested Clusters Dendrogram
Hierarchical Clustering: Comparison 1 3 5 5 1 2 3 6 MIN MAX 5 2 5 1 5 Ward’s Method 3 6 4 1 2 5 2 Group Average 3 1 4 6 4 2 3 3 3 2 4 5 4 1 5 1 2 2 4 4 6 1 4 3
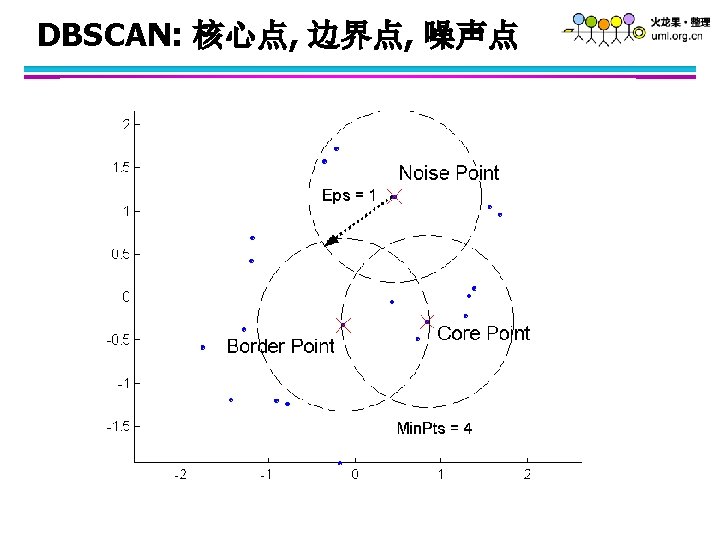
Original Points Point types: core, border and noise Eps = 10, Min. Pts = 4
(Min. Pts=4, Eps=9. 75). Original Points • Varying densities • High-dimensional data (Min. Pts=4, Eps=9. 92)
簇评估 如何评估聚类结果的好坏? l 为什么要评估聚类? l – – To avoid finding patterns in noise To compare clustering algorithms To compare two sets of clusters To compare two clusters
随机数据的聚类结果 Random Points K-means DBSCAN Complete Link
Measuring Cluster Validity Via Correlation l Correlation of incidence and proximity matrices for the K-means clusterings of the following two data sets. Corr = -0. 9235 Corr = -0. 5810
Using Similarity Matrix for Cluster Validation l Order the similarity matrix with respect to cluster labels and inspect visually.
Using Similarity Matrix for Cluster Validation Clusters in random data are not so crisp DBSCAN
Using Similarity Matrix for Cluster Validation l Clusters in random data are not so crisp K-means
Using Similarity Matrix for Cluster Validation l Clusters in random data are not so crisp Complete Link
Using Similarity Matrix for Cluster Validation DBSCAN
Internal Measures: SSE l SSE is good for comparing two clusterings or two clusters (average SSE). l Can also be used to estimate the number of clusters
对于 SSE的显著性 l Example – Compare SSE of 0. 005 against three clusters in random data – Histogram shows SSE of three clusters in 500 sets of random data points of size 100 distributed over the range 0. 2 – 0. 8 for x and y values