Hierarchy and Reusability in Image Analysis Stuart Geman

Hierarchy and Reusability in Image Analysis Stuart Geman Eran Borenstein, Ya Jin, Wei Zhang

I. Remarks on Computer Vision II. Approaches III. Bayesian Image Analysis IV. Probability Models V. Demonstration System: Reading License Plates VI. Generalization: Face Detection

I. II. Remarks on Computer Vision • Vision is hard • Why is vision hard? Approaches III. Bayesian Image Analysis IV. Probability Models V. Demonstration System: Reading License Plates VI. Generalization: Face Detection

License plate images from Logan Airport Machines still can’t reliably read license plates

Wafer ID’s Machines can’t read fixed-font fixed-scale characters as well as humans

Super Bowl Machines can’t find the bad guys at the Super Bowl

Instantiation same Empire style table twins Vision is content sensitive

“Clutter” Human Interactive Proofs Background is structured, and made of the same stuff!

I. Remarks on Computer Vision II. Approaches • Pure learning • Fodor & Pylyshyun, 1988, and the critique of neural networks • Observations from the cognitive, neural, and mathematical sciences III. Bayesian Image Analysis IV. Probability Models V. Demonstration System: Reading License Plates VI. Generalization: Face Detection

Pure learning Google: • 2 billion images • train classifier: pornographic/not pornographic • good classification • not nearly as good as human performance

Pure learning Human learning: • 1 sample/10 seconds • 16 hours/day • 80 years • < 170 million samples/lifetime Enough examples? Did evolution have enough examples? D. Geman: “The interesting limit is N goes to zero, not N goes to infinity”

Fodor & Pylyshyun, 1988, and the critique of neural networks Properties of human cognition: * compositionality roughly: representation through syntactically constrained hierarchy of reusable parts * productivity roughly: capable of an infinite number of wellformed actions, thoughts, sentences … * systematicity roughly: invariance

Fodor & Pylyshyun, 1988, and the critique of neural networks If systematicity if ‘the boy ran home’ is a triangle, then so are makes sense, then so does ‘the girl ran home’ ‘john ran to school’ 4 4 4 4

Observations from the cognitive, neural, and mathematical sciences Human brains utilize strong representations • Damassio (simulation=perception) • Kosslyn (“resolution of the imaging debate”) • Lakeoff, Fauconnier (the role of mental imagery in language understanding)

Observations from the cognitive, neural, and mathematical sciences Consider the ventral visual pathway: Structure: retina LGN V 1 V 2 V 4 IT Topography: highly retinotopic Receptive Field: small large Specificity: low high Invariance: low high little topology SUMMARY: A hierarchy of less-to-more invariant representations

Observations from the cognitive, neural, and mathematical sciences Thought experiment: what if the world is a hierarchy of reusable parts? Problem: test for ‘L’
: impossible")
Observations from the cognitive, neural, and mathematical sciences God’s ROC curve (Neyman-Pearson Lemma): impossible in practice…
:")
Observations from the cognitive, neural, and mathematical sciences Testing against a universal null (pragmatic):

Observations from the cognitive, neural, and mathematical sciences Testing “parts” against “wholes”:

Observations from the cognitive, neural, and mathematical sciences 1. 00 God’s ROC probability of detection 0. 99 0. 98 parts against wholes 0. 97 universal null 0. 96 0. 95 0. 94 0. 0 0. 2 0. 4 0. 6 0. 8 probability of false alarm 1. 0 ROCs

Observations from the cognitive, neural, and mathematical sciences Theorem (S. Geman, Y. Jin, W. Zhang) At any fixed probability of detection (`type I error’): & various generalizations… Take Home Message: in a compositional world • background confusions occur at subsets of objects • objects come equipped with their own background models

I. Remarks on Computer Vision II. Approaches III. Bayesian Image Analysis 1. Overview 2. Interpretations IV. Probability Models V. Demonstration System: Reading License Plates VI. Generalization: Face Detection

Bayesian image analysis - overview Given an image Y: find a ‘good’ interpretation I using P(I|Y)

Interpretations: built from hierarchies of reusable parts e. g. animals, trees, rocks “Bricks” e. g. contours, intermediate objects e. g. linelets, curvelets, Tjunctions e. g. discontinuities, gradient

Hierarchy of Disjunctions of Conjunctions

Hierarchy of Disjunctions of Conjunctions

Hierarchy of Disjunctions of Conjunctions

Hierarchy of Disjunctions of Conjunctions

Hierarchy of Disjunctions of Conjunctions

Hierarchy of Disjunctions of Conjunctions

Hierarchy of Disjunctions of Conjunctions

Interpretations Interpretation selected complete subgraph

Interpretations Interpretation selected complete subgraph

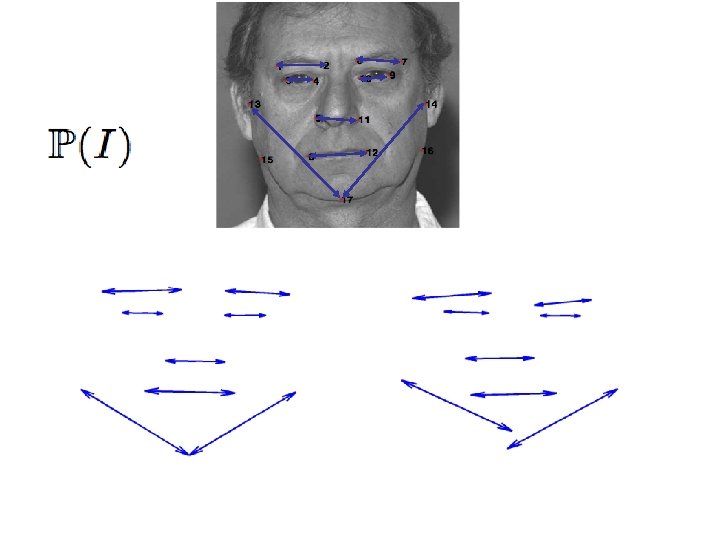
I. Remarks on Computer Vision II. Approaches III. Bayesian Image Analysis IV. Probability Models 1. P(I) 2. P(Y|I) V. Demonstration System: Reading License Plates VI. Generalization: Face Detection

Probability modeling

Architecture Every brick is • off, or • on, and selects a set of children Bricks Image

Image interpretation: a complete subgraph Bricks Image

Notation Bricks B Image

Markov backbone Bricks B Image

Markov backbone Is this sufficiently constrained? Bricks B Image

Beyond Markovian distributions Compositions depend on instantiations…e. g. the positioning of parts ?

Compositional distribution – a perturbed Markov model Bricks B Image

Content-Sensitive Perturbation

Content-Sensitive Perturbation

Content-Sensitive Perturbation …. but perturbations interact! …. nevertheless …

Probability modeling
 patch locations template pixels Interpretation sufficiency assumption extend to overlap iid")
Data Model (overview) patch locations template pixels Interpretation sufficiency assumption extend to overlap iid “background”

Select a terminal brick
 pixels covered by")
Select a state (e. g. left-eye brick) pixels covered by

Model Template – one for each state of brick Image data Assume C = Corr( , -1 ) sufficient: +1
 and the Central Limit Theorem …intractable? Then, exactly, if CLT Hence")
N(C) and the Central Limit Theorem …intractable? Then, exactly, if CLT Hence

Example: sampling when = eye patch

Example: sampling when = mouth patch
")
Example: learning a mixture of 16 eye patches from 500 faces (using EM)
")
Example: learning a mixture of 16 eye patches from 500 faces (using EM)

Example: learning a mixture of 16 nose and mouth patches from 500 faces (using EM)

Example: learning a mixture of 16 nose and mouth patches from 500 faces (using EM)

I. Remarks on Computer Vision II. Approaches III. Bayesian Image Analysis IV. Probability Models V. Demonstration System: Reading License Plates VI. Generalization: Face Detection

Test set: 385 images, mostly from Logan Airport Courtesy of Visics Corporation

Architecture license plates license numbers (3 digits + 3 letters, 4 digits + 2 letters) plate boundaries, strings (2 letters, 3 digits, 3 letters, 4 digits) generic letter, generic number, L-junctions of sides characters, plate sides parts of characters, parts of plate sides

Image interpretation Original Image Top 10 objects Top object Top 25 objects

Image interpretation Test image Top objects
 • Approx. 99.")
Performance • 385 images • Six plates read with mistakes (>98%) • Approx. 99. 5% characters read correctly • Zero false positives

Efficient discrimination: Markov versus Content-Sensitive dist. Sample 4 -digit string Markov backbone Perturbed distribution

Efficient discrimination: Markov versus Content-Sensitive dist. Original image Top object under Markov distribution Zoomed license region Top object under content-sensitive distribution

Efficient discrimination: testing objects against their parts Test image 9 active “ 8” bricks under whole model 1 active “ 8” brick under parts model

Summary Vision is Content Sensitive Non-Markovian probability models Background is Structured, and Made of the Same Stuff Objects come equipped with their own background models

I. Remarks on Computer Vision II. Approaches III. Bayesian Image Analysis IV. Probability Models V. Demonstration System: Reading License Plates VI. Generalization: Face Detection

Face Hierarchy

Sampling faces from the distribution

PATTERN SYNTHESIS = PATTERN ANALYSIS Ulf Grenander

Efficient computation: depth-first search X Bricks X X Image

Efficient computation: depth-first search Test image Top objects Number of visits to each pixel. Left: linear scale Right: log scale

Efficient computation: depth-first search Test image Top objects Number of visits to each pixel. Left: linear scale Right: log scale
- Slides: 75