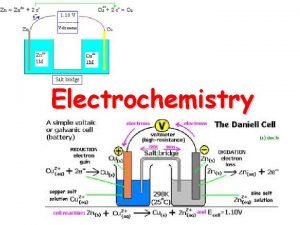
Electrochemistry MAE212 Dr Marc Madou UCI Winter 2017
- Slides: 70
Electrochemistry MAE-212 Dr. Marc Madou, UCI, Winter 2017 Class VIII Corrosion
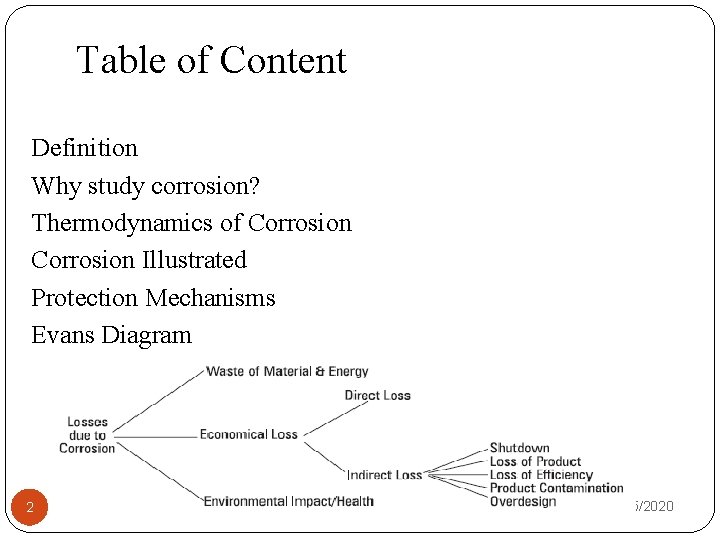
Table of Content Definition Why study corrosion? Thermodynamics of Corrosion Illustrated Protection Mechanisms Evans Diagram 2 11/25/2020
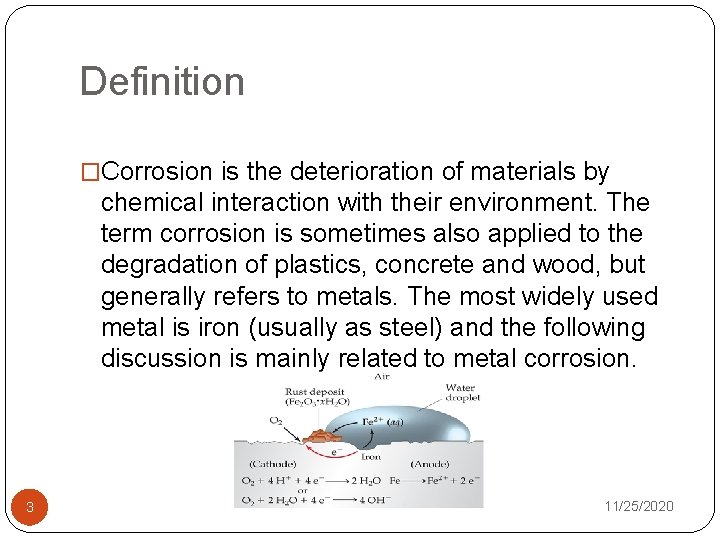
Definition �Corrosion is the deterioration of materials by chemical interaction with their environment. The term corrosion is sometimes also applied to the degradation of plastics, concrete and wood, but generally refers to metals. The most widely used metal is iron (usually as steel) and the following discussion is mainly related to metal corrosion. 3 11/25/2020
Why Study Corrosion? � Materials are precious resources � Engineering design is incomplete without knowledge of corrosion � Corrosion contaminates products such as pharmaceutical, food and dairy products � Corrosion products are a threat to the environment � Ensuring maximum life of new equipment � Preservation of existing equipment � Protecting or improving the quality of a product in order to maintain or improve a competitive position. � Avoiding costly interruptions of production. � Reducing or eliminating losses of valuable products by spillage or leaks. � Reducing hazards to life and property that might be associated with corrosion: 4 �Explosions of pressure vessels or piping systems 11/25/2020
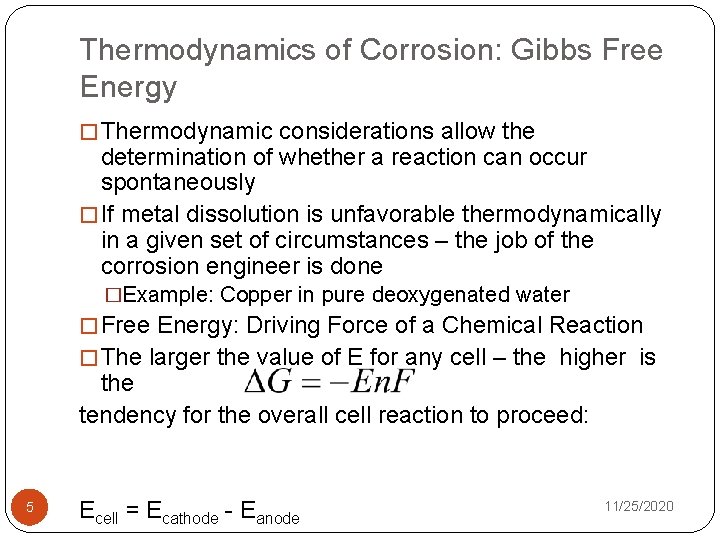
Thermodynamics of Corrosion: Gibbs Free Energy � Thermodynamic considerations allow the determination of whether a reaction can occur spontaneously � If metal dissolution is unfavorable thermodynamically in a given set of circumstances – the job of the corrosion engineer is done �Example: Copper in pure deoxygenated water � Free Energy: Driving Force of a Chemical Reaction � The larger the value of E for any cell – the higher is the tendency for the overall cell reaction to proceed: 5 Ecell = Ecathode - Eanode 11/25/2020
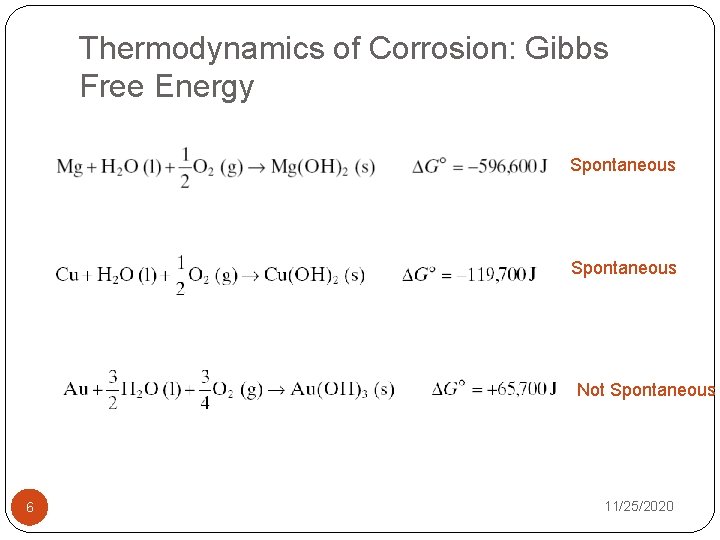
Thermodynamics of Corrosion: Gibbs Free Energy Spontaneous Not Spontaneous 6 11/25/2020
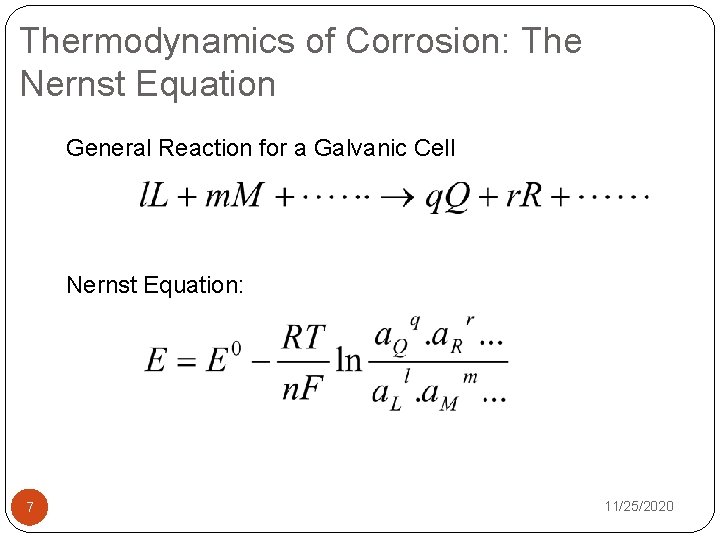
Thermodynamics of Corrosion: The Nernst Equation General Reaction for a Galvanic Cell Nernst Equation: 7 11/25/2020
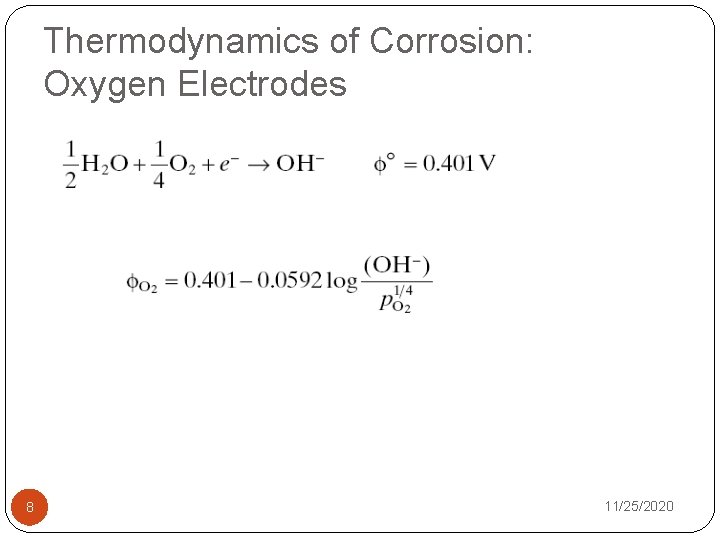
Thermodynamics of Corrosion: Oxygen Electrodes 8 11/25/2020
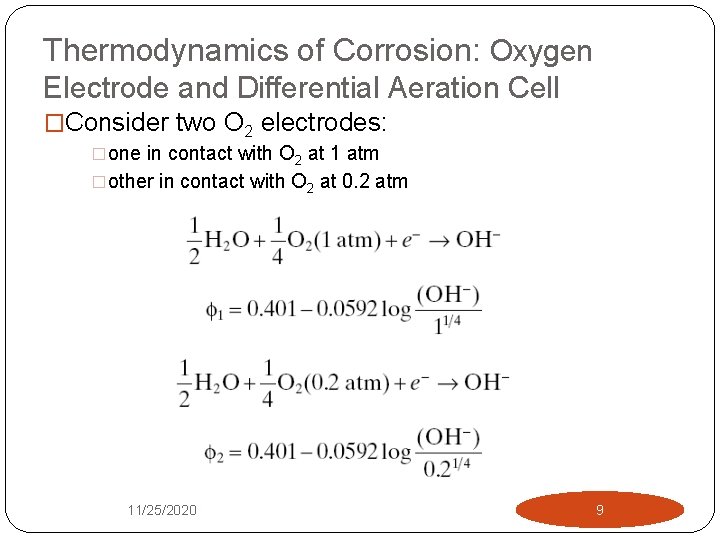
Thermodynamics of Corrosion: Oxygen Electrode and Differential Aeration Cell �Consider two O 2 electrodes: �one in contact with O 2 at 1 atm �other in contact with O 2 at 0. 2 atm 11/25/2020 9
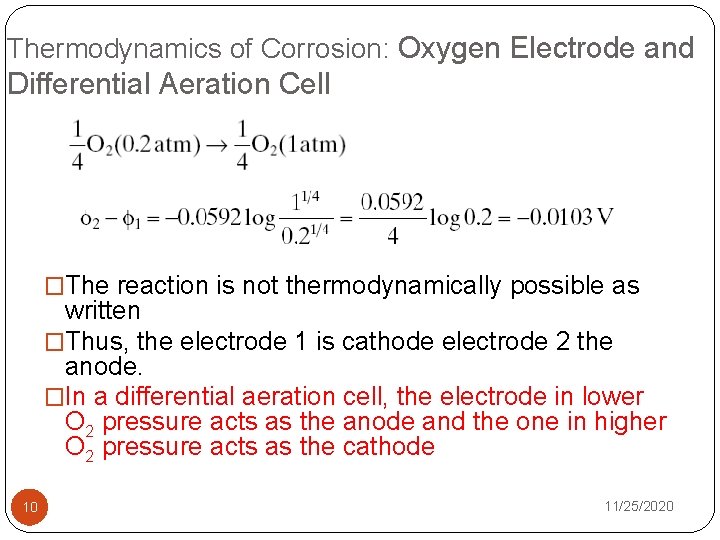
Thermodynamics of Corrosion: Oxygen Electrode and Differential Aeration Cell �The reaction is not thermodynamically possible as written �Thus, the electrode 1 is cathode electrode 2 the anode. �In a differential aeration cell, the electrode in lower O 2 pressure acts as the anode and the one in higher O 2 pressure acts as the cathode 10 11/25/2020
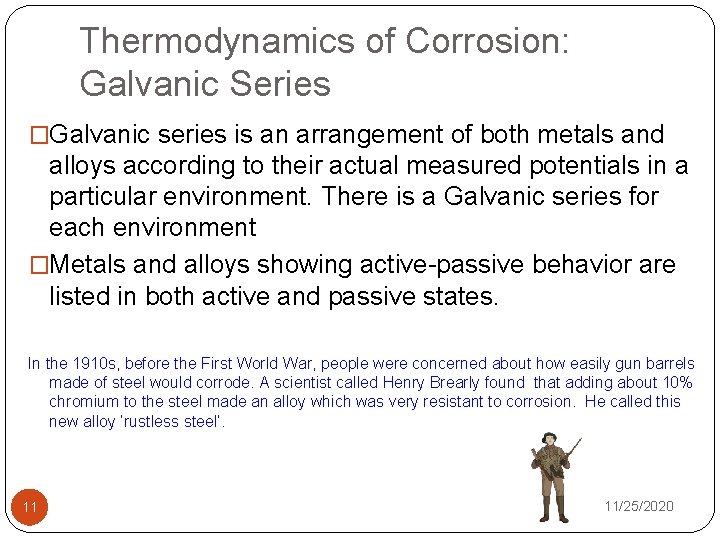
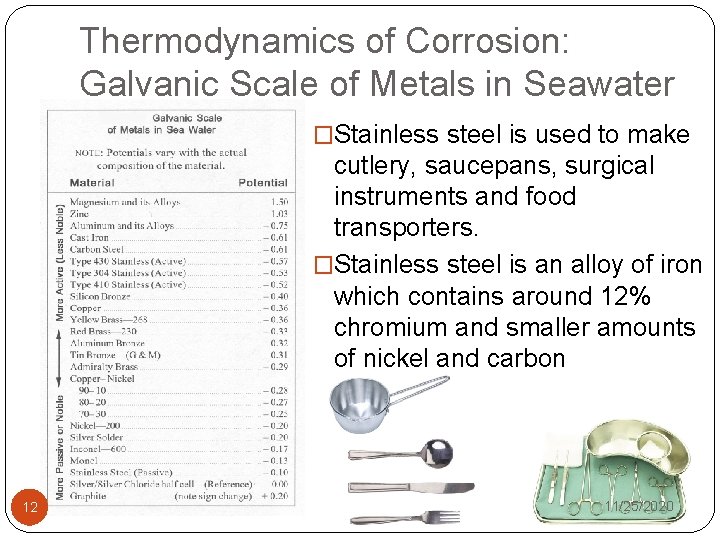
Thermodynamics of Corrosion: Galvanic Series �Galvanic series is an arrangement of both metals and alloys according to their actual measured potentials in a particular environment. There is a Galvanic series for each environment �Metals and alloys showing active-passive behavior are listed in both active and passive states. In the 1910 s, before the First World War, people were concerned about how easily gun barrels made of steel would corrode. A scientist called Henry Brearly found that adding about 10% chromium to the steel made an alloy which was very resistant to corrosion. He called this new alloy ‘rustless steel’. 11 11/25/2020
Thermodynamics of Corrosion: Galvanic Scale of Metals in Seawater �Stainless steel is used to make cutlery, saucepans, surgical instruments and food transporters. �Stainless steel is an alloy of iron which contains around 12% chromium and smaller amounts of nickel and carbon 12 11/25/2020
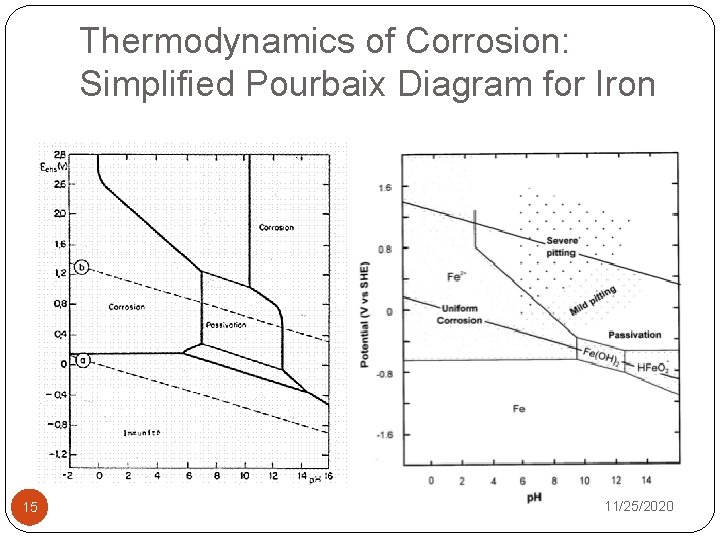
Thermodynamics of Corrosion: Pourbaix Diagram �The Nernst Equation allows us to compute lines for equilibrium reactions of interest … �Electrochemical reactions of pure charge transfer are horizontal lines since there is no H+ or OHdependence; �Pure acid-base reactions are vertical lines since no electron transfer occurs, thus there is no dependence on potential; �Electrochemical reactions involving charge 13 transfer and H+(OH-) are represented as sloping lines. 11/25/2020
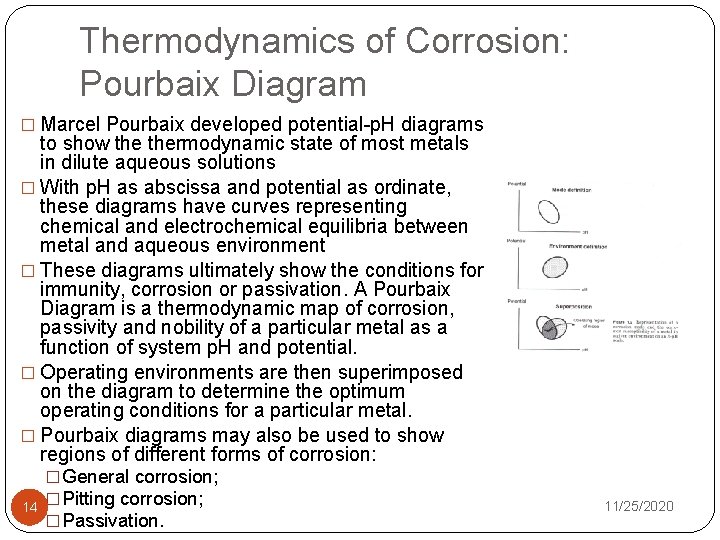
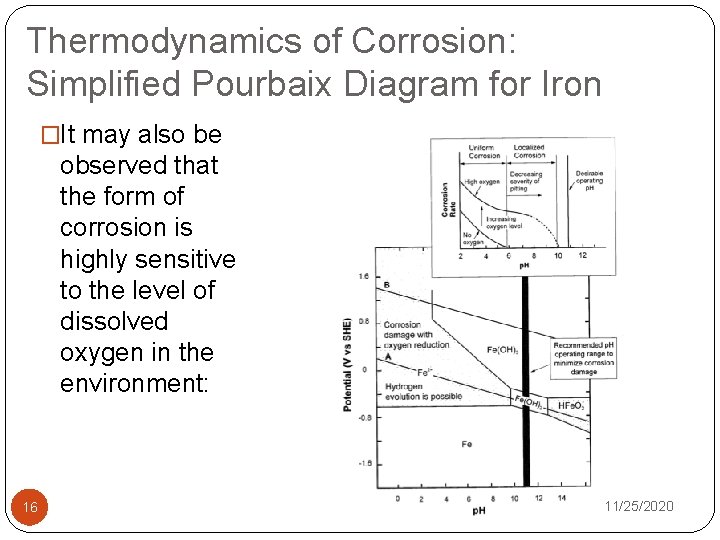
Thermodynamics of Corrosion: Pourbaix Diagram � Marcel Pourbaix developed potential-p. H diagrams to show thermodynamic state of most metals in dilute aqueous solutions � With p. H as abscissa and potential as ordinate, these diagrams have curves representing chemical and electrochemical equilibria between metal and aqueous environment � These diagrams ultimately show the conditions for immunity, corrosion or passivation. A Pourbaix Diagram is a thermodynamic map of corrosion, passivity and nobility of a particular metal as a function of system p. H and potential. � Operating environments are then superimposed on the diagram to determine the optimum operating conditions for a particular metal. � Pourbaix diagrams may also be used to show regions of different forms of corrosion: � General corrosion; 14 � Pitting corrosion; � Passivation. 11/25/2020
Thermodynamics of Corrosion: Simplified Pourbaix Diagram for Iron 15 11/25/2020
Thermodynamics of Corrosion: Simplified Pourbaix Diagram for Iron �It may also be observed that the form of corrosion is highly sensitive to the level of dissolved oxygen in the environment: 16 11/25/2020
Thermodynamics of Corrosion: Benefits of Pourbaix Diagram � Pourbaix diagrams offer a large volume of thermodynamic information in a very efficient and compact format. � The information in the diagrams can be beneficially used to control corrosion of pure metals in the aqueous environment �By altering the p. H and potential to the regions of immunity and passivation, corrosion can be controlled. For example, on increasing the p. H of environment in moving to slightly alkaline regions, the corrosion of iron can be controlled �Changing the potential of iron to more negative values eliminate corrosion, this technique is called cathodic protection. �Raising the potentials to more positive values reduces the corrosion by formation of stable films of oxides on the surface of transition metals 17 11/25/2020
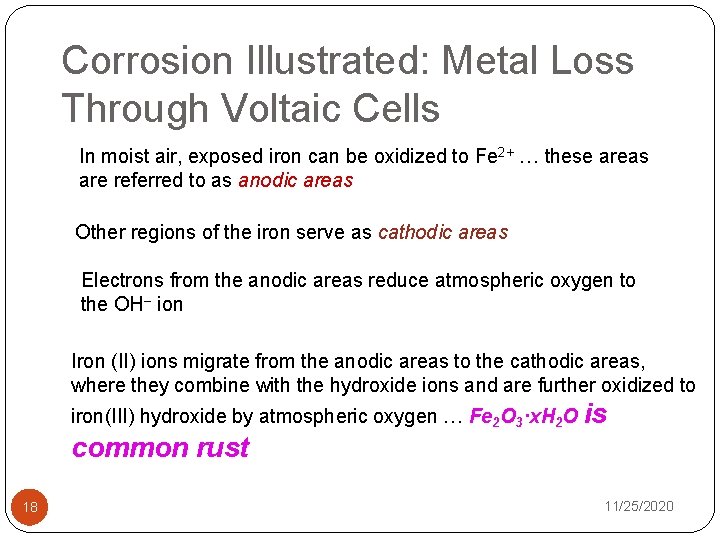
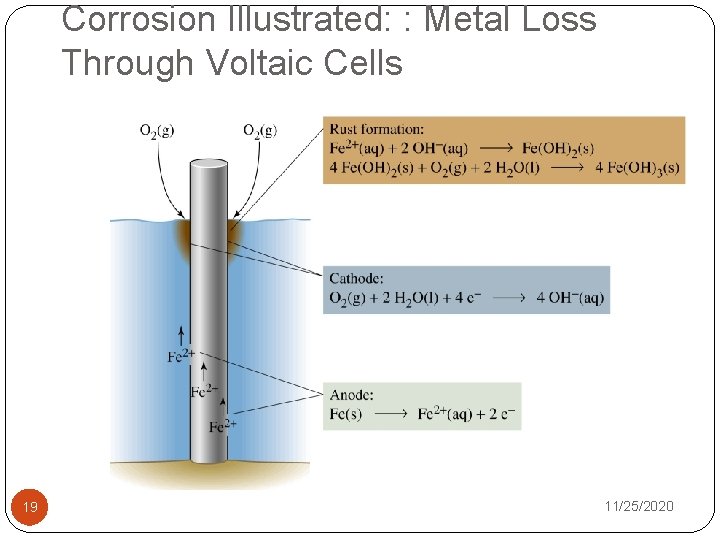
Corrosion Illustrated: Metal Loss Through Voltaic Cells In moist air, exposed iron can be oxidized to Fe 2+ … these areas are referred to as anodic areas Other regions of the iron serve as cathodic areas Electrons from the anodic areas reduce atmospheric oxygen to the OH– ion Iron (II) ions migrate from the anodic areas to the cathodic areas, where they combine with the hydroxide ions and are further oxidized to iron(III) hydroxide by atmospheric oxygen … Fe 2 O 3·x. H 2 O is common rust 18 11/25/2020
Corrosion Illustrated: : Metal Loss Through Voltaic Cells 19 11/25/2020
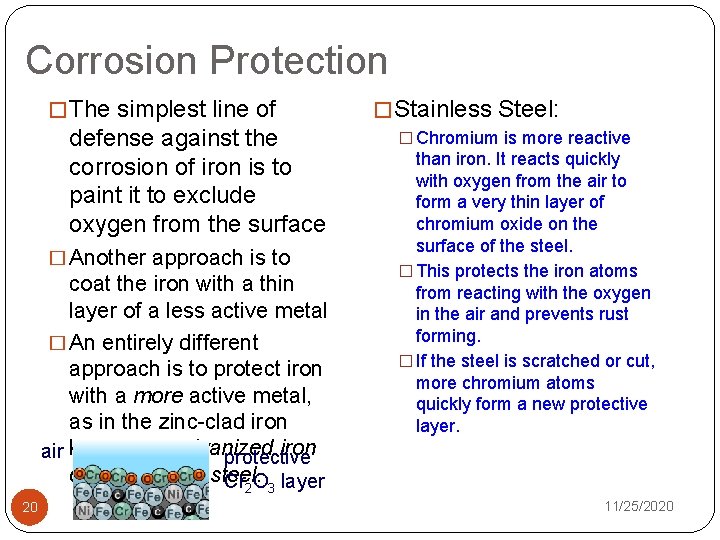
Corrosion Protection � The simplest line of defense against the corrosion of iron is to paint it to exclude oxygen from the surface � Another approach is to coat the iron with a thin layer of a less active metal � An entirely different approach is to protect iron with a more active metal, as in the zinc-clad iron air known as galvanized protective or in stainless steel. Cr O layer 2 20 � Stainless Steel: � Chromium is more reactive than iron. It reacts quickly with oxygen from the air to form a very thin layer of chromium oxide on the surface of the steel. � This protects the iron atoms from reacting with the oxygen in the air and prevents rust forming. � If the steel is scratched or cut, more chromium atoms quickly form a new protective layer. 3 11/25/2020
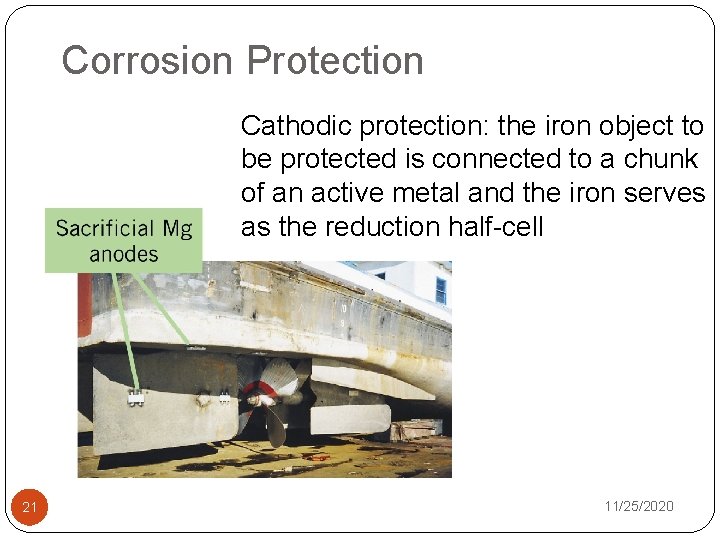
Corrosion Protection Cathodic protection: the iron object to be protected is connected to a chunk of an active metal and the iron serves as the reduction half-cell 21 11/25/2020
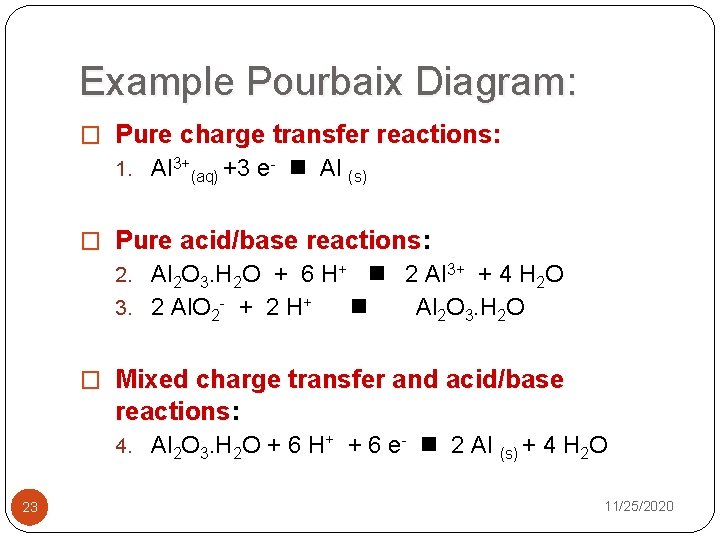
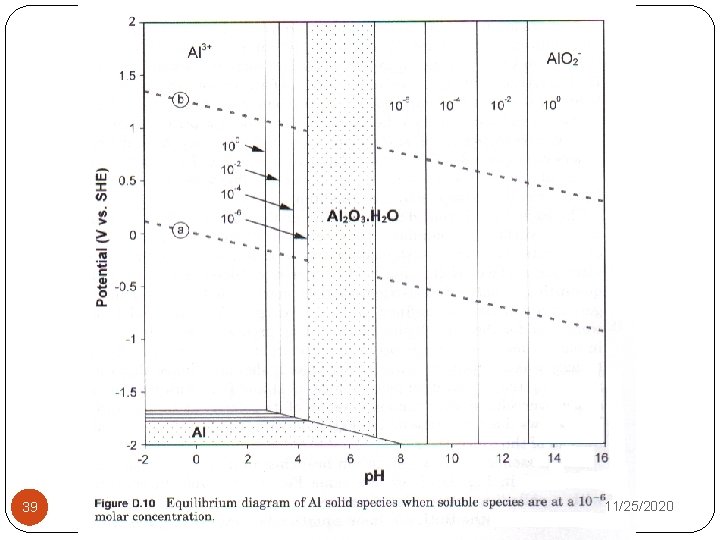
Example Pourbaix Diagram: �Consider a fairly simple system … aluminum corroding in water: �the following species are considered to be predominant in the system: �Al (s); �Al 3+ (aq); �Al 2 O 3. H 2 O (s); �Al. O 2 - (aq). �We can consider several “equilibrium” reactions describing thermodynamic stability of these aluminum-containing species … 22 11/25/2020
Example Pourbaix Diagram: � Pure charge transfer reactions: 1. Al 3+(aq) +3 e- n Al (s) � Pure acid/base reactions: 2. Al 2 O 3. H 2 O + 6 H+ n 2 Al 3+ + 4 H 2 O 3. 2 Al. O 2 - + 2 H+ n Al 2 O 3. H 2 O � Mixed charge transfer and acid/base reactions: 4. Al 2 O 3. H 2 O + 6 H+ + 6 e- n 2 Al 23 (s) + 4 H 2 O 11/25/2020
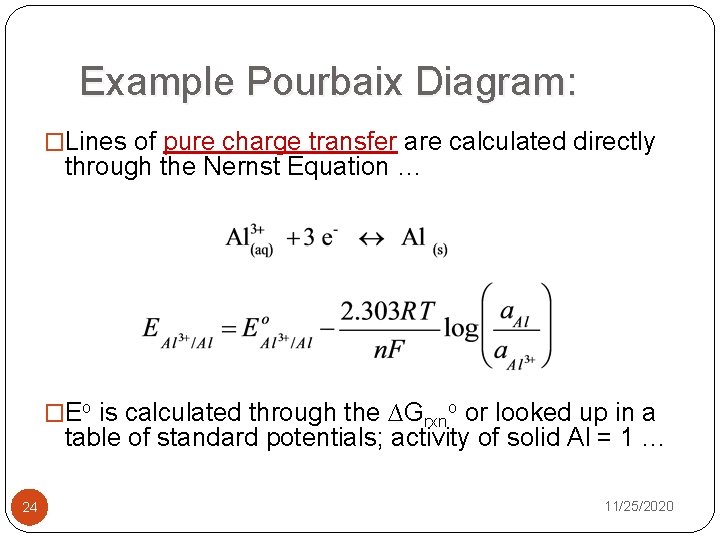
Example Pourbaix Diagram: �Lines of pure charge transfer are calculated directly through the Nernst Equation … �Eo is calculated through the ∆Grxno or looked up in a table of standard potentials; activity of solid Al = 1 … 24 11/25/2020
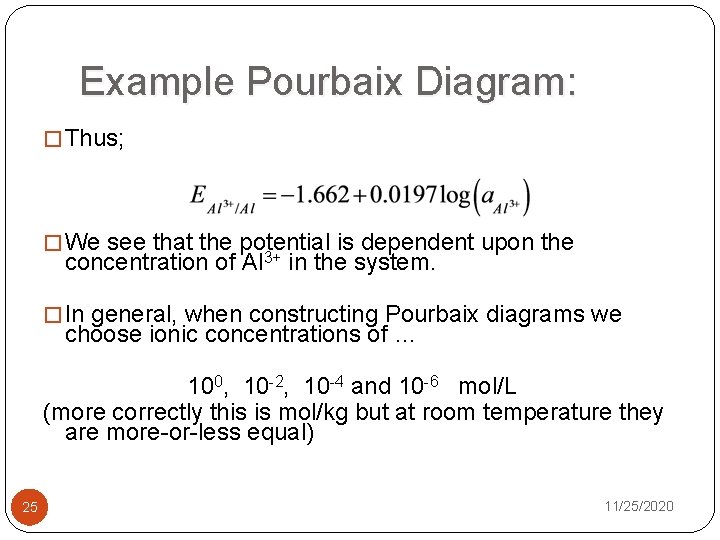
Example Pourbaix Diagram: � Thus; � We see that the potential is dependent upon the concentration of Al 3+ in the system. � In general, when constructing Pourbaix diagrams we choose ionic concentrations of … 100, 10 -2, 10 -4 and 10 -6 mol/L (more correctly this is mol/kg but at room temperature they are more-or-less equal) 25 11/25/2020
Example Pourbaix Diagram: 26 11/25/2020
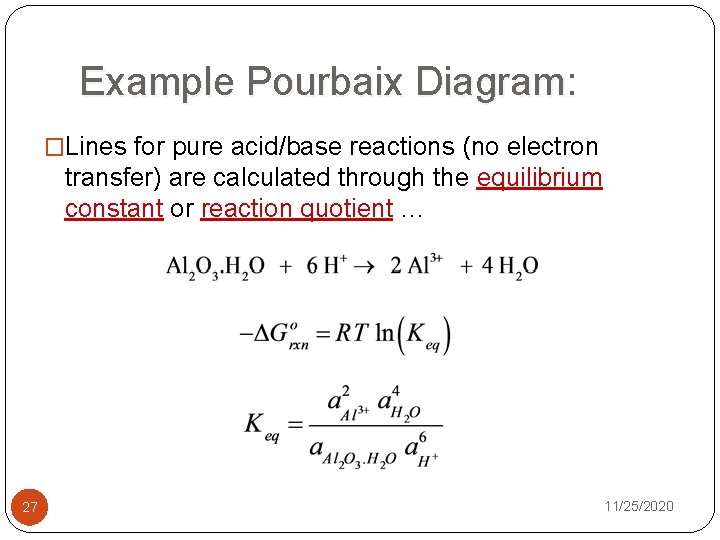
Example Pourbaix Diagram: �Lines for pure acid/base reactions (no electron transfer) are calculated through the equilibrium constant or reaction quotient … 27 11/25/2020
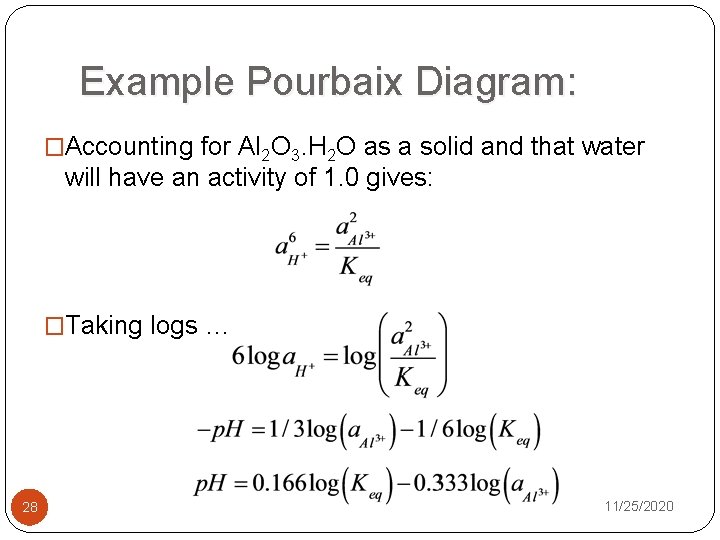
Example Pourbaix Diagram: �Accounting for Al 2 O 3. H 2 O as a solid and that water will have an activity of 1. 0 gives: �Taking logs … 28 11/25/2020
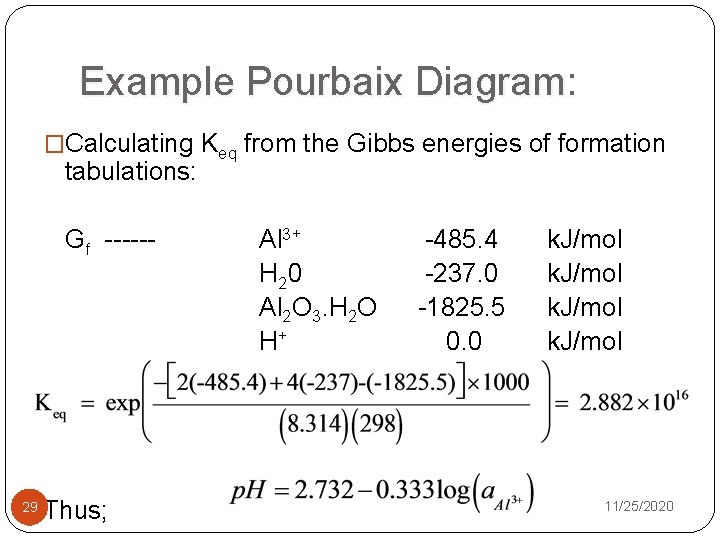
Example Pourbaix Diagram: �Calculating Keq from the Gibbs energies of formation tabulations: Gf ------ 29 Thus; Al 3+ H 20 Al 2 O 3. H 2 O H+ -485. 4 -237. 0 -1825. 5 0. 0 k. J/mol 11/25/2020
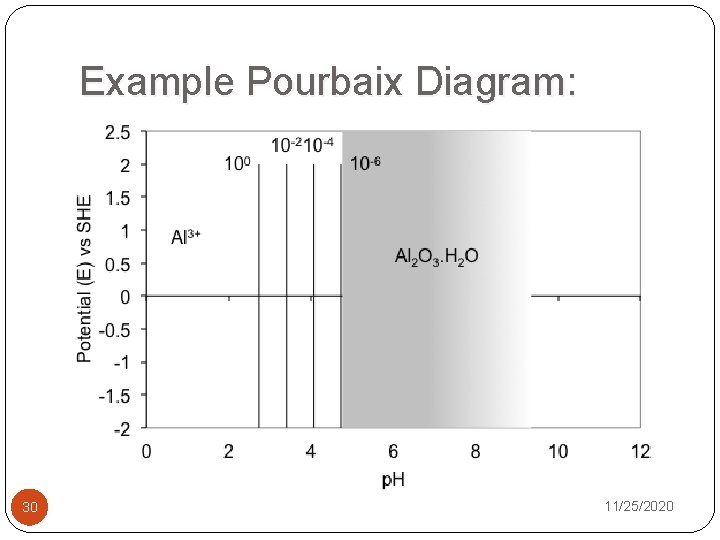
Example Pourbaix Diagram: 30 11/25/2020
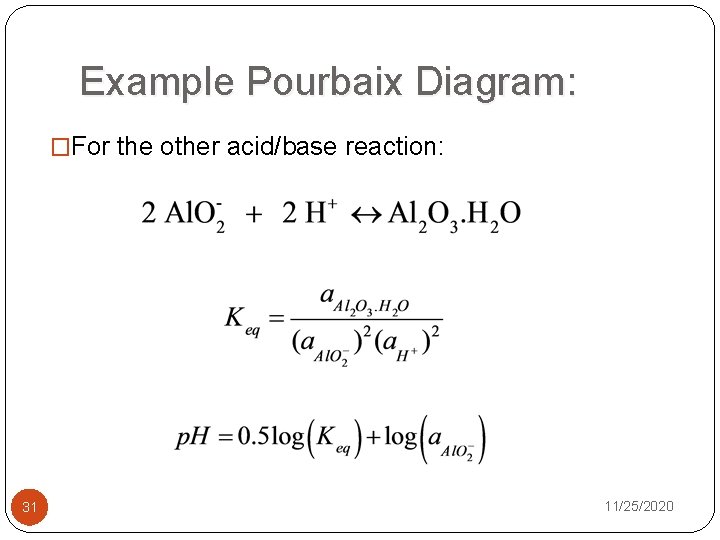
Example Pourbaix Diagram: �For the other acid/base reaction: 31 11/25/2020
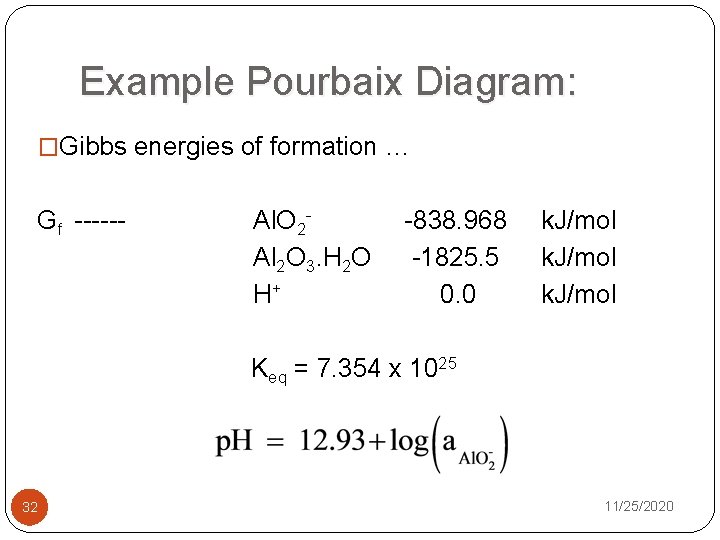
Example Pourbaix Diagram: �Gibbs energies of formation … Gf ------ Al. O 2 Al 2 O 3. H 2 O H+ -838. 968 -1825. 5 0. 0 k. J/mol Keq = 7. 354 x 1025 32 11/25/2020
Example Pourbaix Diagram: 33 11/25/2020
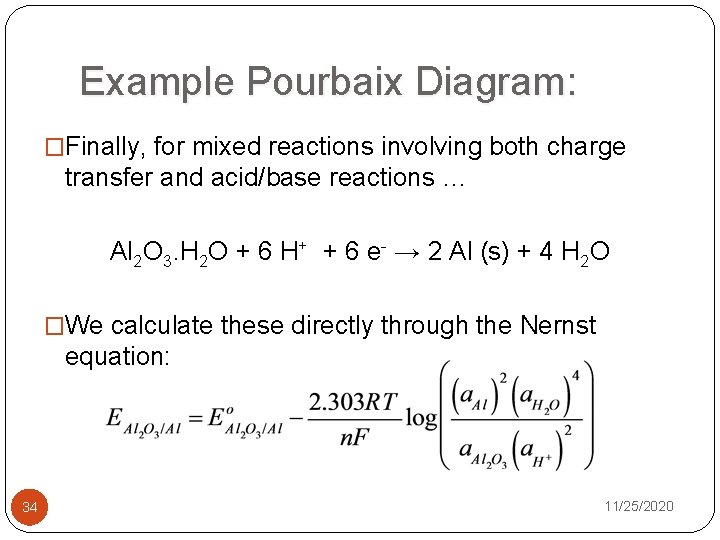
Example Pourbaix Diagram: �Finally, for mixed reactions involving both charge transfer and acid/base reactions … Al 2 O 3. H 2 O + 6 H+ + 6 e- → 2 Al (s) + 4 H 2 O �We calculate these directly through the Nernst equation: 34 11/25/2020
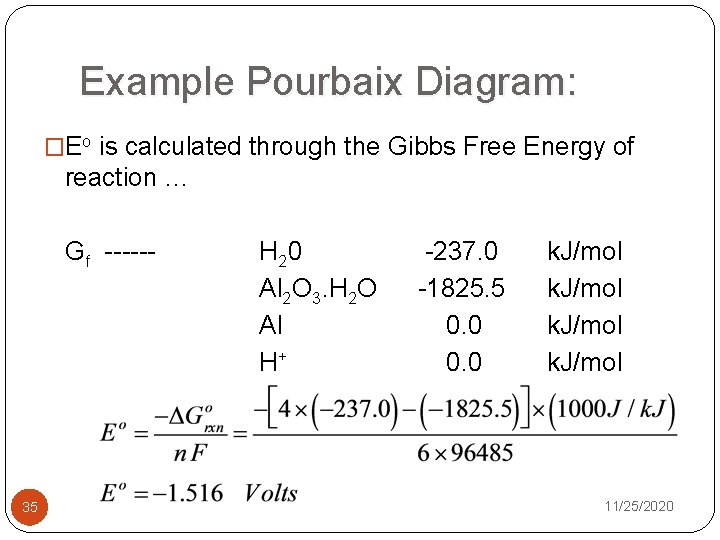
Example Pourbaix Diagram: �Eo is calculated through the Gibbs Free Energy of reaction … Gf ------ 35 H 20 Al 2 O 3. H 2 O Al H+ -237. 0 -1825. 5 0. 0 k. J/mol 11/25/2020
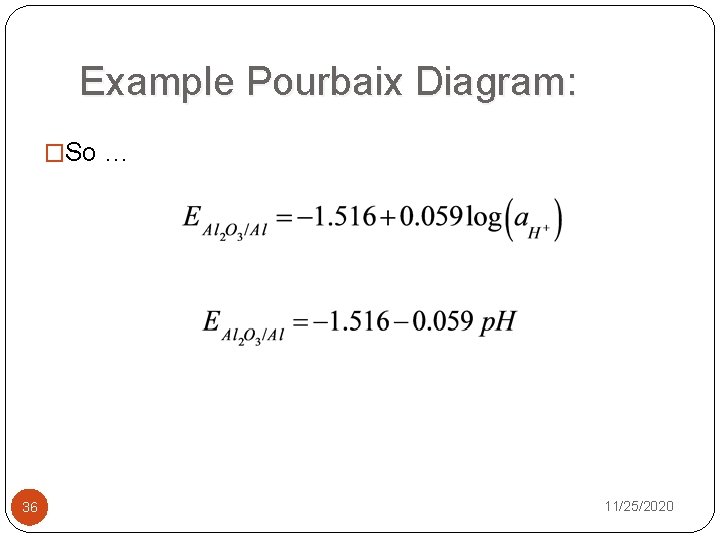
Example Pourbaix Diagram: �So … 36 11/25/2020
Example Pourbaix Diagram: 37 11/25/2020
Example Pourbaix Diagram: �Putting all our lines together … we get the “Pourbaix” Diagram for Aluminum … 38 11/25/2020
39 11/25/2020
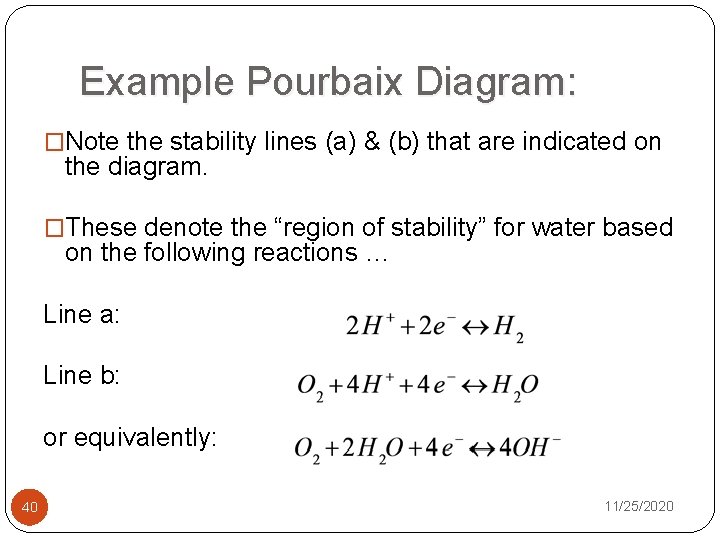
Example Pourbaix Diagram: �Note the stability lines (a) & (b) that are indicated on the diagram. �These denote the “region of stability” for water based on the following reactions … Line a: Line b: or equivalently: 40 11/25/2020
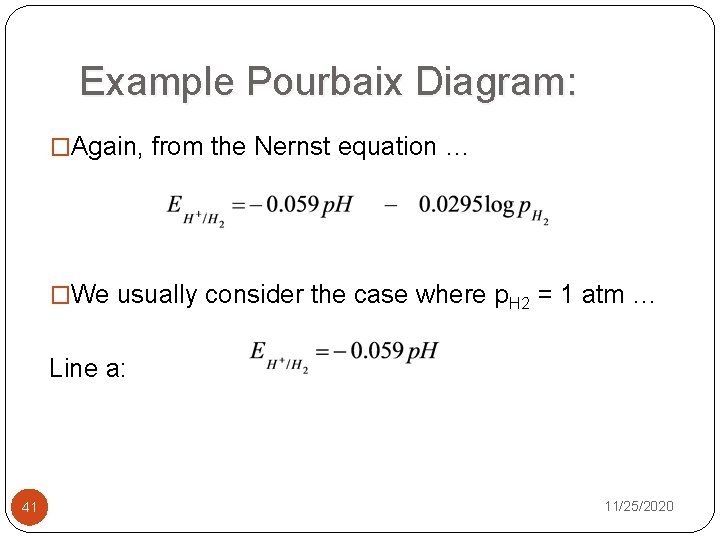
Example Pourbaix Diagram: �Again, from the Nernst equation … �We usually consider the case where p. H 2 = 1 atm … Line a: 41 11/25/2020
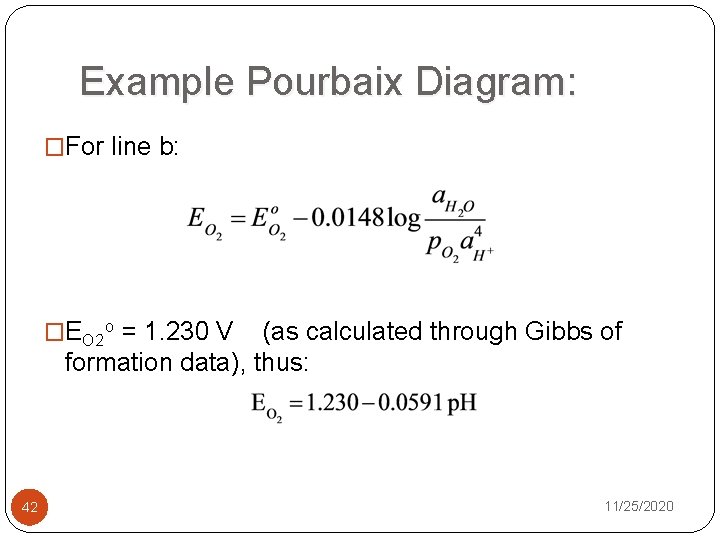
Example Pourbaix Diagram: �For line b: �EO 2 o = 1. 230 V (as calculated through Gibbs of formation data), thus: 42 11/25/2020
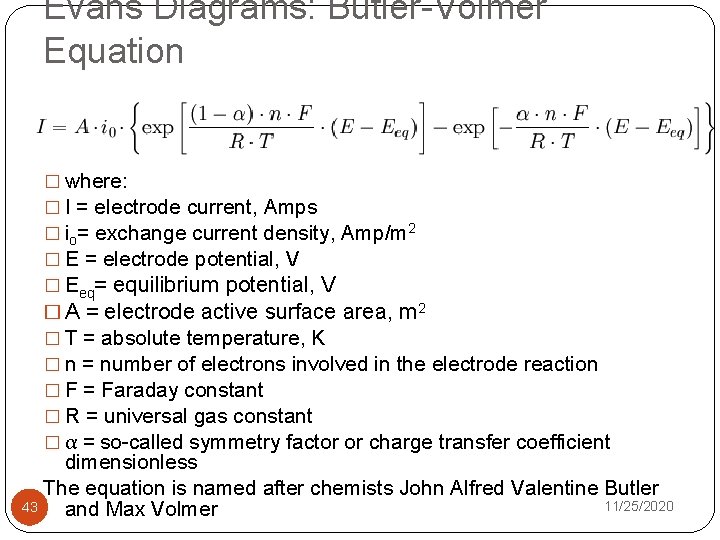
Evans Diagrams: Butler-Volmer Equation � where: � I = electrode current, Amps � io= exchange current density, Amp/m 2 � E = electrode potential, V � Eeq= equilibrium potential, V � A = electrode active surface area, m 2 � T = absolute temperature, K � n = number of electrons involved in the electrode reaction � F = Faraday constant � R = universal gas constant � α = so-called symmetry factor or charge transfer coefficient dimensionless The equation is named after chemists John Alfred Valentine Butler 11/25/2020 43 and Max Volmer
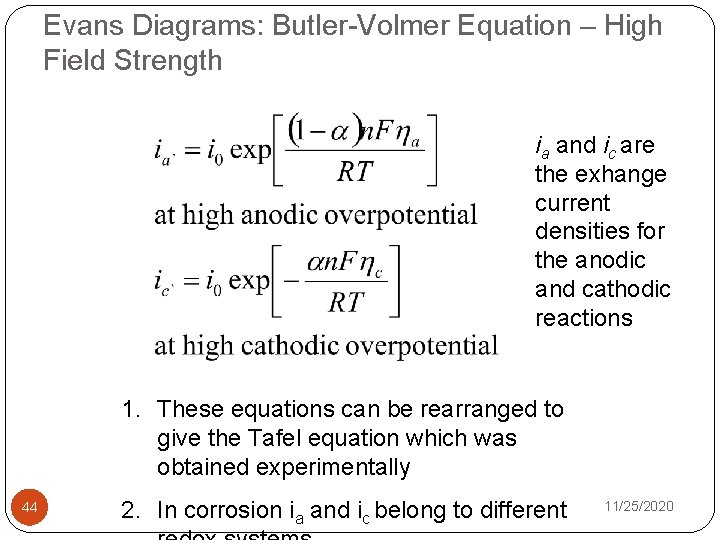
Evans Diagrams: Butler-Volmer Equation – High Field Strength ia and ic are the exhange current densities for the anodic and cathodic reactions 1. These equations can be rearranged to give the Tafel equation which was obtained experimentally 44 2. In corrosion ia and ic belong to different 11/25/2020
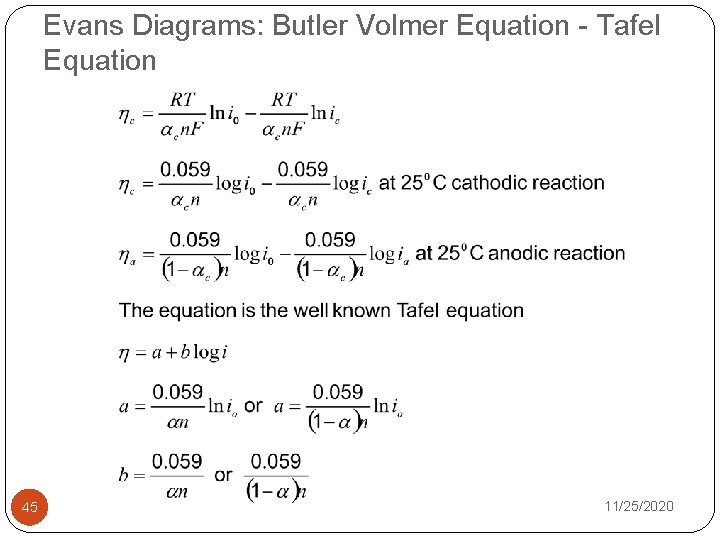
Evans Diagrams: Butler Volmer Equation - Tafel Equation 45 11/25/2020
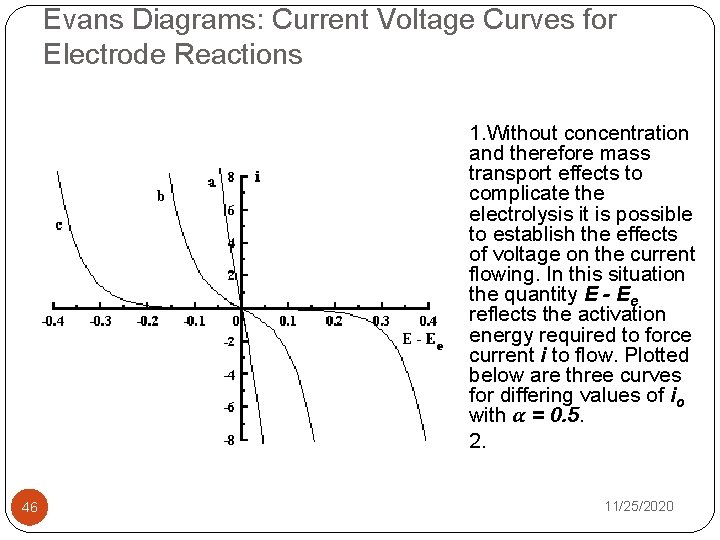
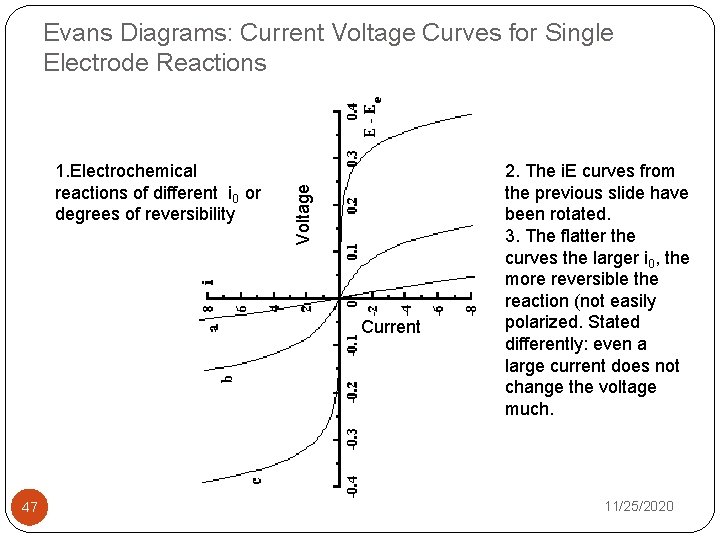
Evans Diagrams: Current Voltage Curves for Electrode Reactions 1. Without concentration and therefore mass transport effects to complicate the electrolysis it is possible to establish the effects of voltage on the current flowing. In this situation the quantity E - Ee reflects the activation energy required to force current i to flow. Plotted below are three curves for differing values of io with α = 0. 5. 2. 46 11/25/2020
1. Electrochemical reactions of different i 0 or degrees of reversibility Voltage Evans Diagrams: Current Voltage Curves for Single Electrode Reactions Current 47 2. The i. E curves from the previous slide have been rotated. 3. The flatter the curves the larger i 0, the more reversible the reaction (not easily polarized. Stated differently: even a large current does not change the voltage much. 11/25/2020
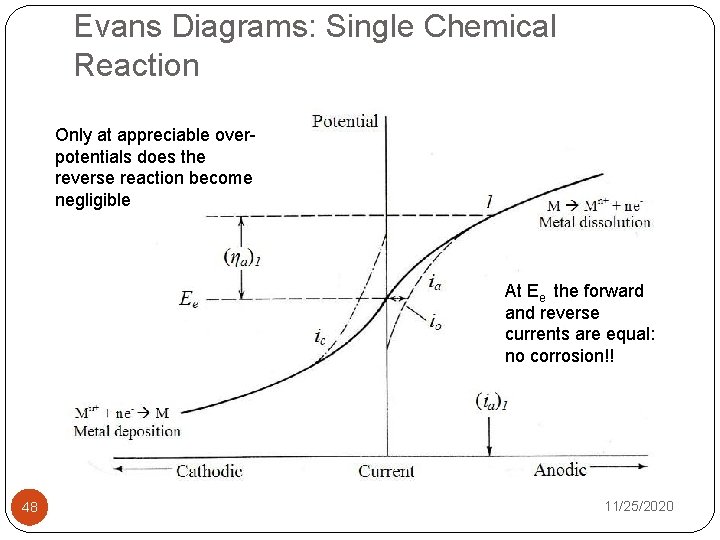
Evans Diagrams: Single Chemical Reaction Only at appreciable overpotentials does the reverse reaction become negligible At Ee the forward and reverse currents are equal: no corrosion!! 48 11/25/2020
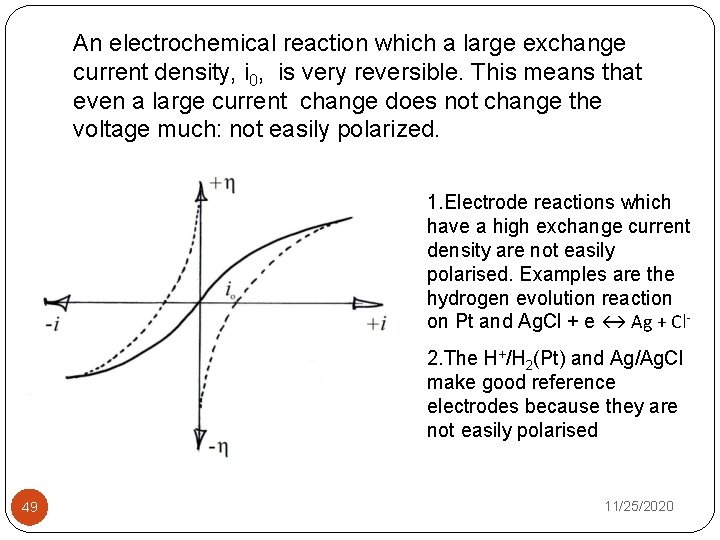
An electrochemical reaction which a large exchange current density, i 0, is very reversible. This means that even a large current change does not change the voltage much: not easily polarized. 1. Electrode reactions which have a high exchange current density are not easily polarised. Examples are the hydrogen evolution reaction on Pt and Ag. Cl + e ↔ Ag + Cl 2. The H+/H 2(Pt) and Ag/Ag. Cl make good reference electrodes because they are not easily polarised 49 11/25/2020
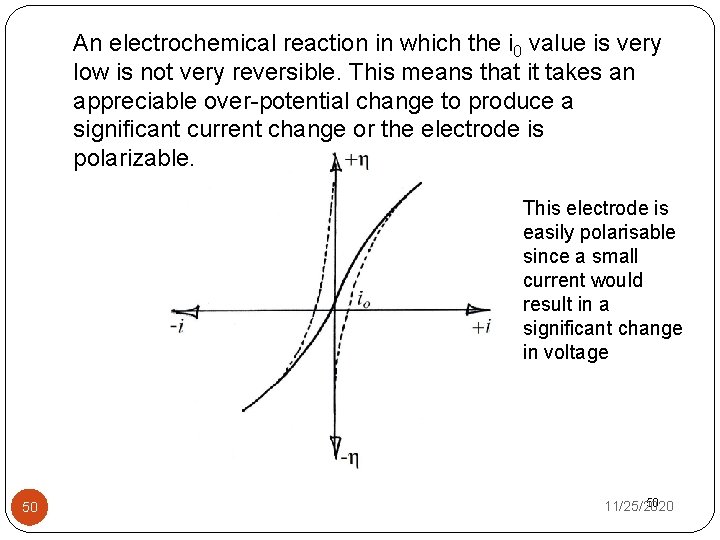
An electrochemical reaction in which the i 0 value is very low is not very reversible. This means that it takes an appreciable over-potential change to produce a significant current change or the electrode is polarizable. This electrode is easily polarisable since a small current would result in a significant change in voltage 50 50 11/25/2020
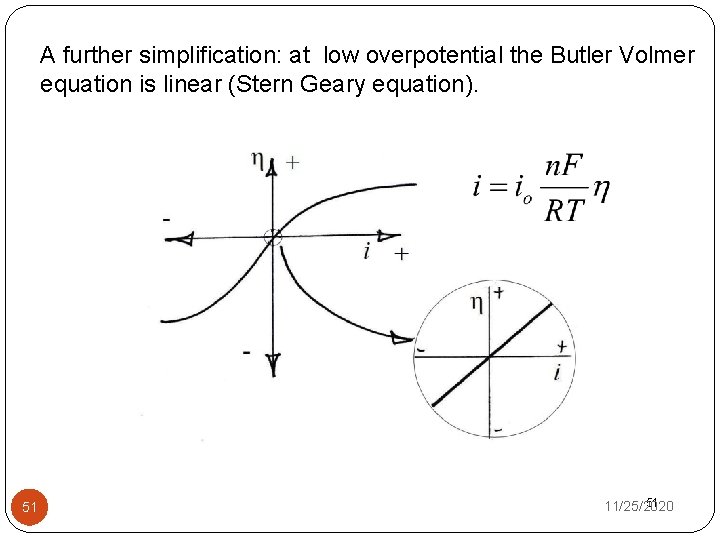
A further simplification: at low overpotential the Butler Volmer equation is linear (Stern Geary equation). 51 51 11/25/2020
Back to Corrosion 1. So far we have looked mainly at single electrochemical reactions (e. g. Fe 2+ and Fe 3+). In that case there is no macroscopic change in the electrochemical cell. 2. In a corrosion reaction there at least two redox species involved, say Fe 2+ and oxygen. In this case there is a macroscopic change. 52 11/25/2020
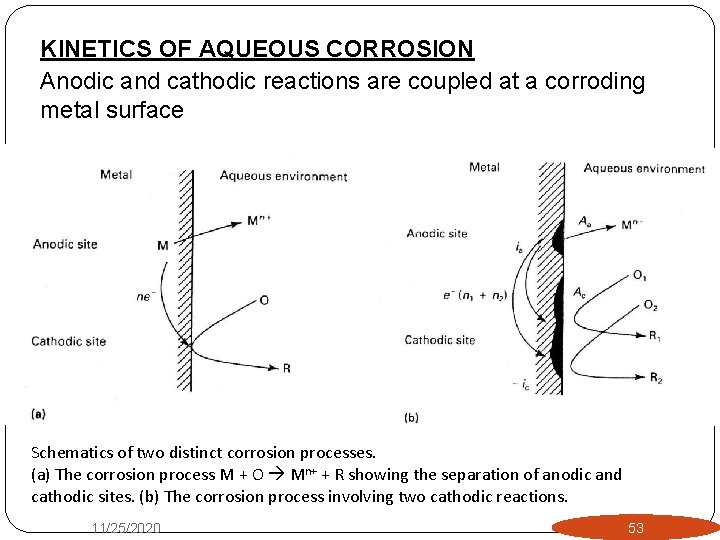
KINETICS OF AQUEOUS CORROSION Anodic and cathodic reactions are coupled at a corroding metal surface Schematics of two distinct corrosion processes. (a) The corrosion process M + O Mn+ + R showing the separation of anodic and cathodic sites. (b) The corrosion process involving two cathodic reactions. 11/25/2020 53
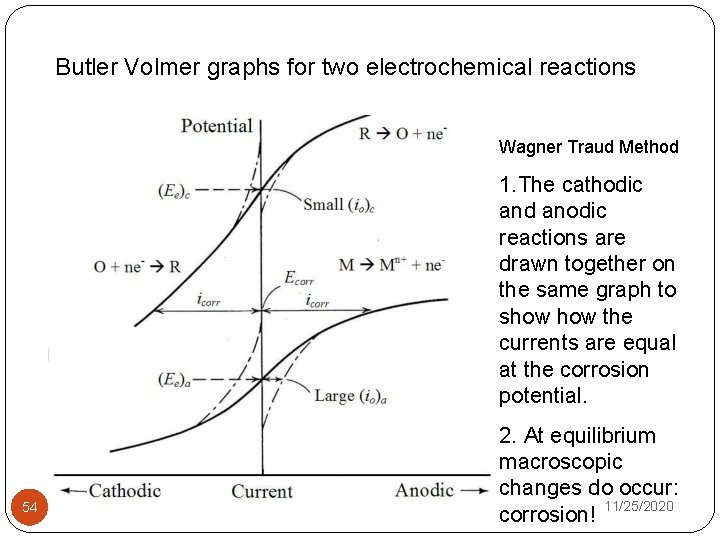
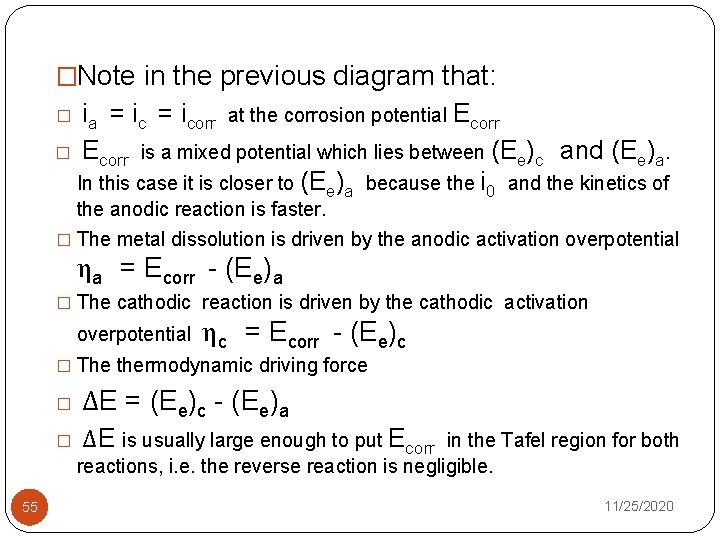
Butler Volmer graphs for two electrochemical reactions Wagner Traud Method 1. The cathodic and anodic reactions are drawn together on the same graph to show the currents are equal at the corrosion potential. 54 2. At equilibrium macroscopic changes do occur: corrosion! 11/25/2020
�Note in the previous diagram that: � ia � = icorr Ecorr at the corrosion potential Ecorr is a mixed potential which lies between (Ee)c and (Ee)a. In this case it is closer to (Ee)a because the i 0 and the kinetics of the anodic reaction is faster. � The metal dissolution is driven by the anodic activation overpotential ηa = Ecorr - (Ee)a � The cathodic reaction is driven by the cathodic activation overpotential ηc = Ecorr - (Ee)c � The thermodynamic driving force 55 � ΔE = (Ee)c - (Ee)a � ΔE is usually large enough to put Ecorr in the Tafel region for both reactions, i. e. the reverse reaction is negligible. 11/25/2020
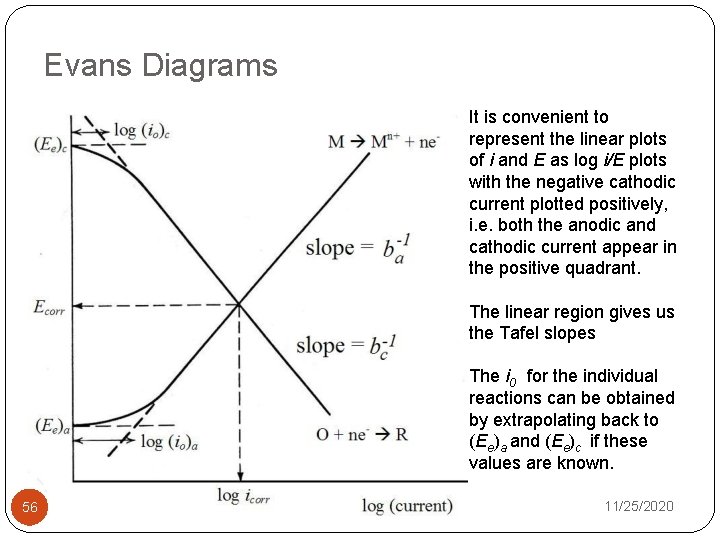
Evans Diagrams It is convenient to represent the linear plots of i and E as log i/E plots with the negative cathodic current plotted positively, i. e. both the anodic and cathodic current appear in the positive quadrant. The linear region gives us the Tafel slopes The i 0 for the individual reactions can be obtained by extrapolating back to (Ee)a and (Ee)c if these values are known. 56 11/25/2020
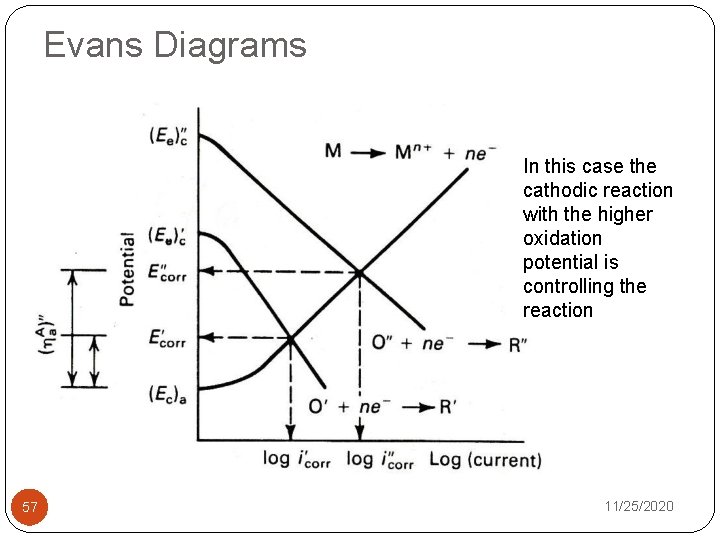
Evans Diagrams In this case the cathodic reaction with the higher oxidation potential is controlling the reaction 57 11/25/2020
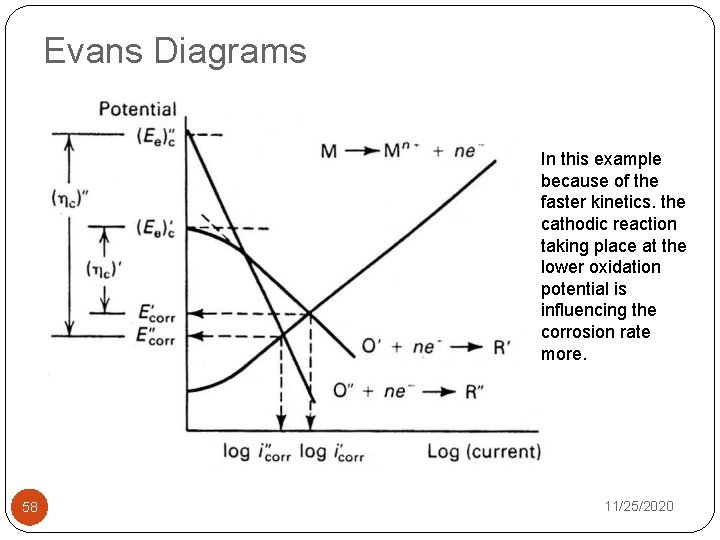
Evans Diagrams In this example because of the faster kinetics. the cathodic reaction taking place at the lower oxidation potential is influencing the corrosion rate more. 58 11/25/2020
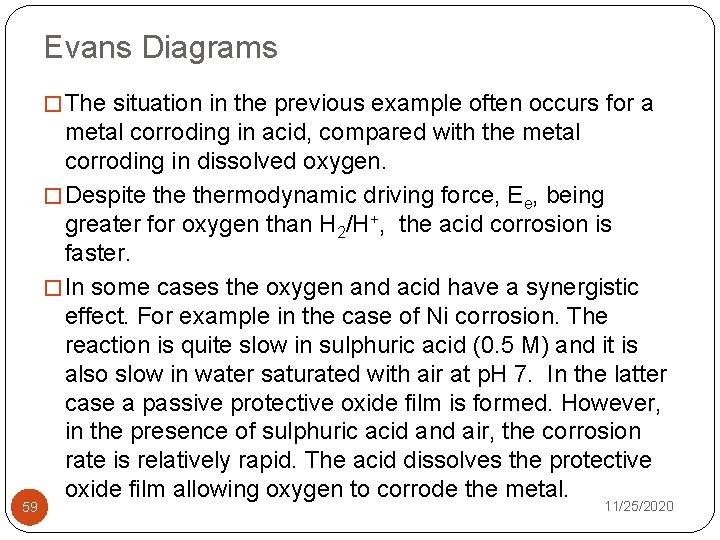
Evans Diagrams � The situation in the previous example often occurs for a 59 metal corroding in acid, compared with the metal corroding in dissolved oxygen. � Despite thermodynamic driving force, Ee, being greater for oxygen than H 2/H+, the acid corrosion is faster. � In some cases the oxygen and acid have a synergistic effect. For example in the case of Ni corrosion. The reaction is quite slow in sulphuric acid (0. 5 M) and it is also slow in water saturated with air at p. H 7. In the latter case a passive protective oxide film is formed. However, in the presence of sulphuric acid and air, the corrosion rate is relatively rapid. The acid dissolves the protective oxide film allowing oxygen to corrode the metal. 11/25/2020
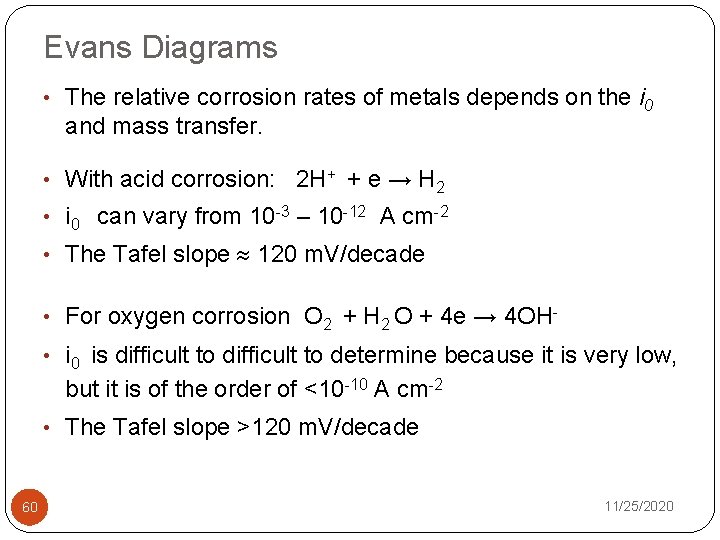
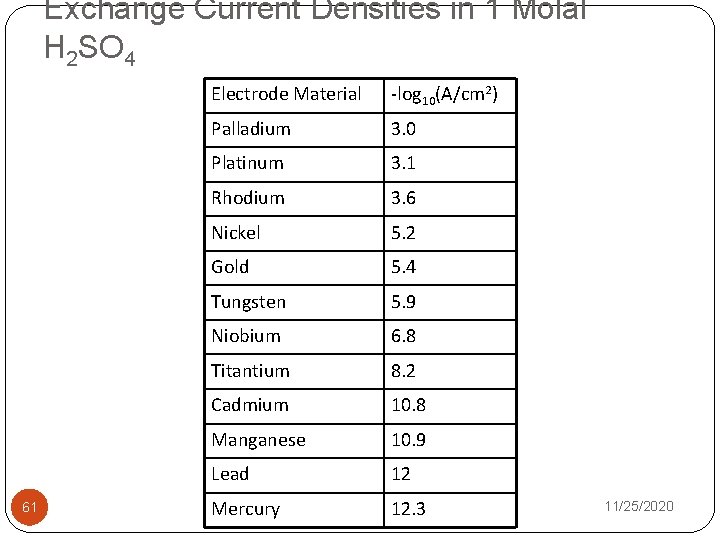
Evans Diagrams • The relative corrosion rates of metals depends on the i 0 and mass transfer. • With acid corrosion: 2 H+ + e → H 2 • i 0 can vary from 10 -3 – 10 -12 A cm-2 • The Tafel slope 120 m. V/decade • For oxygen corrosion O 2 + H 2 O + 4 e → 4 OH • i 0 is difficult to determine because it is very low, but it is of the order of <10 -10 A cm-2 • The Tafel slope >120 m. V/decade 60 11/25/2020
Exchange Current Densities in 1 Molal H 2 SO 4 61 Electrode Material -log 10(A/cm 2) Palladium 3. 0 Platinum 3. 1 Rhodium 3. 6 Nickel 5. 2 Gold 5. 4 Tungsten 5. 9 Niobium 6. 8 Titantium 8. 2 Cadmium 10. 8 Manganese 10. 9 Lead 12 Mercury 12. 3 11/25/2020
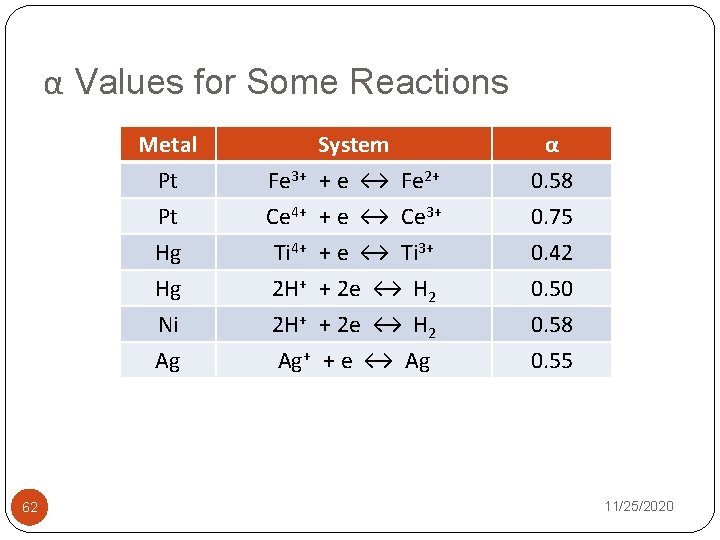
α Values for Some Reactions Metal Pt Pt Hg Hg Ni Ag 62 System Fe 3+ + e ↔ Fe 2+ Ce 4+ + e ↔ Ce 3+ Ti 4+ + e ↔ Ti 3+ 2 H+ + 2 e ↔ H 2 Ag+ + e ↔ Ag α 0. 58 0. 75 0. 42 0. 50 0. 58 0. 55 11/25/2020
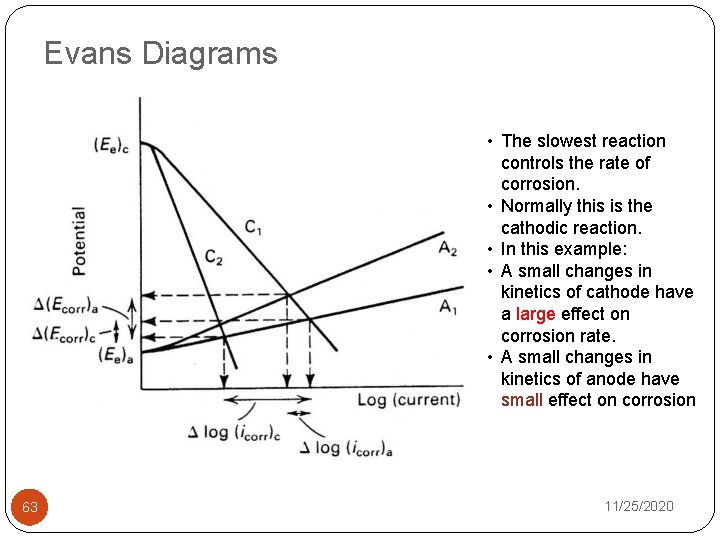
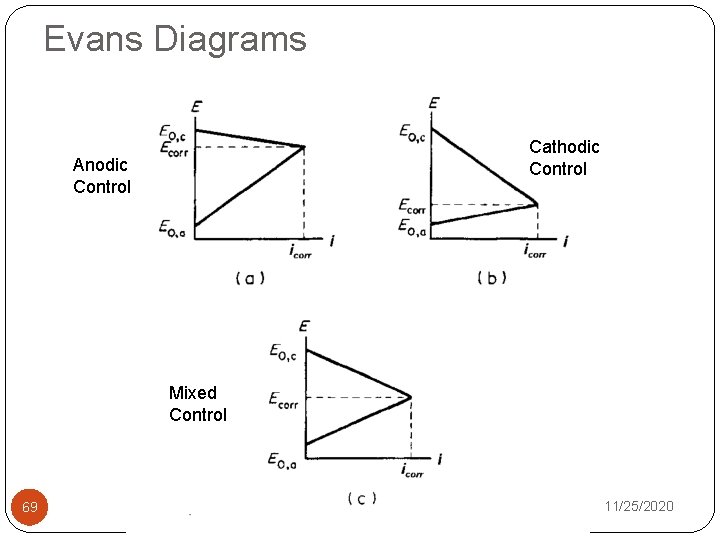
Evans Diagrams • The slowest reaction controls the rate of corrosion. • Normally this is the cathodic reaction. • In this example: • A small changes in kinetics of cathode have a large effect on corrosion rate. • A small changes in kinetics of anode have small effect on corrosion 63 11/25/2020
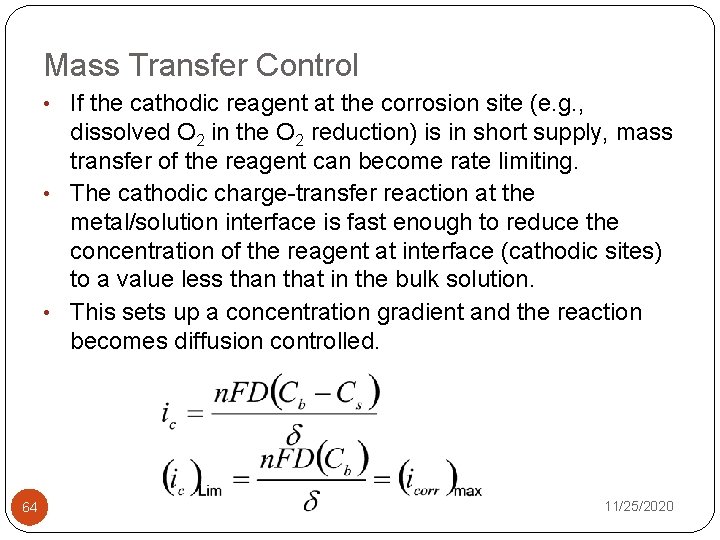
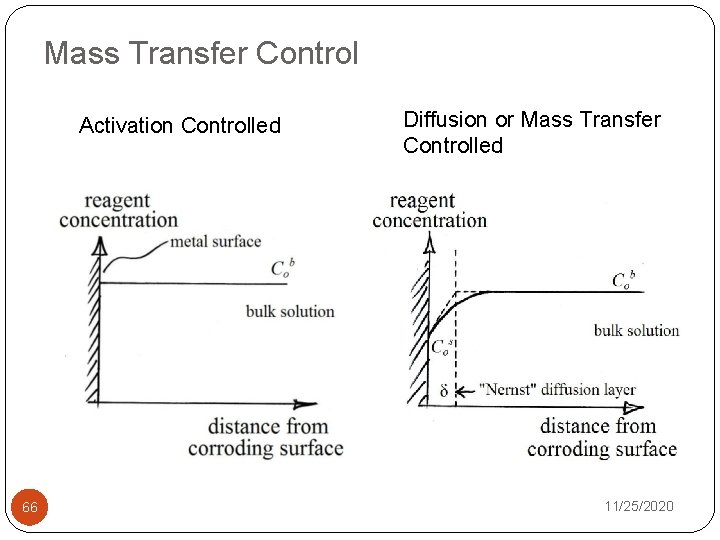
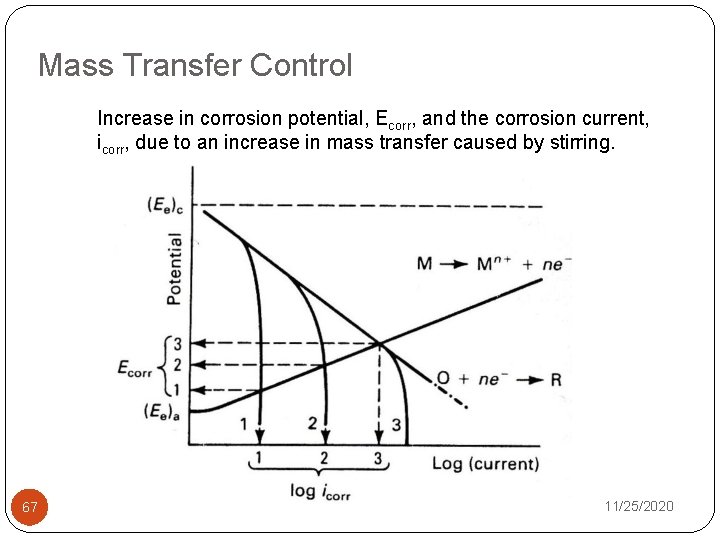
Mass Transfer Control • If the cathodic reagent at the corrosion site (e. g. , dissolved O 2 in the O 2 reduction) is in short supply, mass transfer of the reagent can become rate limiting. • The cathodic charge-transfer reaction at the metal/solution interface is fast enough to reduce the concentration of the reagent at interface (cathodic sites) to a value less than that in the bulk solution. • This sets up a concentration gradient and the reaction becomes diffusion controlled. 64 11/25/2020
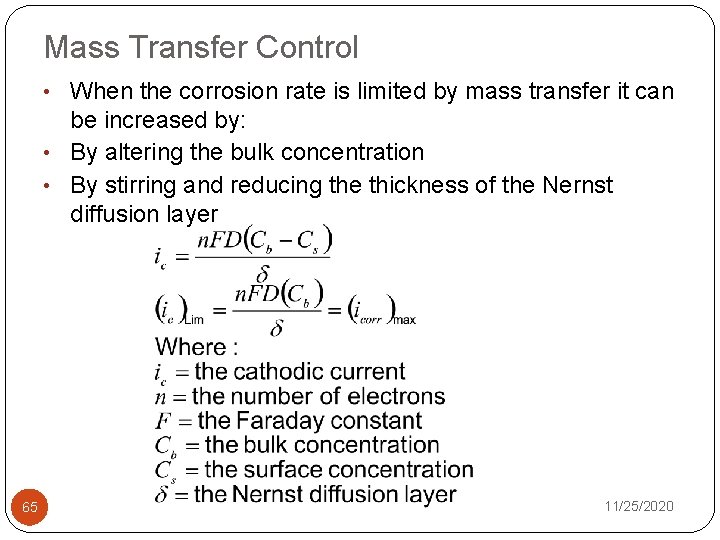
Mass Transfer Control • When the corrosion rate is limited by mass transfer it can be increased by: • By altering the bulk concentration • By stirring and reducing the thickness of the Nernst diffusion layer 65 11/25/2020
Mass Transfer Control Activation Controlled 66 Diffusion or Mass Transfer Controlled 11/25/2020
Mass Transfer Control Increase in corrosion potential, Ecorr, and the corrosion current, icorr, due to an increase in mass transfer caused by stirring. 67 11/25/2020
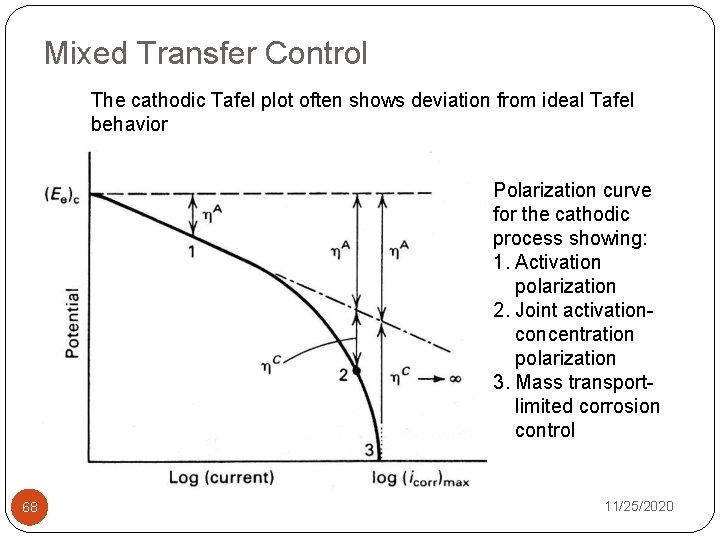
Mixed Transfer Control The cathodic Tafel plot often shows deviation from ideal Tafel behavior Polarization curve for the cathodic process showing: 1. Activation polarization 2. Joint activationconcentration polarization 3. Mass transportlimited corrosion control 68 11/25/2020
Evans Diagrams Cathodic Control Anodic Control Mixed Control 69 11/25/2020
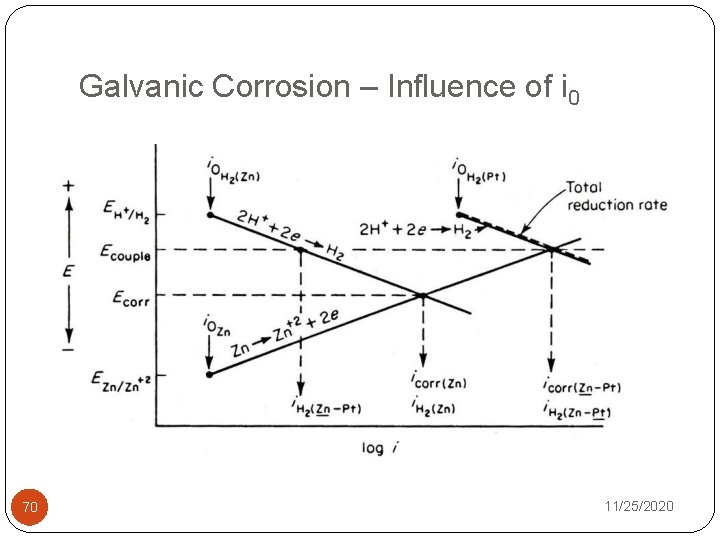
Galvanic Corrosion – Influence of i 0 70 11/25/2020