Voltammetric methods and electrodes Introduction Electroanalytical methods Interfacial

 Const. electrode potential coulometry")
 the electrode’s potential determines the analyte’s")
 The Electrode’s Potential Determines the Analyte’s Form Fig. Redox ladder diagram for Fe")
 Interfacial Concentrations May Not Equal Bulk Concentrations Fig. Concentration of Fe 3+ as")
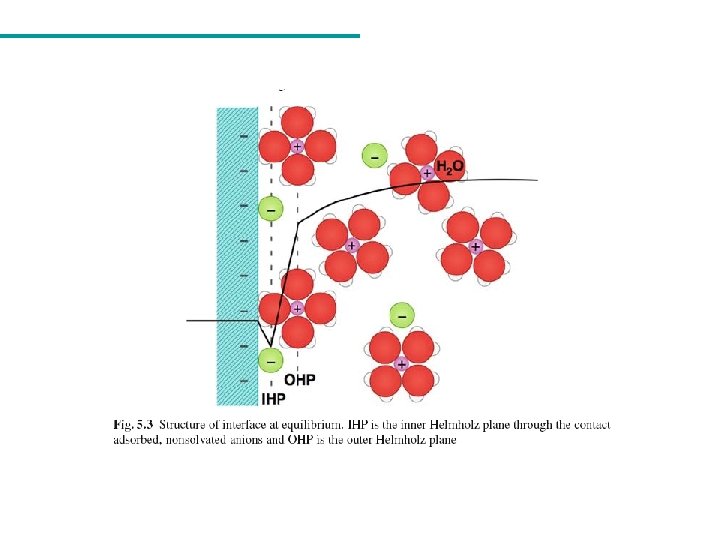
![Nernst Equation E = Eo + 0. 0592/n + log [ox]/[red] Fe 3+ +](https://slidetodoc.com/presentation_image/349438ad37e31581b1eda35581797a0a/image-6.jpg "Nernst Equation E = Eo + 0. 0592/n + log [ox]/[red] Fe 3+ +")
 We Cannot Simultaneously Control Both Current and Potential 5) Controlling and Measuring Current")

")

 O + ne R E = Eo` + 0. 0592/n")

")
 4 (5) Where ilc is limiting cathodic current and Cs. O is zero")

63 - + e Fe. II(CN)64 - (1) Fe. III(CN)63 - (2)")


 Representação esquemática da aplicação de potencial em voltametria de pulso diferencial. A")
 Forma de aplicação de potencial na voltametria de onda quadrada; (2) Voltamogramas")


 using a functionalized carbon nanotubes paste electrode modified")


")
 ( mol L-1) Sample Urine samples")

 Carbon")
 and (b); MWCNTs/PAH SEM image (c) and")


 e PER (PEROXIDADE) em")


 ü Ceramics ü Metals Metalic")
 Gold Carbon glassy (CG) Iridium Metallic")


 B) Figura 10: Micrographs of the Bi. FE A)")
: Palm.")


 for paraquat determination In 0. 1 mol L-1 HAC")

. Samples*")

 (2 -cloro-4 -etilenodiamino-6 isopropilamino-s-triazina) • Pertence a classe das triazinas")
 Figura 11 - Voltamograma obtido para uma solução de")
- Slides: 81
Voltammetric methods and electrodes
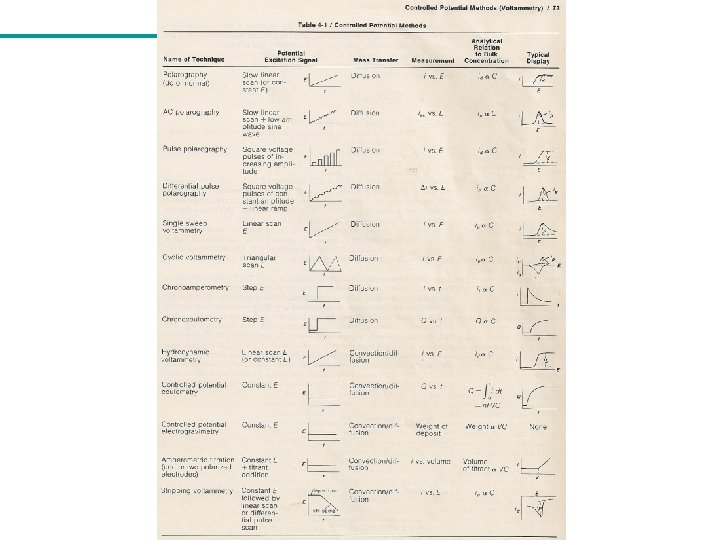
Introduction Electroanalytical methods Interfacial methods Static methods I~0 Potentiometry (E) Const. electrode potential coulometry (Q = ∫ 01 idt Bulk methods Dinamic methods I#0 Conductometry (G = 1/R) Potentiometric titrations (volume) Controlled potential Voltammetry [ I = f (E) ] Conductometric Titrations (volume) Constant current Coulometric Titrations (Q = It) Electrogravimetry (wt) Amperometric titrations (volume) Electrogravimetry (wt)
Five Important interrelated concepts to understand electrochemistry: (1) the electrode’s potential determines the analyte’s form at the electrode’s surface; (2) the concentration of analyte at the electrode’s surface may not be the same as its concentration in bulk solution; (3) in addition to an oxidation–reduction reaction, the analyte may participate in other reactions; (4) current is a measure of the rate of the analyte’s oxidation or reduction; and (5) we cannot simultaneously control current and potential. L. Faulkner, Understanding electrochemistry: some distinctive concepts, ” J. Chem. Educ. , 60, 262 (1983) ; P. T. Kissinger, A. W. Bott, Electrochemistry for the Non. Electrochemist, ” Current Separations, 20, 51 (2002)
1) The Electrode’s Potential Determines the Analyte’s Form Fig. Redox ladder diagram for Fe 3+/Fe 2+ and for Sn 4+/ Sn 2+ redox couples. The areas in blue show the potential range where the oxidized forms are the predominate species; the reduced forms are the predominate species in the areas shown in pink. Note that a more positive potential favors the oxidized forms. At a potential of +0. 500 V (green arrow) Fe 3+ reduces to Fe 2+, but Sn 4+ remains unchanged.
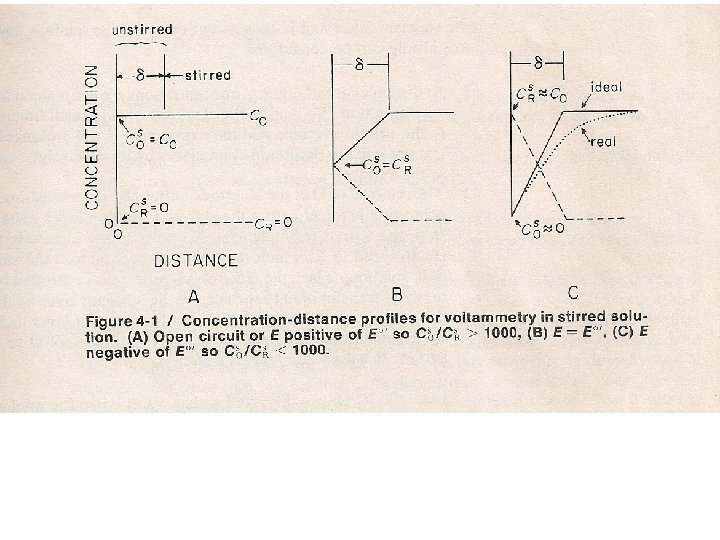
2) Interfacial Concentrations May Not Equal Bulk Concentrations Fig. Concentration of Fe 3+ as a function of distance from the electrode’s surface at (a) E = +1. 00 V and (b) E = +0. 500 V. The electrode is shown in gray and the solution in blue.
Nernst Equation E = Eo + 0. 0592/n + log [ox]/[red] Fe 3+ + e Fe 2+ E = Eo + 0. 0592/1 + log [Fe 3+]/[Fe 2+] 3) The Analyte May Participate in Other Reactions Fe 3+ + OH- Fe. OH 2+
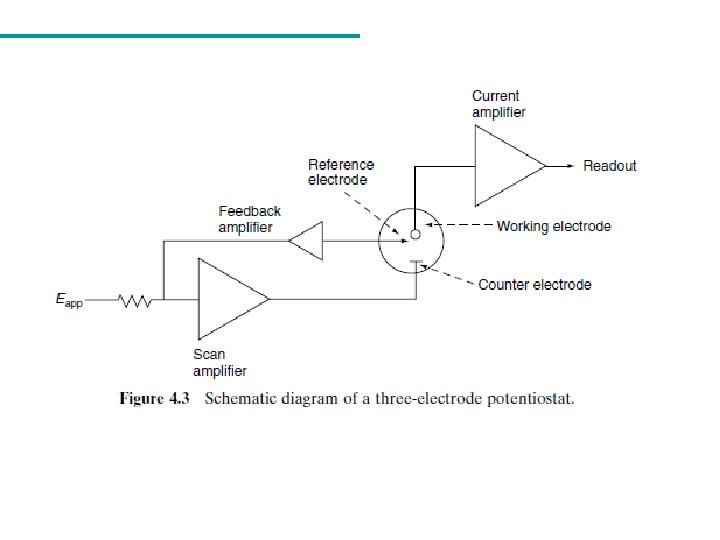
4) We Cannot Simultaneously Control Both Current and Potential 5) Controlling and Measuring Current and Potential
Controlled Potential Methods (Voltammetry)
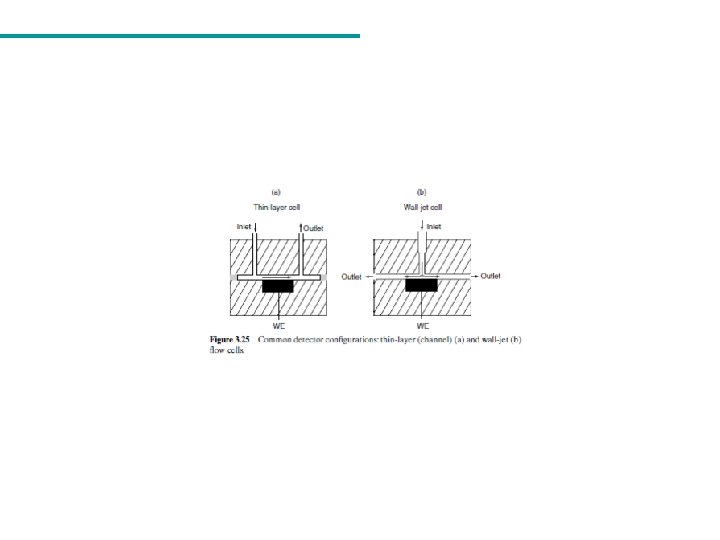
Fig. Flow patterns and regions of interest near the work electrode in hydrodynamic voltammetry
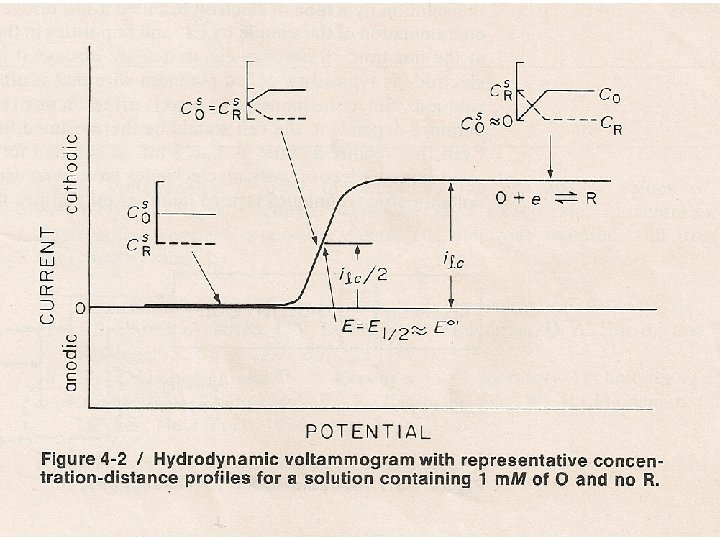
Controlled Potential Methods (Voltammetry) O + ne R E = Eo` + 0. 0592/n + log Cs. O / Cs. R (1) (2) where E = potential applied to electrode (m. V) Eo`= formal reduction potential of the couple vs Eref n = number of electrons in reaction (1) Cs. O = surface concentration of species O Cs. R = surface concentration of species R
Table. Relationship of E to surface concentrations# E, m. V Cs. O / Cs. R 236 10, 000/1 177 1, 000/1 118 100/1 59 10/1 0 1/1 -59 1/10 -118 1/100 -177 1/1, 000 -236 1/10, 000 For a reversible system, n = 1, Eo`= V
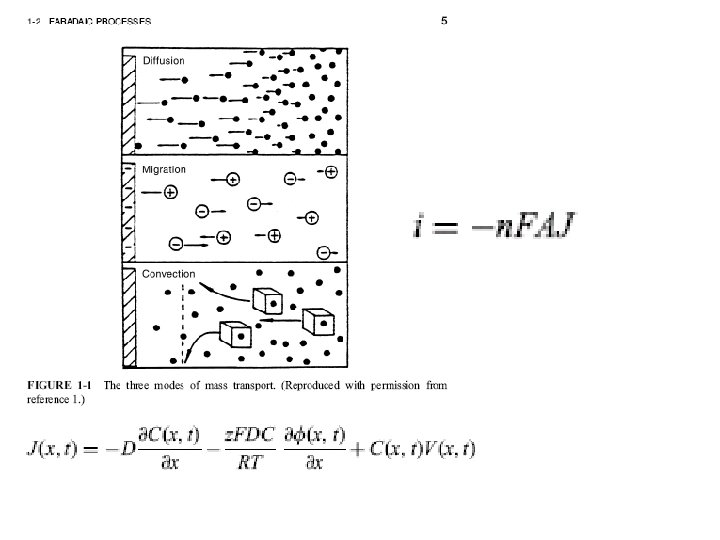
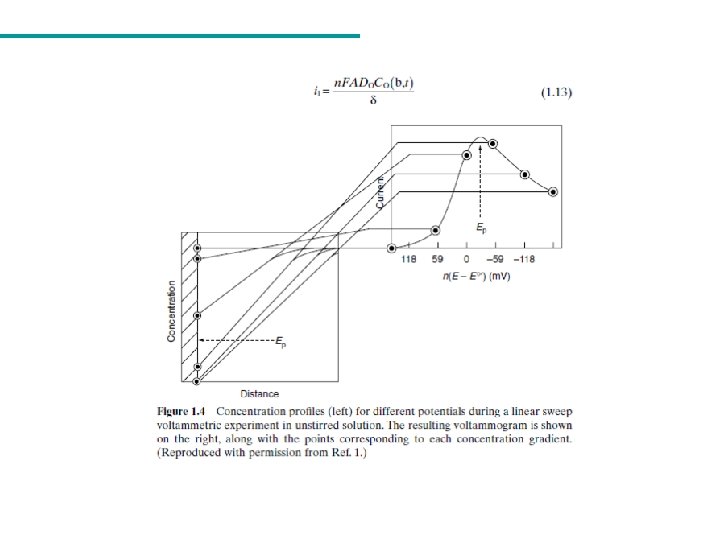
The current at an electrode is related to the flux (rate of mass transfer) of material to the electrode (3) Considering x = and C = CO – Cs. O Where = Nernst diffusion layer
(4) 4 (5) Where ilc is limiting cathodic current and Cs. O is zero
Cyclic Voltammetry
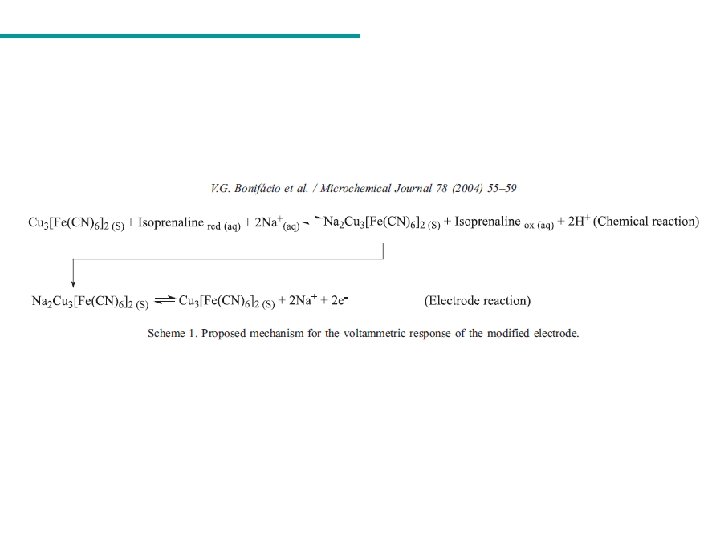
Fe. III(CN)63 - + e Fe. II(CN)64 - (1) Fe. III(CN)63 - (2)
Nernst Equation for a reversible system E = Eo` + 0. 0592/1 log [Fe. III(CN)63 -] / [Fe. II(CN)64 -] (3) Eo` = E 1/2 = (Epa + Epa)/ 2 (4) Ep = Epa – Epc = 0. 059/ n (5) The peak current for a reversible system is described by Randles. Sevcic Equation for the forward sweep for the first cicle: ip = 2. 69 105 n 2/3 A D 1/2 C (6) Where: ip = peak current (A); n = number of electrons; A = electrode area (cm 2); D = diffusion coefficient (cm 2 / s); = scan rate (V /s) and C = concentration (mol / cm 3)
Cronoamperometria
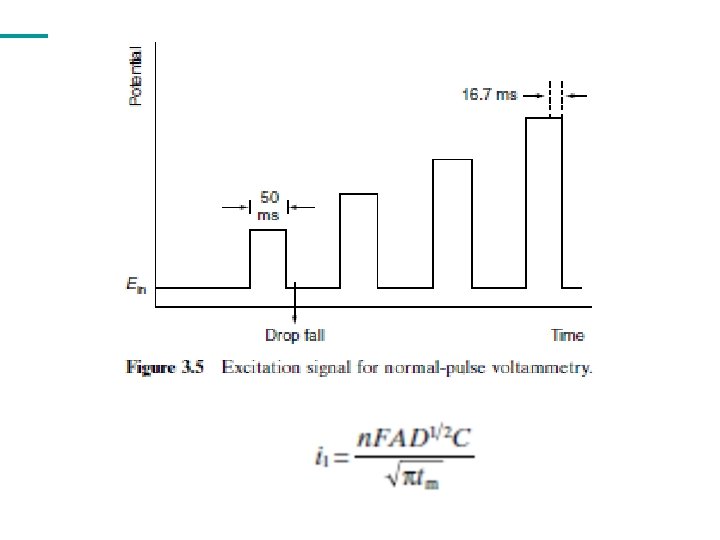
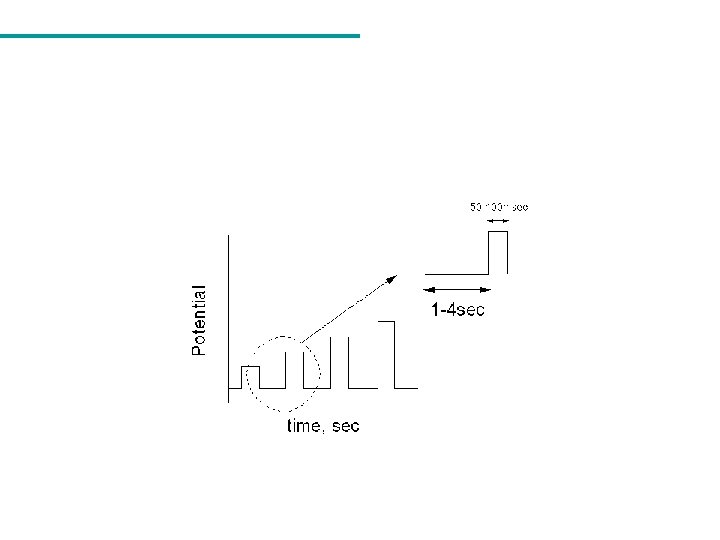
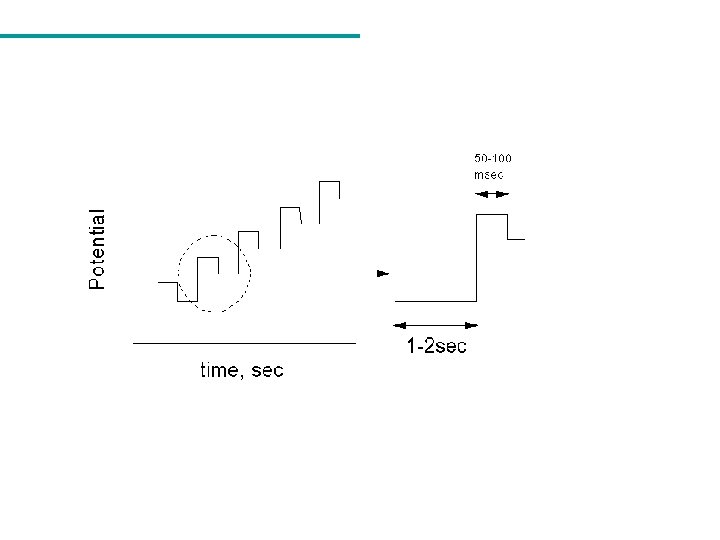
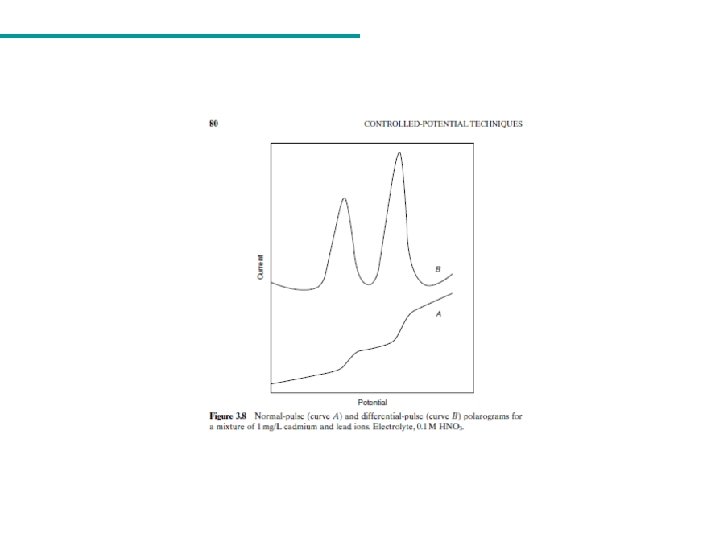
Figura (A) Representação esquemática da aplicação de potencial em voltametria de pulso diferencial. A corrente é amostrada em S 1 e S 2 e a diferença entre elas é registrada; (B) Voltamograma de pulso diferencial. SCHOLZ, F. , ed (2005). Electroanalytical methods. New York: Springer.
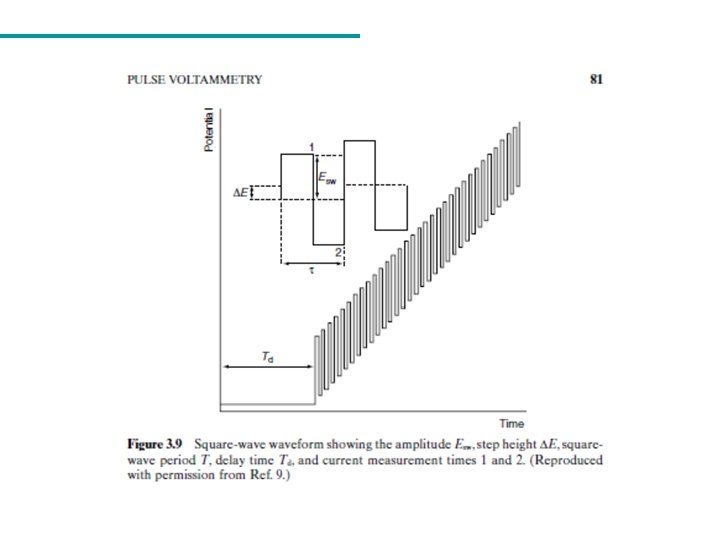
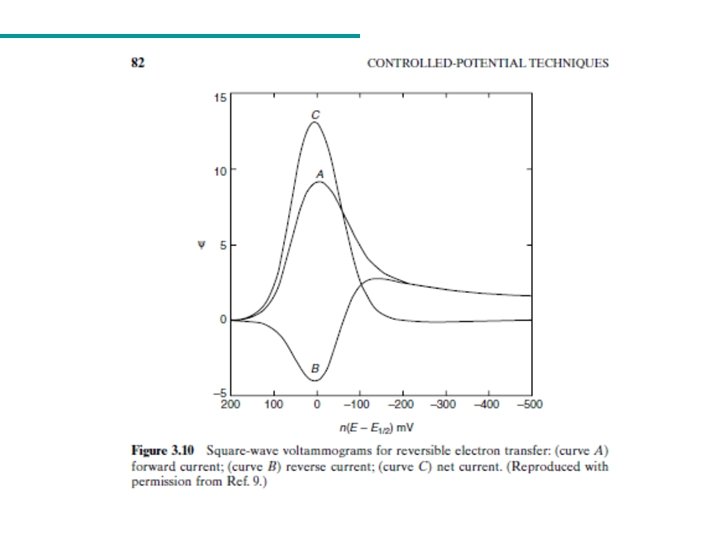
Figura (1) Forma de aplicação de potencial na voltametria de onda quadrada; (2) Voltamogramas de onda quadrada esquemáticos para um sistema reversível (A) e para um sistema totalmente irreversível (B). SOUZA, D. ; MACHADO, S. A. S. ; AVACA, L. A. Química Nova, Vol. 26, 81 -89, 2003. LOVRIC, M. ; KOMORSKY- LOVRIC, S. ; MIRCESKI, V. Square Wave Voltammetry. ed. (2007), Berlin: Springer.
Glassy carbon electrode Eletrodo de diamante dopado com boro 8000 ppm; 0, 72 cm 2 Eletrodos de carbono vítreo da Tokai Carbon Co
Approximate potential ranges for platinum, mercury, carbon and boro-doped diamond electrodes 0 3. 0 -3. 0 1 M H 2 SO 4 1 M Na. OH Pt 1 M H 2 SO 4 1 M KCl Hg 1 M Na. OH 1 M HCl. O 4 C 0. 1 M KCl 0. 5 M H 2 SO 4 - 1. 5 +2. 5 BDD
Glassy carbon electrode application
Aplicação de EQM em sistema FIA Eletrodo base: Eletrodo de carbono vítreo Preparação do Eletrodo: Ciclagem de potencial entre -0, 2 e 0, 6 V (vs. Ag/Cl) em solução de 1, 0 mmol L-1 Fe. Cl 3. 6 H 2 O e 10 mmol L-1 de K 3[Fe(CN)6] Funcionamento [Fe(CN)6]4 - [Fe(CN)6]3 - + AA [Fe(CN)6]3 - + e- [Fe(CN)6]4 - Comportamento voltamétrico do sistema
Aplicação de EQM em sistema FIA
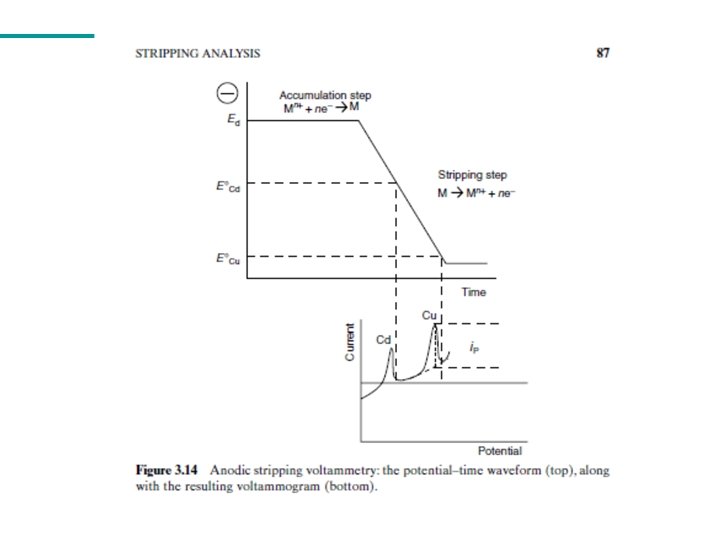
Anodic stripping voltammetric determination of copper(II) using a functionalized carbon nanotubes paste electrode modified with crosslinked chitosan Janegitz, B. C. , Marcolino-Junior, L. H. , Campana-Filho, S. P. , Faria, R. C. , Fatibello -Filho, O. Sensors and Actuators B, 142, 260 (2009)
Comparison: with and without carbon nanotube functionalization Anodic stripping voltammetry • 80 % CNTs (w/w) + 20 % nujol (w/w) • -0. 2 V for 270 s • 25 m. V (A) Carbon Nanotubes Functionalized s-1 (B) Figure XX - Linear voltammograms obtained with electrodes containing functionalized nanotubes not (A) and functionalized (B), in 0. 1 mol L-1 Na. NO 3 solution in the presence of Cu 2 + 9. 0 x 10 -5 mol L-1. 49
Anodic stripping voltammetry • -0. 2 V por 270 s • 25 m. V s-1 EPNM-QTS-ECH Figura XX -. Stripping voltammetry for EPN (A), EPNM-QTS (B), EPNM-QTS-GA (C) and EPNM-QTS-ECH (D) in 0. 1 mol L-1 Na. NO 3 solution in the presence of Cu 2 + 9. 0 x 10 -5 mol L-1. , = 25 m. V s-1, a 25ºC. 50
Analytical Curve Figura XX - Voltammograms obtained for the construction EPNM-QTS-ECH with 15% (w/w) QTS-ECH in 0. 05 mol L-1 Na. NO 3 solution. Figura XX - Analytical curve: • 7. 93 x 10 -8 a 1. 6 x 10 -5 mol L-1 L D =1. 06 x 10 -8 mol L-1 , LQ= 7. 93 x 10 -8 mol L-1 RSD= 3. 12%
Determination of Cu 2+ Concentration de Cu (II) ( mol L-1) Sample Urine samples Industrial Waste Method Erro relativo % comparative* proposed 0. 50 ± 0. 03 0. 52 ± 0, 09 4, . 0 2. 4 ± 0. 2 2. 3 ± 0. 1 -4. 1 3. 5 ± 0. 2 3. 6 ± 0. 1 1. 0 10. 7 ± 0. 2 11. 1 ± 0. 1 3. 6
Voltammetric determination of ciprofibrate using a glassy carbon electrode modified with functionalized carbon nanotube within a poly (allylamine hydrochloride) film o The ciprofibrate is a fibrate and present Antilipemic effect (lipid lowering); o Fibrates are indicated for patients who, after tests confirmed that the increase in endogenous triglecirideos is due to poor nutrition; o A possible interest in determining the ciprofibrate addition to quality control of drugs; Figure XXX - Ciprofibrate molecular estructure.
Functionalization of MWCNTs in acid solution (H 2 SO 4/HNO 3 3: 1) Carbon nanotubes dispertion in PAH solution [dispertion]=1 mg m. L-1 Film formation on the elcetrode by casting technique (20 μL)
Figure XX - PAH SEM images (a) and (b); MWCNTs/PAH SEM image (c) and (d)
Analytical curve Linear equation: i= -0. 700 + 4. 75 x 104 x C Concentration range: 13. 3 to 132 mol L-1 Detection Limit: 8. 34 mol L-1 Figure XX - Analytical curve obteined for ciprofibrate determination in phosphate buffer solution 0, 01 mol L-1 by VPD. = 12 m. V s-1, A= 60 m. V, t= 100 ms
Table XX - Ciprofibrate determination in pharmaceuticals formulations using GCEMWCNTs/PAH and standard method Sample Label value (mg) DPV HPLC method REc 1 A 100 ± 3 98± 5 2 B 100 99 ± 4 100± 7 -1 C 100 99 ± 6 100± 4 -1 D 100 ± 6 104± 2 -4 REc 1 = 100 x (VPD value – Reference method value) / Reference method value
Frutas e vegetais empregados como fontes da PFO (POLIFENOL OXIDASE) e PER (PEROXIDADE) em bioreatores e biossensores. Abacate (Persea americana) Abobrinha (Cucurbita pepo) Alcachofra (Cynara scolymus L. ) Berinjela Cara Batata inglesa (Solanum tuberosum) (Solanum melongena) (Dioscorea bulbifera) Jaca (Artocarpus integrifolia L. ) Mandioca (Manihot utilissima) Nabo (Brassica campestre ssp. ) Banana (Musa paradisiaca) Coco (Cocus nucifera L. ) Pêssego (Prunus persica) Batata doce (Ipomoea batatas L. Lam. ) Inhame (Alocasia macrorhiza) Rabanete (Raphanus sativus)
Enzimas São proteínas que agem como catalisadores biológicos: enzima Composto A Composto B Centro ativo ou sítio catalítico Não há consumo ou modificação permanente da enzima
Emil Fisher, década 50 Modelo chave-fechadura E e S se deformam quando em contato (alteração conformacional), para otimizar o encaixe Daniel Kosland, 1970 Modelo Encaixe induzido
Biossensor para glicose - Radiometer®
Fig. Esquema de um biossensor PFO
Screen-printed electrodes Low cost Portability Practicality 64
Screen-printed electrodes “screen-printed” or “silk-screen” Technology ü the possibility of mass production ü Extremely low cost ü Simplicity ü Complete electrochemical system Referen Count er ce Work Figura 5: Struture of screen printed electrodes 65
Screen-printed electrodes Substrates Work electrode ü Plastic materials (Polyester) ü Ceramics ü Metals Metalic films Nanoparticles • Addition Carbon nanotubes • Deposition Enzymes Polymers Complexation agents 66
New Materials Carbon nanotubes Copper Boron-doped diamond (BDD) Gold Carbon glassy (CG) Iridium Metallic films Antimony etc Bismuth Etc. 67
Bismuth film 2002 Vytras et al. Pauliukaite et al. 2003 Wang et al. Carbon paste modified with Bi 2 O 3 Bismuth film electrode (Bi. FE) electrodeposited in CG 68
Bismuth film • Good cathodic potential window • Interference of dissolved oxygen is minimal • Low toxicity • Electrochemical behavior is similar to that of mercury 69
Bismuth film electrode MEV-FEG A) B) Figura 10: Micrographs of the Bi. FE A) 10000 x B) 50000 x 70
Bismuth film determination A electrode for anodic stripping SWV lead B C (A): Palm. Sens and (B): Drop. Sens potentiostats and (C) Bi. SPE preparation
Confecção do minissensor 120 °C durante 200 s Fe. Cl 3 0, 50 mol L-1 em meio de HCl 0, 10 mol L-1 durante 15 -20 minutos. 72
Bismuth film electrode tt-type connector for printers
Bismuth redox process I Bi 3+ + 3 e. Bi 0 II Bi 3+ Bi 0 + 3 e- -0. 30 V 0. 08 V Figura 7: Cyclic voltammogram for 0. 02 mol L-1 Bi(NO 3)3 in 0. 10 mol L 1 acetate buffer (p. H 4, 5) solution as electrolyte support; the work electrode is a platinum foil and scan rate of 10 m. V s-1. Filme de bismuto ü-0. 18 V vs. Ag/Ag. Cl (3. 0 mol L-1 KCl) during 200 s ü 0. 02 mol L-1 Bi(NO 3)3, 1. 0 mol L-1 HCl in 0. 15 mol L-1 Sodium citrate. 74
Determination of lead Anodic stripping voltammograms of 9. 9 x 10 -8 – 8. 3 x 10 -6 lead (LD of 5. 8 x 10 -8 M) in 0. 1 M acetate buffer (p. H 4. 5), using square-wave mode. Deposition at 1. 1 V for 2 min; pulse amplitude of 28 m. V; increment of potential of 3 m. V and frequency of 15 Hz.
Bismuth film electrode (Bi. FE) for paraquat determination In 0. 1 mol L-1 HAC p. H 4, 5, using differential pulse voltammetry. Figueiredo-Filho, L. C. et al, Electroanalysis, 22, 1260 (2010)
DPV para determinação de Paraquat Besides of paraquat can be determined simultaneously Cd 2+ e Pb 2+.
Determination of PQ in six natural water samples by BIFE and HMDE (reference). Samples* /µ mol L-1 *The HMDE BIFE ER (%) A 1 59. 03 ± 0. 06 58. 73 ± 0. 03 -0. 51 A 2 58. 74 ± 0. 01 59. 23 ± 0. 00 0. 84 A 3 58. 35 ± 0. 03 57. 41 ± 0. 02 -1. 61 A 4 29. 36 ± 0. 08 29. 56 ± 0. 03 0. 68 A 5 29. 23 ± 0. 05 27. 97 ± 0. 02 -4. 31 A 6 27. 95 ± 0. 05 29. 51 ± 0. 02 5. 58 SD (±) was calculated from three replicates.
Confecção do minissensor Figura- Etapas da confecção do minissensor Filme de bismuto ü-0, 18 V vs. Ag/Ag. Cl (KCl 3, 0 mol L-1) durante 200 s üBi(NO 3)3 0, 02 mol L-1, HCl 1, 00 mol L-1 e citrato de sódio 0, 15 mol L-1 Cola de prata üBright Silver Epoxy (BSE) + Gray Silver Hardener (GSH). Após a aplicação na superfície de cobre esperou-se 24 horas para a cura da cola 79
Atrazina • Atrazina (ATZ) (2 -cloro-4 -etilenodiamino-6 isopropilamino-s-triazina) • Pertence a classe das triazinas • Composto polar, fracamente básico de coloração branca Figura. Fórmula estrutural da Atrazina 80
Comportamento eletroquímico da Atrazina (ATZ) Figura 11 - Voltamograma obtido para uma solução de Atrazina 4, 00 x 10 -5 mol L-1, utilizando tampão acetato 0, 10 mol L-1, p. H *4, 5 em 15 % v/v de etanol como eletrólito suporte. * p. H condicional 81