Descent with Modification A Darwinian View of Life


 � � DID NOT BELIEVE ORGANISMS CHANGED OVER TIME")

 � � DEVELOPED BINOMIAL NOMENCLATURE WITH A “NESTED” CLASSIFICATION")

 � �OLDER THE STRATUM")

 Scottish Geologist � Explain geologic features by gradual mechanisms")
 � Principle of Uniformitarianism �Mechanisms of change are constant")


 � EVOLUTION HAPPENS BECAUSE ORGANISMS INATELY WANT TO BECOME MORE")
")


 Insecticide & drug resistance �insecticide didn’t kill")


- Slides: 105
Descent with Modification: A Darwinian View of Life
3 key observations about life 1. 2. 3. Striking ways organisms are suited to their environment Unity of living things(so many common features) Rich diversity of life
EVOLUTION DESCENT WITH MODIFICATION
EVOLUTION A CHANGE in the GENETIC COMPOSITION of a POPULATION from GENERATION to GENERATION
EVOLUTION � 1. CAN BE VIEWED IN 2 WAYS A PATTERN � 2. OBSERVATIONS FROM NATURAL WORLD A PROCESS � MECHANISMS THAT PRODUCED THE OBSERVED PATTERNS
ARISTOTLE (384 – 322 BCE) � � DID NOT BELIEVE ORGANISMS CHANGED OVER TIME (some Greeks did) Viewed organisms as fixed: could be arranged on ladder from least complex most complex
SCALAE NATURAE
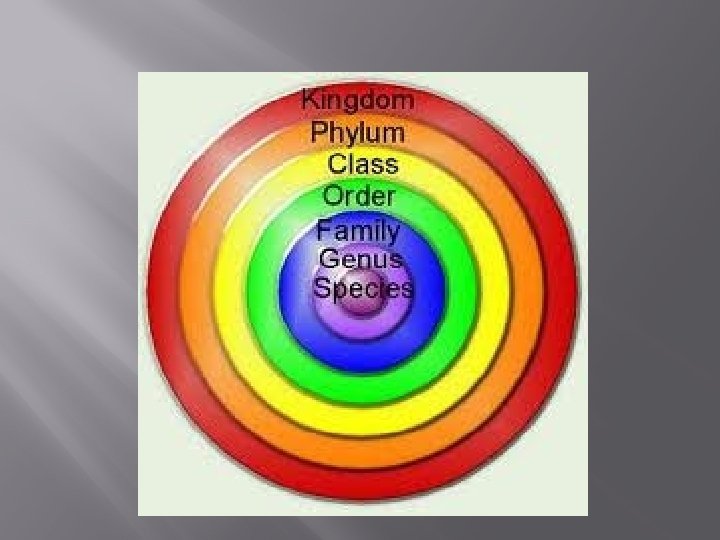
CAROLUS LINNAEUS (1701 – 1778) � � DEVELOPED BINOMIAL NOMENCLATURE WITH A “NESTED” CLASSIFICATION SYSTEM
LINNAEUS CLASSIFICATION SYSTEM
PALEONTOLOGY STUDY OF FOSSILS � GEORGES CUVIER (1769 – 1832) � �OLDER THE STRATUM OF SEDEMENTARY ROCK THE OLDER & MORE DISSIMILAR THE FOSSILS WERE TO CURRENT LIFE �NEW SPECIES APPEARED, SOME DISAPPEARED
GEORGES CUVIER CATASTOPHISM: EVENTS IN THE PAST OCCURRED SUDDENLY & WERE CAUSED BY DIFFERENT MECHANISMS THAN SEEN NOW
JAMES HUTTON (1726 – 1797) Scottish Geologist � Explain geologic features by gradual mechanisms still going on now (gradualism) �
CHARLES LYELL (1797 – 1875) � Principle of Uniformitarianism �Mechanisms of change are constant over time
Hutton & Lyell’s ideas influenced Darwin � Both indicated Earth had to be much older than previously believed � Darwin reasoned: slow & subtle processes could produce biological changes �
Lamarck’s Hypothesis of Evolution � 1 st to propose mechanism of evolution �Parts of body used the most become larger, stronger; parts not used deteriorate �Inheritance of Acquired Traits
What does “Inheritance of Acquired Characteristics” Mean? � Example: A population of giraffes all had short necks and were able to reach their food. However, when they were forced to move to an area with taller trees, they could no longer reach their food. So they stretched and stretched until they could reach. Then when Mr. & Mrs. Giraffe had babies, their babies had long necks because their parents had acquired long necks.
Just because… � Louis the Short-Necked Giraffe
LAMARCK (1744 – 1829) � EVOLUTION HAPPENS BECAUSE ORGANISMS INATELY WANT TO BECOME MORE COMPLEX
CHARLES DARWIN (1809 -1882)
VOYAGE of the BEAGLE 1831 - 1836
Darwin’s Observations Plants & animals in temperate zones of SA closely resembled plants & animals of temperate regions of Europe � Fossils in SA resembled living organisms in SA �
GALPÁGOS
Darwin’s Observations: Descent with Modification � Took note of many adaptations saw adaptations & the origin of a new species as closely related processes
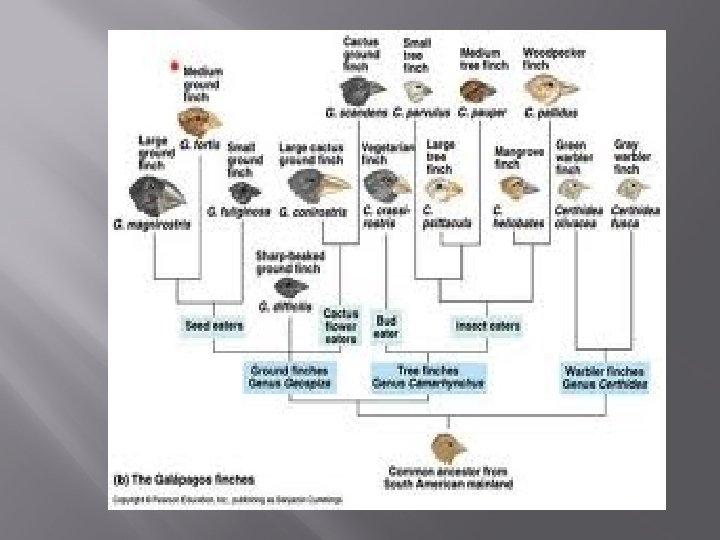
Darwin’s Finches � � 14 different species each clearly adapted to a specific niche all similar to finches on mainland SA (common ancestor)
Darwin’s Theory � Proposed that over long periods of time NATURAL SELECTION could cause an ancestral species to give rise to 2 or more descendant species with massive amounts of data/evidence
Natural Selection � � � Competition for limited resources results in differential survival. � Individuals with more favorable phenotypes are more likely to survive and produce more offspring, thus passing traits to subsequent generations. Evolutionary fitness is measured by reproductive success. Genetic variation and mutation play roles in natural selection. � A diverse gene pool is important for the survival of a species in a changing environment. Environments can be more or less stable or fluctuating, and this affects evolutionary rate and direction; different genetic variations can be selected in each generation.
SURVIVAL of the FITTEST Adaptations are genetic variations that are favored by selection and is manifested as a trait that provides an advantage to an organism in a particular environment.
Over time natural selection increases the match between organisms & their environment
When the environment changes natural selection may result in adaptations that give rise to a new species
Impact on Natural Selection � In addition to natural selection, chance and random events can influence the evolutionary process, especially for small populations.
Causes of Evolution of a Population � Genetic Drift � Bottleneck � � effect, flounder effect Gene Flow Mutations Nonrandom Mating Natural Selection
Genetic Drift � Chance events changing frequency of traits in a population � not adaptation to environmental conditions not selection � founder effect small group splinters off & starts a new colony � bottleneck some factor (disaster) reduces population to small number & then population recovers & expands again but from a limited gene pool
Gene Flow � the movement of alleles into or out of a population via migration of fertile individuals or gametes between populations
Mutations � changes in genetic material; increasing diversity either at one loci or several
Nonrandom Mating � � � Rarely is mating completely random in a population. Usually individuals mate with individuals in close proximity. This promotes inbreeding and could lead to a change in allelic proportions favoring individuals that are homozygous for particular traits
Natural Selection � traits that improve survival or reproduction will accumulate in the population adaptive change
Forces of evolutionary change � Artificial Selection � Selecting and breeding individuals that possess desired traits (human impact on variation)
Natural Selection in Action � Natural selection can happen rapidly and observed directly � guppies, � Drug-Resistant HIV Also observed by researchers in the fields of anatomy, embryology, molecular biology, biogeography, and paleontology � homologous and vestigial structures � molecular homologies: same DNA, RNA; universal genetic code � biogeographically distribution of organism � comparative data from biochem, molecular biology and cell biology support the oldest known fossils are prokaryotes
5 Types of Selection Acts to select the individuals that are best adapted for survival and reproduction � � � Stabilizing Disruptive (Diversifying) Directional Sexual Artificial
� Stabilizing selection: operates to eliminate extreme expressions of a trait when the average expression leads to higher fitness. (Birth Weights) � Directional selection: An extreme trait makes an organism more fit making one phenotype replace another (Peppered Moths/Antibiotics) � Disruptive selection: a process that splits a population into two groups resulting in balanced polymorphism (Lake Erie Water Snakes)
Effects of Selection � Changes in the average trait of a population DIRECTIONAL SELECTION STABILIZING SELECTION DISRUPTIVE SELECTION giraffe neck horse size human birth weight rock pocket mice
� Natural selection in action (Directional Selection) Insecticide & drug resistance �insecticide didn’t kill all individuals �resistant survivors reproduce (selective advantage) �resistance is inherited �insecticide becomes less & less effective
Sexual Selection � Acting on reproductive success � attractiveness to potential mate � fertility of gametes � successful rearing of offspring � Acts in all sexually reproducing species � the traits that get sexual dimorphism � influences you mates Survival doesn’t matter if you don’t reproduce! both morphology & behavior � can act in opposition to natural selection
Artificial selection This is not just a process of the past… It is all around us today
Artificial selection � Artificial breeding can use variations in populations to create vastly different “breeds” & “varieties” “descendants” of wild mustard “descendants” of the wolf
How do we know if a population is evolving? � Conditions for a population or an allele to be in Hardy-Weinberg equilibrium are: � (1) a large population size (no genetic drift) � (2) absence of migration � (3) no net mutations � (4) random mating � (5) absence of selection These conditions are seldom met. � Mathematical approaches are used to calculate changes in allele frequency, providing evidence for the occurrence of evolution in a population.
5 Agents of evolutionary change Mutation Gene Flow Genetic Drift Non-random mating Selection
Populations & gene pools � Concepts �a population is a localized group of interbreeding individuals � gene pool is collection of alleles in the population remember difference between alleles & genes! � allele frequency is how common is that allele in the population how many A vs. a in whole population
Evolution of populations � Evolution = change in allele frequencies in a population hypothetical: what conditions would cause allele frequencies to not change? � non-evolving population � REMOVE all agents of evolutionary change 1. very large population size (no genetic drift) 2. no migration (no gene flow in or out) 3. no mutation (no genetic change) 4. random mating (no sexual selection) 5. no natural selection (everyone is equally fit)
The Hardy-Weinberg Equation � enables us to calculate frequencies of alleles in a population � p 2 + 2 pq + q 2 = 1 or � p= dominant allele � q= recessive allele p+q=1 A a A AA Aa aa
Hardy-Weinberg equilibrium � Hypothetical, non-evolving population � preserves � allele frequencies Serves as a model (null hypothesis) � natural populations rarely in H-W equilibrium � useful model to measure if forces are acting on a population measuring evolutionary change G. H. Hardy mathematician W. Weinberg physician
Hardy-Weinberg theorem � Counting Alleles � assume 2 alleles = B, b � frequency of dominant allele (B) = p � frequency of recessive allele (b) = q frequencies must add to 1 (100%), so: p+q=1 BB Bb bb
Hardy-Weinberg theorem � Counting Individuals � frequency of homozygous dominant: p x p = p 2 � frequency of homozygous recessive: q x q = q 2 � frequency of heterozygotes: (p x q) + (q x p) = 2 pq frequencies of all individuals must add to 1 (100%), so: p 2 + 2 pq + q 2 = 1 BB Bb bb
H-W formulas � Alleles: p+q=1 B � Individuals: p 2 + 2 pq + q 2 = 1 BB BB b Bb Bb bb bb
Using Hardy-Weinberg equation population: 100 cats 84 black, 16 white How many of each genotype? p 2=. 36 BB q 2 (bb): 16/100 =. 16 q (b): √. 16 = 0. 4 p (B): 1 - 0. 4 = 0. 6 2 pq=. 48 Bb q 2=. 16 bb What assume Must are the genotype population frequencies? is in H-W equilibrium!
Using Hardy-Weinberg equation p 2=. 36 Assuming H-W equilibrium 2 pq=. 48 q 2=. 16 BB Bb bb p 2=. 20 =. 74 BB 2 pq=. 64 2 pq=. 10 Bb q 2=. 16 bb Null hypothesis Sampled data How do you explain the data?
PRACTICE SET
EVIDENCE OF EVOLUTION VIDEO
� � Scientific evidence of biological evolution uses information from geographical, geological, physical, chemical and mathematical applications. Molecular, morphological and genetic information of existing and extinct organisms add to our understanding of evolution. 1. 2. 3. 4. Fossils Morphological homologies Biochemical and genetic similarities Mathematical models
1. FOSSILS � Fossils can be dated by a variety of methods that provide evidence for evolution. � age of the rocks where a fossil is found � rate of decay of isotopes including carbon-14 � relationships within phylogenetic trees � mathematical calculations that take into account information from chemical properties and/or geographical data.
2. MORPHOLOGICAL HOMOLOGIES � Represent features shared by common ancestry. � EMBRYOLOGY � VESTIGIAL STRUCTURES � ANALOGOUS STURCTURES � MOLECULAR HOMOLOGIES
Homologous Structures: Embryology � Similarities in early stages of development suggest common ancestry �At some point in development all vertebrates have a tail
VESTIGIAL STRUCTURES � Vestigial structures are remnants of functional structures, which can be compared to fossils and provide evidence for evolution.
Analogous Features � are seen in species that share similar structures but not common ancestry
3. Molecular Homologies � Biochemical and genetic similarities, in particular DNA nucleotide and protein sequences, provide evidence for evolution and ancestry. � All life forms use DNA & RNA Genetic code is universal � Some human genes code for exact same protein as bacterial gene +/- have same function � Some organisms carry “vestigial genes”
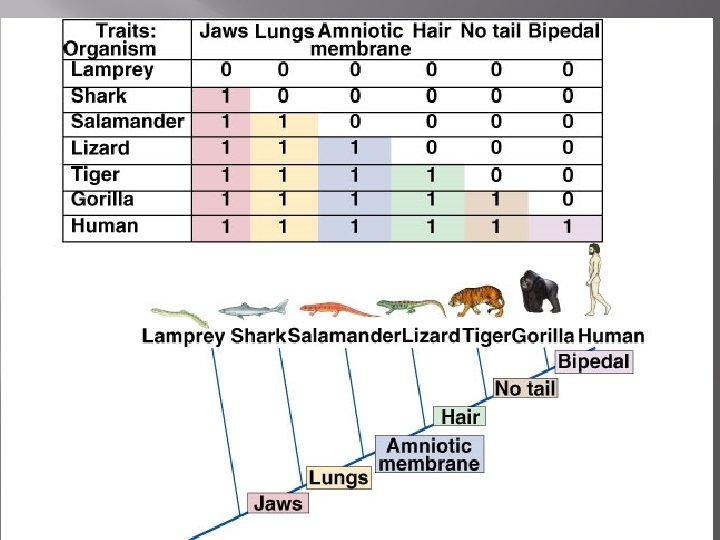
4. MATHEMATICAL MODELS � Phylogenetic Trees & Cladograms � Can organize organisms with shared characteristics in nested groups Deepest layer all living things share Each successive smaller group have their own unique homologies are hypotheses that summarize our current understanding of patterns of descent
Phylogenetic trees and cladograms � � � illustrate speciation that has occurred, in that relatedness of any two groups on the tree is shown by how recently two groups had a common ancestor. constructed from morphological similarities of living or fossil species, and from DNA and protein sequence similarities, by employing computer programs that have sophisticated ways of measuring and representing relatedness among organisms. dynamic (i. e. , phylogenetic trees and cladograms are constantly being revised), based on the biological data used, new mathematical and computational ideas, and current and emerging knowledge.
Phylogenetic Trees �Phylogeny - evolutionary history of a group �Phylogeny often represented as a phylogenetic tree 73
3 Important Definitions Shared Outgroup = an Shared Primitive derived Characters organism is characterswhich == characteristics shared only distantly related characters shared by all members ofisthe to others by the only someand group being compared. placed on of thethe members They represent evolutionary novelties that are unique to the immediate lineage being cladogram as a group. considered. comparison.
Constructing a Cladogram
Classification and Phylogeny What is a Primitive Shared Character? What is a Derived Shared Character? 76
Understanding phylogenies
Understanding phylogenies
Understanding phylogenies
Understanding phylogenies
Understanding phylogenies A CLADE is a grouping that includes a common ancestor and all the descendants (living and extinct) of that ancestor. Imagine clipping a single branch off the phylogeny — all of the organisms on that pruned branch make up a clade.
Understanding phylogenies Clades are nested within one another — they form a nested hierarchy. A clade may include many thousands of species or just a few. Some examples of clades at different levels are marked on the phylogenies above. . Notice how clades are nested within larger clades.
Understanding phylogenies 83
Cladogram Practice 2 1 Which green Which dot represents dot the most the recent common ancestor for B ancestor and C? C? A and
Cladogram Practice 2 1 Which part of of Which the diagram the represents unique history shared of A, B. B and C. of
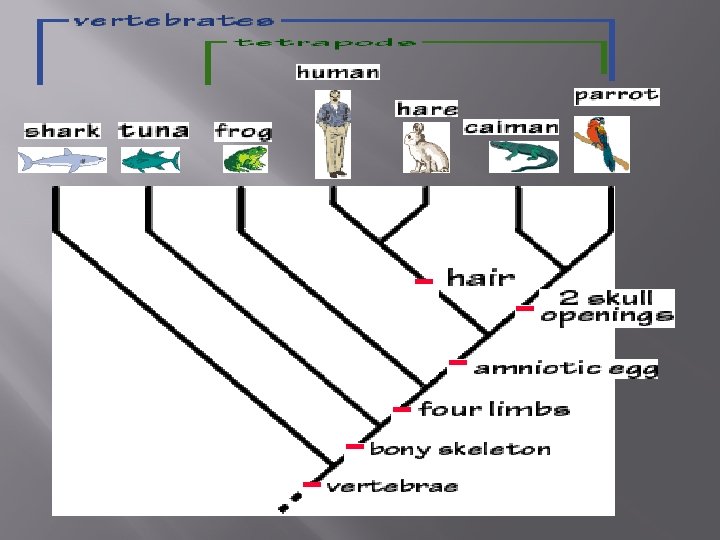
Cladogram Practice Look at the lineages of the three animals that are highlighted Which is more closely related to caimans a) Hares b) Parrots
Cladogram Practice
Cladogram Practice 5 6 3 2 1 Can you find the 4 common ancestor for all of them? Pick the number that represents the
Cladogram Practice A The shortlong REDred bar the top bar onatthe cladogram of the shows that cladogram feature 1 evolve shows that d organisms before the A, common B, and C ancestor of A inherited and C. feature 1.
Cladogram Practice Feature 2 evolved before the common ancestor of “B” and “C”, & is inherited by “B” and “C”. “A” does not have this feature
Cladogram Practice Feature 3 evolved in the lineage leading to organism C.
Cladogram Practice So, feature 1 provides evidence that A, B, and C are more closely related to each other than to other organisms, and feature 2 tells us that B and C are more closely related to each other than to A. Feature 3 is unique to C.
Cladogram Practice
Create a Cladogram
Life continues to Evolve � Speciation and extinction have occurred throughout the Earth’s history � Speciation rates can vary, especially when adaptive radiation occurs when new habitats become available. � Species extinction rates are rapid at times of ecological stress. Human impact on ecosystems and species extinction rates
Speciation and Reproductive Isolation � Speciation (anything that fragments a population and isolates a small group of individuals) may occur when two populations become reproductively isolated from each other � Speciation results in diversity of life forms � can be physically separated by a geographic barrier such as an ocean or a mountain range (ALLOPATRIC), or various pre-and post-zygotic mechanisms can maintain reproductive isolation and prevent gene flow (SYMPATRIC) � New species arise from reproductive isolation over time, which can involve scales of hundreds of thousands or even millions of years, or speciation can occur rapidly through mechanisms such as polyploidy in plants.
� Allopatric Speciation: caused by geographic isolation
� Sympatric Speciation: caused by anything besides geographic isolation � polyploidy: a cell has two or more complete sets of chromosomes � habitat isolation: two organisms live in the same area but rarely encounter one another � behavioral isolation: two species do not mate because of differences in courtship behavior � temporal isolation: populations may mate or flower at different seasons or different times of day � reproductive isolation: closely related species unable to mate because of a variety of reasons prezygotic barriers postzygotic barriers reproductive isolation
ORIGIN OF LIFE
There are several hypotheses about the natural origin of life on Earth, each with supporting scientific evidence. Scientific evidence supports the various models. 1. Primitive Earth provided inorganic precursors from which organic molecules could have been synthesized due to the presence of available free energy and the absence of a significant quantity of oxygen. 2. In turn, these molecules served as monomers or building blocks for the formation of more complex molecules, including amino acids and nucleotides. 3. The joining of these monomers produced polymers with the ability to replicate, store and transfer information. 4. These complex reaction sets could have occurred in solution (organic soup model) or as reactions on solid reactive surfaces. 5. The RNA World hypothesis proposes that RNA could have been the earliest genetic material.
Evidence providing support Geological evidence provides support for models of the origin of life on Earth. 1. The Earth formed approximately 4. 6 billion years ago (bya), and the environment was too hostile for life until 3. 9 bya, while the earliest fossil evidence for life dates to 3. 5 bya. Taken together, this evidence provides a plausible range of dates when the origin of life could have occurred. 2. Chemical experiments have shown that it is possible to form complex organic molecules from inorganic molecules in the absence of life. Molecular and genetic evidence from extant and extinct organisms indicates that all organisms on Earth share a common ancestral origin of life. 1. Scientific evidence includes molecular building blocks that are common to all life forms. 2. Scientific evidence includes a common genetic code.
The Fossil Record Shows: 1. 2. 3. past organisms differ from current ones many species have become extinct the evolutionary changes that have occurred in various groups of organisms
BIOGEOGRAPHY � � The GEOGRAPHIC DISTRIBUTION of ORGANISMS Influenced by: �Continental Drift 250 million yrs ago all land masses joined Pangea 200 million yrs ago split began 20 million yrs ago looked close to what we have today
Continental Drift � Understanding continental drift scientists look for fossil evidence explained by the movement of land masses