Chapter 2 Units of Measurement 2 1 Units


- Slides: 105

Chapter 2 Units of Measurement

2. 1 Units of Measurement • SI UNITS • Measurement is a part of daily activities. Hospitals record the weights of babies, gasoline pumps measure the volume of gasoline sold and signs on the road tell us how fast to drive. • Scientist need to report data that can be reproduced by other scientists, thus scientist adopted a system of standard units called the metric system. • In 1960 a group of scientist gathered and revised the metric system and called it the System Internationale d’ Unites, which is abbreviated SI.

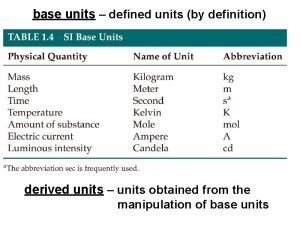
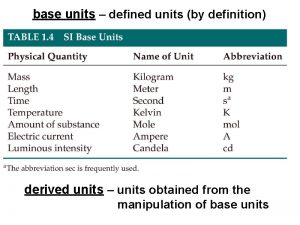
BASE UNITS • There are seven base units in SI. A base unit is defined based on an object or event in the physical world. • A base unit is independent of other units. Table 2 -1 lists the seven SI units, the quantities they measure and their abbreviations.

• Time: the SI base unit for time is the second (s). • The frequency of microwave radiation give off by a cesium-133 atom is the physical standard used to establish the length of a second.

• Length: The SI base unit for length is the meter (m). (A vacuum is a space containing no matter). • For distances between cities you would use kilometers, the diameter of a drill bit might be reported in millimeters. • mass, a measure of the amount of matter, it is measured in kilograms (kg). • There are 1000 grams in a kilogram.

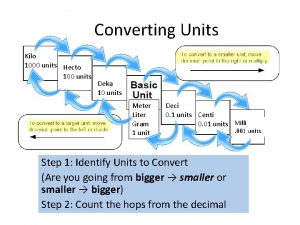
• ***To better describe the range of possible measurements scientists add prefixes to the base units. • This task is made easier because the metric system is a decimal system. The prefixes are based on multiples, or factors of ten. • These prefixes can be used with all SI units • (See table 2 -2)

B. SI Units Quantity Symbol Base Unit Abbrev. Length l meter m Mass m kilogram kg Time t second s Temp T Kelvin K Amount n mole mol Courtesy Christy Johannesson www. nisd. net/communicationsarts/pages/chem

• • SI Prefixes kilo(k) 1000 centi(c) milli- (m) 1/1000 deci- (d) 1/10 Also, 1 m. L = 1 cm 3 and 1 L = 1 dm 3 1/ 100

• • • Prefixes kilo k 1000 times deci d 1/10 centi c 1/100 milli m 1/1000 Micro 0. 000001 10 -6 Nano 0. 00001 10 -9 kilometer - about 0. 6 miles centimeter - less than half an inch millimeter - the width of a paper clip wire

Reporting Measurements • Using significant figures • Report what is known with certainty • Add ONE digit of uncertainty (estimation) Davis, Metcalfe, Williams, Castka, Modern Chemistry, 1999, page 46

Practice Measuring Timberlake, Chemistry 7 th Edition, page 7 0 cm 1 2 3 4 5 4. 5 cm 0 cm 1 2 3 4 5 4. 54 cm 0 cm 1 2 3 4 5 3. 0 cm

Practice • Choose three different metal samples • Measure to the highest accuracy a ruler allows their length(height) and diameter. • Divide diameter by 2 to get radius • V=πr 2 h • Calculate the volume of the three samples to what you believe is the correct number of sig figs. Do not lose these values

DERIVED UNITS • A unit that is defined by a combination of based units is called a derived unit, for example the SI unit for speed is meters per second (m/s). • volume is the space occupied by an object. The derived unit for volume is the cubic meter, which is represented by a cube whose sides are all one meter in length. The metric unit for volume equal to one cubic decimeter is a liter (L)

Instruments for Measuring Volume Graduated cylinder Syringe Buret Pipet Volumetric flask

• Density is a ratio that compares the mass of an object to its volume. This is why it is easier to lift a paper bag full of paper towels than it is to lift a paper bag full of soup cans. • The units for density are often grams per cubic centimeter (g/cm 3) • Density = mass/volume. Density can be used to help identify an unknown sample of matter • ****LOOK AT EXAMPLES*****

Density how tightly packed the particles are m Density = D V Typical units: g/cm 3 for solids g/m. L for fluids liquids and gases Glass: liquid or solid?

** Density of water = 1. 0 g/m. L = 1. 0 g/cm 3 Things that are “less dense” float in things that are “more dense. ” (And things that are “more dense” sink in things that are “less dense. ” D < 1 g/cm 3 D > 1 g/cm 3 D < 1 g/cm 3 The density of a liquid or solid is nearly constant, no matter what the sample’s temperature. Density of gases is highly dependent on temperature. D < 1 g/cm 3

Density Calculations 1. A sample of lead (Pb) has mass 22. 7 g and volume 2. 0 cm 3. Find sample’s density. m = 11. 35 D V 2. Another sample of lead occupies 16. 2 cm 3 of space. Find sample’s mass. V m=DV = 184 g

m 8. 2 cm 4. A 153 g rectangular solid has edge lengths 8. 2 cm, 5. 1 cm, and 4. 7 cm. Will this object sink in water? 5. 1 cm 4. 7 cm (Find object’s density and compare it to water’s density. ) V=lwh m D = 8. 2 cm (5. 1 cm)(4. 7 cm) V = 197 = 0. 78 cm 3 <1 No; it floats.

• Temperature – is a measure of how hot or cold the object is relative to other objects. • Hot and cold are qualitative terms. For quantitative descriptions of temperature you need measuring devices such as thermometers. • In a thermometer, a liquid expands when heated and contracts when cooled. The tube containing the liquid is narrow so small changes can be detected. Scientists use two temperature scales.

• The Celsius scale is based on the temperatures at which water freezes and boils because they were easy to reproduce. Freezing point was defined as zero and the boiling point was 100. Then the number was divided into 100 equal units, or degrees Celsius • *The Kelvin scale is the SI base unit of temperature. On the Kelvin scale, water freezes at about 273 K and boils at about 373 K. • It is easy to convert from the Celsius scale to the Kelvin scale. For example, the element mercury melts at -39°C and boils at 357°C. To convert this into kelvin you just add 273. • -39°C +273 = 234 K • To go from K to C you subtract 273.

compare

Units matter, don’t forget

Reading a Meniscus 10 m. L 10 line of s ight too proper line of sight oo ght t i s f ine o l graduated cylinder igh high 8 in read oh g to reading correct low 6 read ing too low

Units for Measuring Mass 1 kg = 2. 20 lb Timberlake, Chemistry 7 th Edition, page 3

Practice • Using a quad beam balance mass your three samples to the best accuracy you can. • Now use the volume and mass to calculate the density of each sample. • D=M/V • Use as many sig figs as you think is correct

2. 2 Scientific Notation and Dimensional Analysis • Scientific notation expresses numbers as a multiple of two factors: a number between 1 and 10; and ten raised to a power, or exponent. • The exponent tells you how many times the first factor must be multiplied by ten. • The mass of a proton is 1. 62762 x 10^-27 The mass of an electron is 9. 10939 x 10 ^-31. • When numbers larger than 1 are expressed in scientific notation, the power of ten is positive. • When numbers smaller than 1 are expressed in scientific notation, the power of ten is negative.

• Adding and Subtracting using scientific notation. When adding or subtracting numbers in scientific notation, you must be sure that the exponents are the same before doing the math. • Ex: (2. 70 x 107) + (15. 6 x 10⁶) + (0. 165 x 108) • *Because the first number is between 1 -10 leave it as is • *The second number should be increased by a power of ten so move the decimal place one place to the left (1. 56 x 107) • * The third number should be decreased by a power of ten, so move the decimal place on place to the right (1. 65 x 107) • *now you can add (2. 70 x 107) + (1. 56 x 107) + (1. 65 x 107) = 5. 91 x 107

• Increase by a power of 10, move decimal to left, decease by power of ten, move decimal to right

• Multiplying and dividing using scientific notation also involves two steps. But in these cases the quantities being multiplied or divided do not have to have the same exponent. • For multiplication you multiply the first factors, and then you add the exponents. • For division you divide the first factors then you subtract the exponent of the divisor from the dividend (top – bottom) • Multiplication add the exponents, division subtract the exponents

Scientific Notation -- used to express very large or very small numbers, and/or to indicate precision (i. e. , to maintain the correct number of significant figures) Form: (# from 1 to 9. 999) x 10 exponent 800 = 8 x 10² 2531 = 2. 531 x 10 = 2. 531 x 103 0. 0014 = 1. 4 10 10 = 1. 4 x 10– 3

Put in standard form. 1. 87 x 10– 5 = 0. 0000187 3. 7 x 108 = 370, 000 7. 88 x 101 = 78. 8 2. 164 x 10– 2 = 0. 02164 Change to scientific notation. 12, 340 = 1. 234 x 104 0. 369 = 3. 69 x 10– 1 0. 008 = 8 x 10– 3 1, 000, 000 = 1 x 10⁹ 6. 02 x 1023 = 602, 000, 000, 000

Dimensional Analysis • A conversion factor is a ratio of equivalent values used to express the same quantity in different units • A conversion factor is always equal to one • Because a quantity does not change when it is multiplied or divided by 1, conversion factors change the units of a quantity without changing its value. • If you measure out 12 teaspoons of vinegar, 4 tablespoons of vinegar or ¼ cup of vinegar, you will have the same amount of vinegar

• Dimensional analysis is a method of problem solving that focuses on the units used to describe the matter. • For example, converting temperature from degrees celsius to a temperature in kelvin, you focus on the relationship between the units in the two temperature scales. • Dimensional analysis often uses conversion factors.

How many cm are in 1. 32 meters? equality: 1 m = 100 cm (or 0. 01 m = 1 cm) conversion factors: 1 m ______ 100 cm or ( 100 cm ______ 1 m ) ______ cm = 132 cm 1. 32 m 100 1 m We use the idea of unit cancellation to decide upon which one of the two conversion factors we choose.

How many m is 8. 72 cm? equality: 1 m = 100 cm conversion factors: 1 m ______ 100 cm or ( 100 cm ______ 1 m ) 1 m 8. 72 cm ______ = 0. 0872 m 100 cm Again, the units must cancel.

How many kilometers is 15, 000 decimeters? ( )( 1 m 15, 000 dm ____ 10 dm ) 1 km ______ = 1. 5 km 1, 000 m

How many seconds is 4. 38 days? ( )( 24 h 4. 38 d ____ 1 d )( ) 60 min _____ 1 h 60 s ____ = 378, 432 s 1 min If we are accounting for significant figures, we would change this to… 3. 78 x 105 s

2. 3 How reliable are measurements • Accuracy and Precision- When scientists make measurements they evaluate the accuracy and the precision of the instruments. • accuracy refers to how close a measured value is than accepted value. • precision refers to how close a series of measurements is to one another.

Remember precise measurements may not be accurate

How good are the measurements? • Scientists use two words to describe how good the measurements are • Accuracy- how close the measurement is to the actual value • Precision- how well can the measurement be repeated, and to the uncertainty of the measurement.

Accuracy vs. Precision Good accuracy Good precision Poor accuracy Good precision Systematic errors: reduce accuracy (instrument) Poor accuracy Poor precision Random errors: reduce precision (person)

Differences • Accuracy can be true of an individual measurement or the average of several • Precision requires several measurements before anything can be said about it • examples

• To evaluate the accuracy of experimental data, you can calculate the difference between an experimental value and an accepted value. • The difference is called an error. • Scientists want to know what percent of the accepted value an error represents; error is the ratio of an error to an accepted value

• Students often assume that each measurement that they make in the laboratory is true and accurate. • Likewise, they often assume that the values that they derive through experimentation are very accurate. • However, sources of error often prevent students from being as accurate as they would like. Percent error calculations are used to determine how close to the true values, or how accurate, their experimental values really are.

• The value that the student comes up with is usually called the observed value, or the experimental value. • A value that can be found in reference tables is usually called the true value, or the accepted value. • The percent error can be determined when the true value is compared to the observed value according to the equation below:

Percent Error • Indicates accuracy of a measurement your value accepted value Courtesy Christy Johannesson www. nisd. net/communicationsarts/pages/chem

Percent Error • A student determines the density of a substance to be 1. 40 g/m. L. Find the % error if the accepted value of the density is 1. 36 g/m. L. % error = 2. 9 % Courtesy Christy Johannesson www. nisd. net/communicationsarts/pages/chem

• Ex. 1 A student measures the mass and volume of a piece of copper in the laboratory and uses his data to calculate the density o the metal. According to his results, the copper has a density of 8. 37 g/cm 3. Curious about the accuracy of his results, the student consults a reference table and finds that the accepted value for the density of copper is 8. 92 g/cm 3. What would be the student's percent error?

• Solution - Step 1. Determine which values are known. • The students result, or the observed value = 8. 37 g/cm 3. • The accepted, or true value = 8. 92 g/cm 3.

• Step 2. Substitute these values in the percent error calculation, as shown below: • Percent error = (experimental – literature) ---------------- * 100 literature • Percent error = • (8. 37 g/cm 3 – 8. 92 g/cm 3)/ 8. 92 g/cm 3 * 100

• Step 3. Solve for the unknown, and round to correct significant digits. • Percent Error = • -6. 17%

Practice • Using google/Wikipedia determine the actual density of the metals you calculated the density for. • Use this value to determine your own experimental error.

• Significant figures • – Scientists indicate the precision of measurements by the number of digits they report. • A value of 3. 52 is more precise than a value of 3. 5 g. • The digits that are reported are called significant figures. They include all known digits plus one estimated digit

• Each recorded measurement has a certain number of significant digits. • Calculations done on these measurements must follow the rules for significant digits. • The significance of a digit has to do with whether it represents a true measurement or not. • Any digit that is actually measured or estimated will be considered significant. • Placeholders, or digits that have not been measured or estimated, are not considered significant. The rules for determining the significance of a digit will follow.

Rules For Significant Digits from 1 -9 are always significant. Zeros between nonzero digits are always significant One or more additional zeros to the right of the decimal place ARE significant. Zeros used solely for spacing the decimal point (placeholders) are not significant. Counting numbers and defined constants have an infinite number of significant figures.

• Recognizing significant digits will become much easier over time, as you continue to practice the rules. • Below are some examples, which show the number of significant digits in a group of numbers, and an explanation why the digits are significant.

Pacific Atlantic Present Absent If the decimal point is absent, start at the Atlantic (right), find the first non zero, and count all the rest of the digits 230000 1750

Pacific Atlantic Present Absent If the decimal point is PRESENT, start at the Pacific (left), find the first non zero, and count all the rest of the digits 0. 045 1. 2300

• . Examples # of sig. dig comment 453 kg 3 All non zero digits are always significant 5057 L 4 Zeros between 2 sig dig. Are significant 5. 00 3 Additional zeros to the right of the decimal and a sig. dig. Are significant 0. 007 1 Placeholders are not significant

Sig figs. • How many sig figs in the following measurements? • 458 g l 405. 0 g • 4085 g l 4050 g • 4850 g l 0. 450 g • 0. 0485 g l 4050. 05 g • 0. 004085 g l 0. 0500060 g • 40. 004085 g

Significant Figures • Indicate precision of a measurement. • Recording Sig. Figs. – Sig. figs. in a measurement include the known digits plus a final estimated digit 1. 19 cm 0 1 2 3 4 Centimeters Courtesy Christy Johannesson www. nisd. net/communicationsarts/pages/chem 5

Significant Figures • Counting Sig Figs – Count all numbers EXCEPT: • Leading zeros -- 0. 0025 • Trailing zeros without a decimal point -- 2, 500 Courtesy Christy Johannesson www. nisd. net/communicationsarts/pages/chem

Significant Figures Counting Sig. Figs. Examples 1. 23. 50 4 sig figs 2. 402 3 sig figs 3. 5, 280 3 sig figs 4. 0. 080 2 sig figs Courtesy Christy Johannesson www. nisd. net/communicationsarts/pages/chem

Significant Figures • Calculating with Sig Figs – Multiply/Divide - The # with the fewest sig figs determines the # of sig figs in the answer. (13. 91 g/cm 3)(23. 3 cm 3) = 324. 103 g 4 SF 324 g Courtesy Christy Johannesson www. nisd. net/communicationsarts/pages/chem

Significant Figures • Calculating with Sig Figs (con’t) – Add/Subtract - The # with the lowest decimal value determines the place of the last sig fig in the answer. 224 g 3. 75 m. L + 130 g + 4. 1 m. L 7. 85 m. L 7. 9 m. L 354 g 350 g Courtesy Christy Johannesson www. nisd. net/communicationsarts/pages/chem

Significant Figures • Calculating with Sig Figs (con’t) – Exact Numbers do not limit the # of sig figs in the answer. • Counting numbers: 12 students • Exact conversions: 1 m = 100 cm • “ 1” in any conversion: 1 in = 2. 54 cm Courtesy Christy Johannesson www. nisd. net/communicationsarts/pages/chem

Significant Figures Practice Problems 5. (15. 30 g) ÷ (6. 4 m. L) 4 SF 2 SF = 2. 390625 g/m. L 2. 4 g/m. L 6. 18. 9 g - 0. 84 g 18. 06 g 18. 1 g Courtesy Christy Johannesson www. nisd. net/communicationsarts/pages/chem 2 SF

Scientific Notation 65, 000 kg 6. 5 × 10⁴ kg • Converting into Scientific Notation: – Move decimal until there’s 1 digit to its left. Places moved = exponent. – Large # (>1) positive exponent Small # (<1) negative exponent – Only include sig figs. Courtesy Christy Johannesson www. nisd. net/communicationsarts/pages/chem

D. Scientific Notation Practice Problems 7. 2, 400, 000 g 2. 4 106 g 8. 0. 00256 kg 2. 56 10 -3 kg 9. 7 10 -5 km 0. 00007 km 10. 6. 2 104 mm 62, 000 mm Courtesy Christy Johannesson www. nisd. net/communicationsarts/pages/chem

Significant Figures • What is the smallest mark on the ruler that measures 142. 15 cm? • 142 cm? • 140 cm? • Here there’s a problem does the zero count or not? • They needed a set of rules to decide which zeros count. • All other numbers do count

Which zeros count? • Those at the end of a number before the decimal point don’t count • 12400 • If the number is smaller than one, zeros before the first number don’t count • 0. 045

Which zeros count? • Zeros between other sig figs do. • 1002 • zeroes at the end of a number after the decimal point do count • 45. 8300 • If they are holding places, they don’t. • If they are measured (or estimated) they do

Sig Figs • • • Only measurements have sig figs. Counted numbers are exact A dozen is exactly 12 A a piece of paper is measured 11 inches tall. Being able to locate, and count significant figures is an important skill.

Sig figs. • • How many sig figs in the following measurements? 458 g 4085 g 4850 g 0. 0485 g 0. 004085 g 40. 004085 g

More Sig Figs How to Round

Problems • 50 is only 1 significant figure • if it really has two, how can I write it? • A zero at the end only counts after the decimal place • Scientific notation • 5. 0 x 101 • now the zero counts.

Adding and subtracting with sig figs • The last sig fig in a measurement is an estimate. • Your answer when you add or subtract can not be better than your worst estimate. • have to round it to the least place of the measurement in the problem

For example 27. 93 + 6. 4 l + First line up the decimal places Then do the adding 27. 93 Find the estimated 6. 4 numbers in the problem 34. 33 This answer must be rounded to the tenths place

• Rounding off numbers – when answering a question the answer should have no more significant figures than the data with the fewest significant figures

Rules for rounding numbers • If the digit to the immediate right of the last significant figure is less than five, do not change the last significant figure • If the digit to the immediate right of the last significant figure is greater than five, round up the last significant figure • If the digit to the immediate right of the last significant figure is equal to five and is followed by a nonzero digit, round up the last significant figure

2. 4 Representing data • A Graph is a visual display of data. • A circle graph is useful for showing parts of a fixed whole • A bar graph is useful to show a quantity varies with factors such as time, location, or temperature. In that case the quantity being measure appears on the vertical axis (y axis) and the independent variable appears on the horizontal axis (x axis). • A line graph represents the intersection of data for two variables. The independent variable is plotted n the x axis and the dependent variable is plotted on the y axis. Remember the independent variable is the variable that a scientist deliberately changes during an experiment.

• • Elements of a “good” line graph: 1. axes labeled, w/units 2. title 3. use available space 4. neat Remember DRY MIX Dependent responds on the y axis Manipulated the independent on the x axis

• If the graph is a straight line the variables are directly related. • If a line rises to the right the slope is positive and indicates the dependent variable increases as the independent variable increases. • If the line sinks to the right the slope is negative and indicates the dependent variable decreases as the independent variable increases. Either way the slope is constant. • Slope = y 2 -y 1/x 2 -x 1 = change in y/change in x

Graphs

Bar Graph # of students shows how many of something are in each category

Pie Graph shows how a whole is broken into parts Percentage of Weekly Income

Line Graph shows continuous change Stock Price over Time In chemistry…you will always use a line graph.

Elements of a “good” line graph 1. title 2. axes labeled, with units 3. neat 4. use the available space

Conversion factors • “A ratio of equivalent measurements. ” • Start with two things that are the same. 1 m = 100 cm • Starting unit must be in denominator of conversion factor • The ratio of these two measurements will equal one

• • 4 quarters = one dollar Can be written either way Ex: 1 L = 1000 m. L You try it write the conversion factors for centimeters and meters

Write the conversion factors for the following • Grams to kilograms • Inches to feet to yards

What are they good for? We can multiply by one creatively to change the units. n 13 inches is how many yards? n 36 inches = 1 yard. n 1 yard =1 36 inches n 13 inches x 1 yard = 13/36 36 inches n

Conversion factors • Called conversion factors because they allow us to convert units. • Really just dividing by starting unit. • Choose the conversion factor that gets rid of the unit you don’t want.

Dimensional Analysis • • Dimension = unit Analyze = solve Using the units to solve the problems. If the units of your answer are right, chances are you did the math right.

Dimensional Analysis • Using with metric units • Need to know equivalence statements • If it has a prefix, get rid of it with one conversion factor • To add a prefix use a conversion factor

How to • 1. dimensional analysis is a method for solving problems. It is sometimes called the factor label method, fence, train tracks, or T chart • 2. Write the quantity given and multiply by the conversion factor with units = quantity required

Practice • 25 m. L is how many L? Step 1. Identify the given quantity and write it in the left hand corner of the grid. INCLUDE THE UNIT!

• Step. 2 Determine the conversion factor, and write it both ways. • Step. 3 Choose the appropriate conversion factor from the 2 that you have written (in step 2). The one you pick will have the same unit in the denominator as the unit in the given quantity. Place on the right hand side of the grid and don’t forget the units!

• Step 4. Perform the math with the numbers (multiply the numbers on the top and divide by the numbers on the bottom), round your answer to the correct number of significant digits and cancel out LIKE UNITS. ( Note: units are similar to numbers here; since you have the SAME unit in the numerator and the denominator, they CANCEL!) Remember that the conversion factor is NOT used to determine significant digits. The GIVEN QUANTITY determines the number of significant digits.

• More examples: • a. 8. 32 x 10 -3 kg to g • b. 21. 3 ns to s

Dimensional Analysis • In the same system, unlimited sig figs • From one system to another. The conversion factor has as many the most sig figs in the measurements. • 1 inch is 2. 54 cm • 3 sf 1 inch 2. 54 cm

Dimensional Analysis • A race is 10. 0 km long. How far is this in miles? – 1 mile = 1760 yds – 1 meter = 1. 094 yds

Dimensional Analysis • Pikes peak is 14, 110 ft above sea level. What is this in meters? – 1 mile = 1760 yds – 1 meter = 1. 094 yds

Dimensional Analysis • Another measuring system has different units of measure. 6 ft = 1 fathom 100 fathoms = 1 cable length 10 cable lengths = 1 nautical mile 3 nautical miles = 1 league • Jules Verne wrote a book 20, 000 leagues under the sea. How far is this in feet?
 What are customary units of measurement
 What are the units for momentum? *
 Units of linear measurement
 Customary system
 Typical room height metric unit
 Customary units of measurement
 Units of measurement microscope
 Units of measurement in physics
 5 physical quantities and their si units
 Customary and metric units
 Measurement units chart
 Basic conversion
 Mussd
Mussd Metric system of measurement
 Metric units
 Unit conversion of length
 Botox dilution table
 When units manufactured exceed units sold:
 Work measurement techniques
 Chapter 5 measurement theory godfrey
 Chapter 9 general survey and measurement
 Normal vital signs for all age groups
 Chapter 8 section 3 earthquakes and society answer key
 3 scientific measurement
 Chapter 1 measurement
 Chapter 1 physics and measurement
 Chapter 1 measurement
 Chapter 3 scientific measurement
 Introduction to the structural units chapter 1 answers
 Introduction to the structural units
 Chapter 1 introduction to the structural units
 Rough er
 Chapter 3 cells the living units
 Mitosis
 Convert each measurement
 Level of measurement statistics
 Weather measurement tools
 Closest speaking space silverman
 Vertical distance measurement
 Jvp waves
 International measurement system
 Measurement of unemployment
 Significant figures cartoon
 Significant figures cartoon
 Absolute uncertainty formula
 Measurement topic
 Safety measurement system
 King henry danced merrily down center main
 Principle of measurement of temperature
 Is measured by
 Unit of moles
 Nominal measurement
 Rancidity chemical reaction
 Software measurement and metrics in software engineering
 Remote attestation
 White collar workers examples
 Trochee symbol
 Criteria of goodness of a measurement scale
 Internal rotation definition
 Mole unit of measurement
 Quantitative measurement examples
 Fishbone measurement
 Dotting on in measurement
 Artline
 Salinity unit of measurement
 Peer review process cmmi
 Productivity definition in operations management
 Why is measurement part of the product disassembly process
 Measurement and instrumentation ppt
 Waistband height
 Speed of response in measurement
 Physical properties of seawater
 Personality definition
 Performance measurement in decentralized organizations
 Performance measurement in decentralized organizations
 Which one is the indirect measuring instrument
 Capturing marketing insights examples
 Ulnar measurement for height
 Rics nrm
 New rules of measurement
 Clinical judgement measurement model
 Surface profile measurement method
 Network performance measurement tools
 Measures of concentration molarity
 Atd angle
 Decimal system of measurement
 French metric system
 Si units ladder
 Ladder method conversions
 Metric ladder conversion
 Coyne pr logo
 Loneliness measurement tool
 Unit of measurement for power
 Measured quantity
 Accuracy in measurement
 Standard measurement system
 Discontinuous measurement procedures
 4 scales of measurement
 If you can't measure it you can't control it
 Test of intelligence
 Measurement jeopardy
 Time measurement
 Concept map of measurement assessment and evaluation
 Concept of measurement assessment and evaluation
 Interval scale
 Manoj kuamr


