1 2322008 Gene Network Modeling Prof Yasser Kadah








- Slides: 99
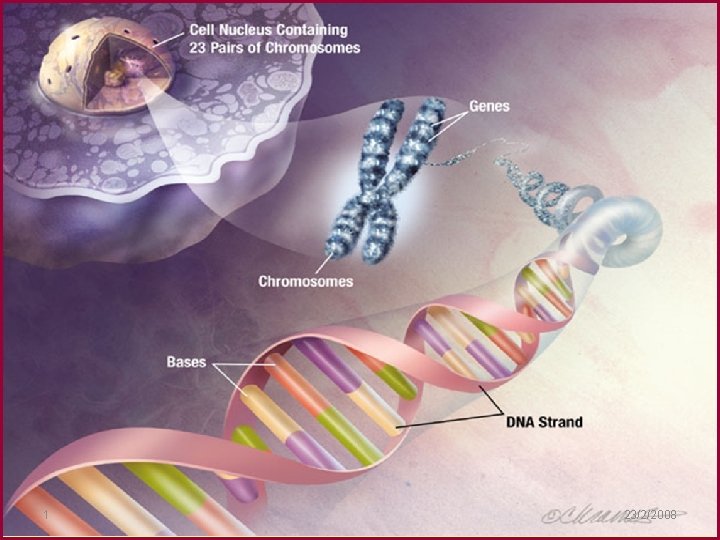
1 23/2/2008
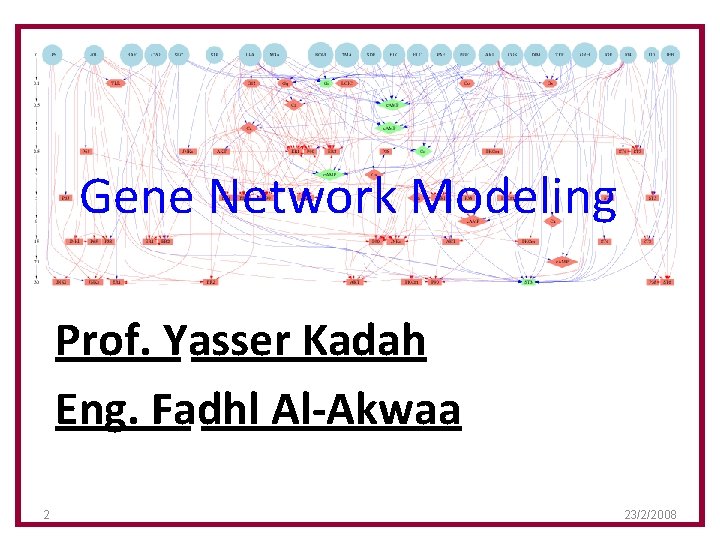
Gene Network Modeling Prof. Yasser Kadah Eng. Fadhl Al-Akwaa 2 23/2/2008
OUTLINES Ø What is the Gene Regulatory Network? GRN Ø Application of GRN Ø GRN Construction Methodology Ø GRN modeling steps Ø GRN Models Ø GRS Software Ø Next work Ø Reference 3 23/2/2008
From The Last Lecture Ø DNA sequence {A, T, C, G} ATCGA Ø Protein sequence { except B, J, O, U, X, Z} KMLSLLMARTYW 4 23/2/2008
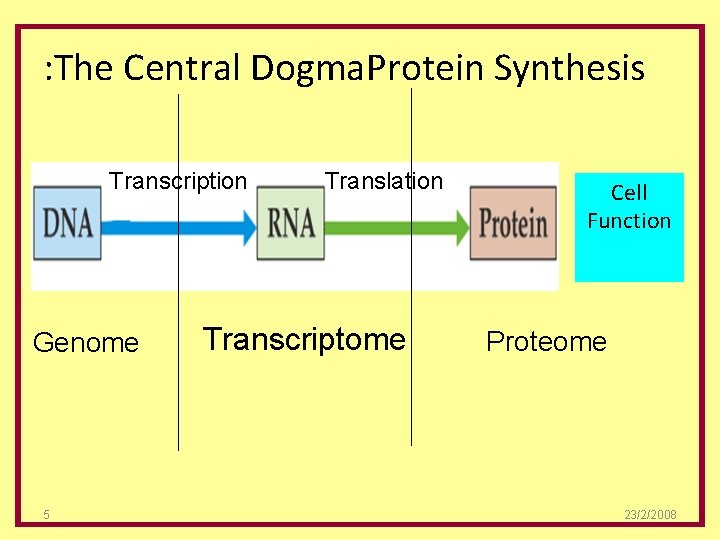
: The Central Dogma. Protein Synthesis Transcription Genome 5 Translation Transcriptome Cell Function Proteome 23/2/2008
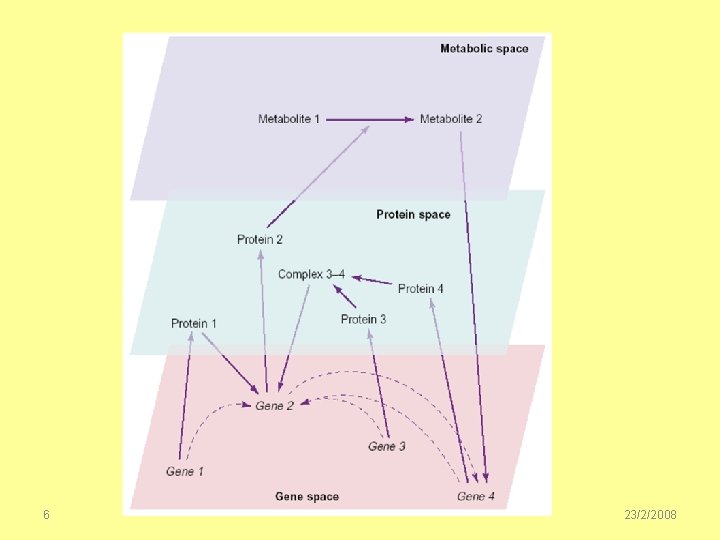
6 23/2/2008
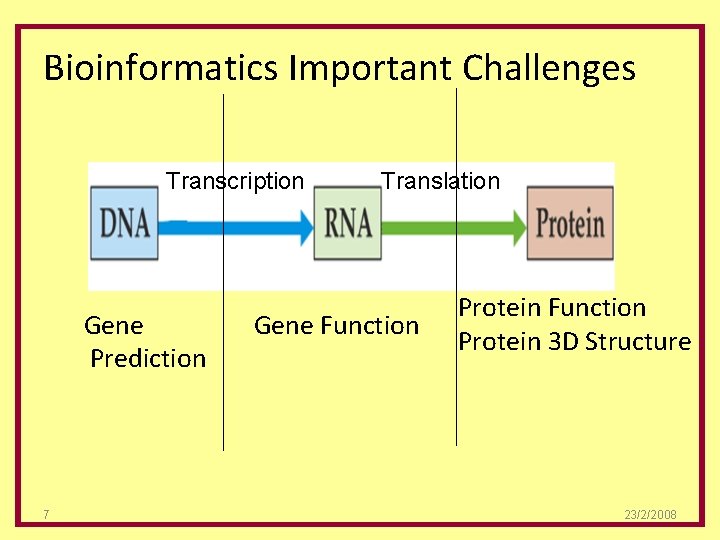
Bioinformatics Important Challenges Transcription Gene Prediction 7 Translation Gene Function Protein 3 D Structure 23/2/2008
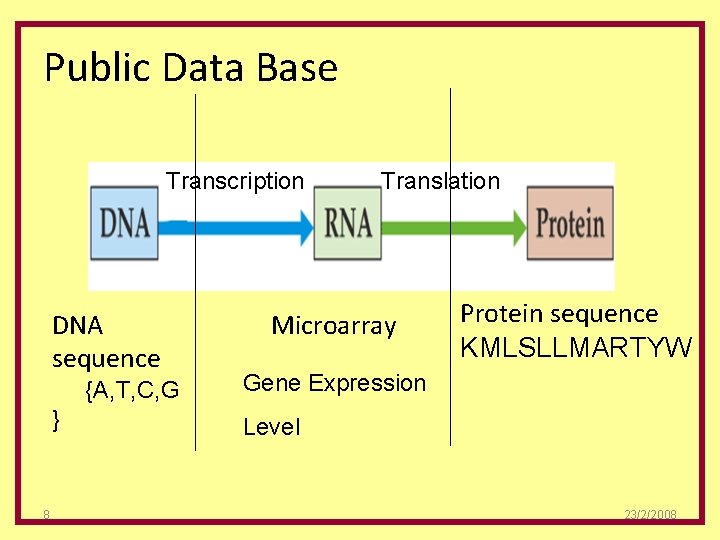
Public Data Base Transcription DNA sequence {A, T, C, G } 8 Translation Microarray Protein sequence KMLSLLMARTYW Gene Expression Level 23/2/2008
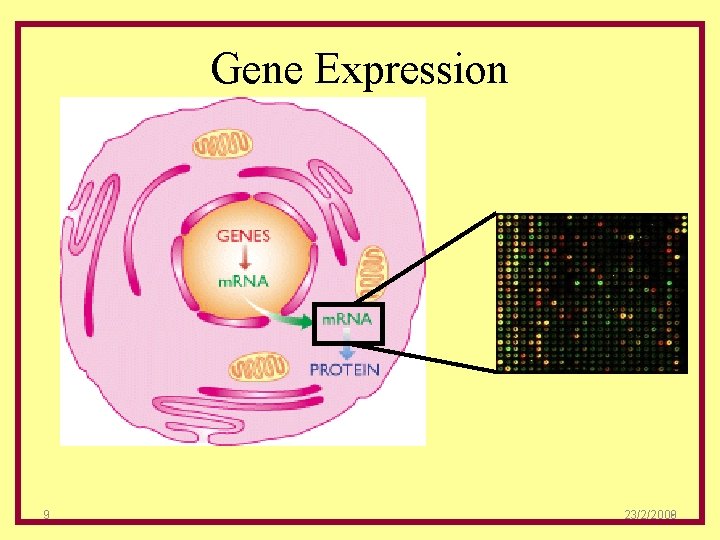
Gene Expression 9 23/2/2008 9
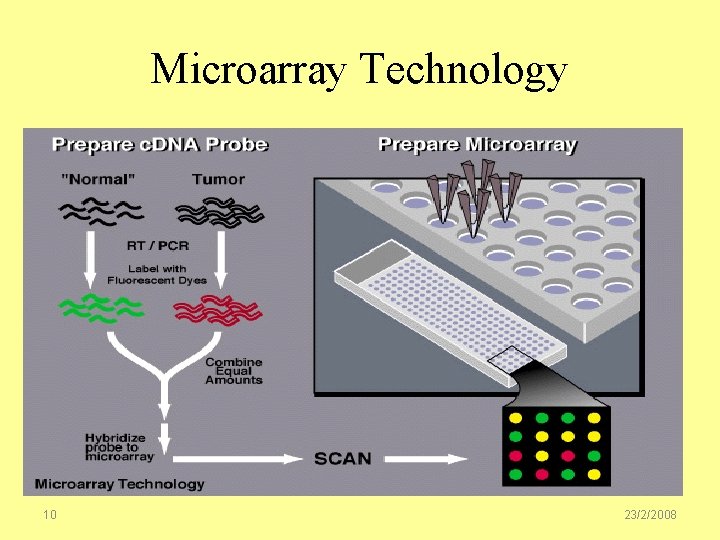
Microarray Technology 10 23/2/2008
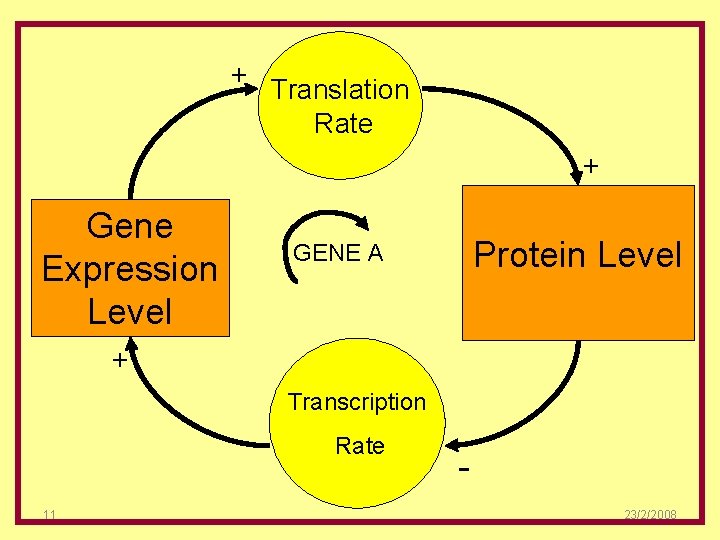
+ Translation Rate + Gene Expression Level Protein Level GENE A + Transcription Rate 11 23/2/2008
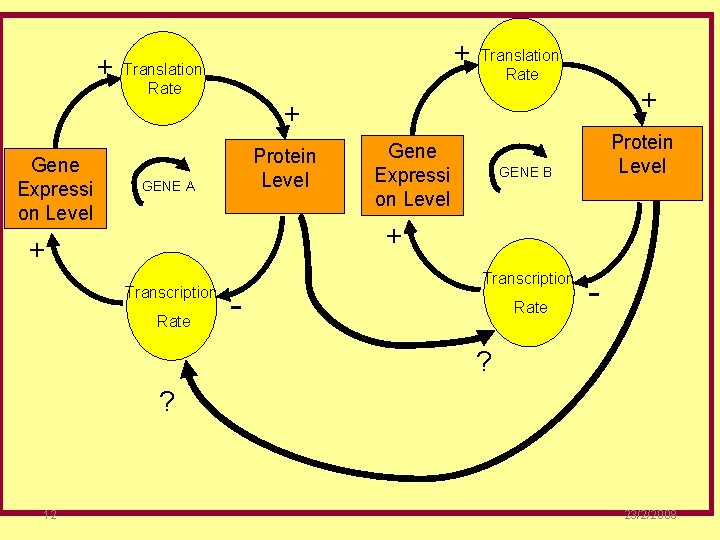
+ Gene Expressi on Level + Translation Rate + + Protein Level GENE A Gene Expressi on Level Protein Level GENE B + + Transcription Rate - ? ? 12 23/2/2008
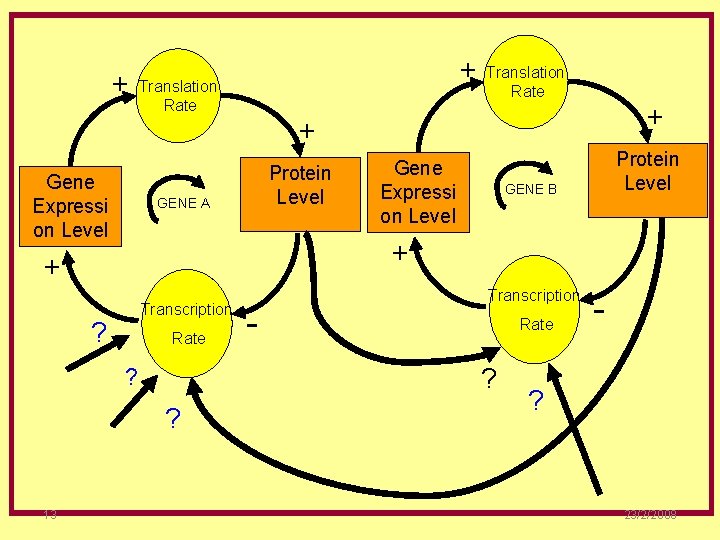
+ Gene Expressi on Level + Translation Rate + + Protein Level GENE A Gene Expressi on Level Protein Level GENE B + + Transcription ? Rate - Transcription Rate ? ? ? 13 Translation Rate - ? 23/2/2008
OUTLINES ØWhat is the Gene Regulatory Network? Ø Application of GRN Ø GRN Construction Methodology Ø GRN modeling steps Ø GRN Models Ø GRS Software Ø Future work Ø Reference 14 23/2/2008
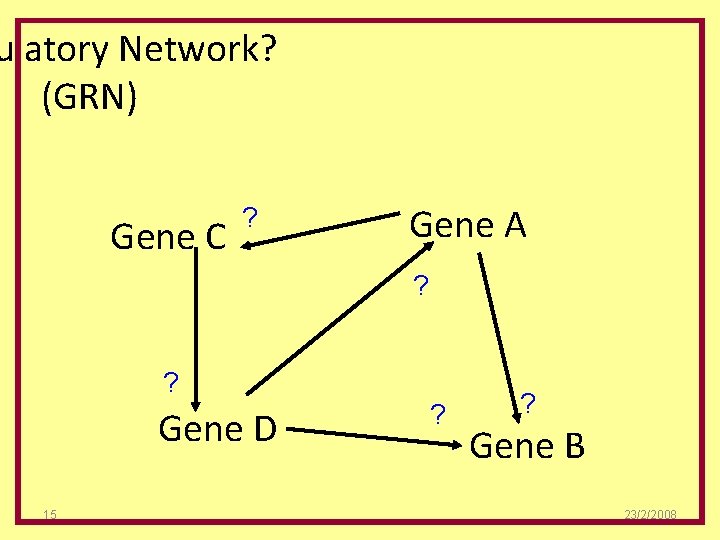
ulatory Network? (GRN) Gene C ? Gene A ? ? Gene D 15 ? ? Gene B 23/2/2008
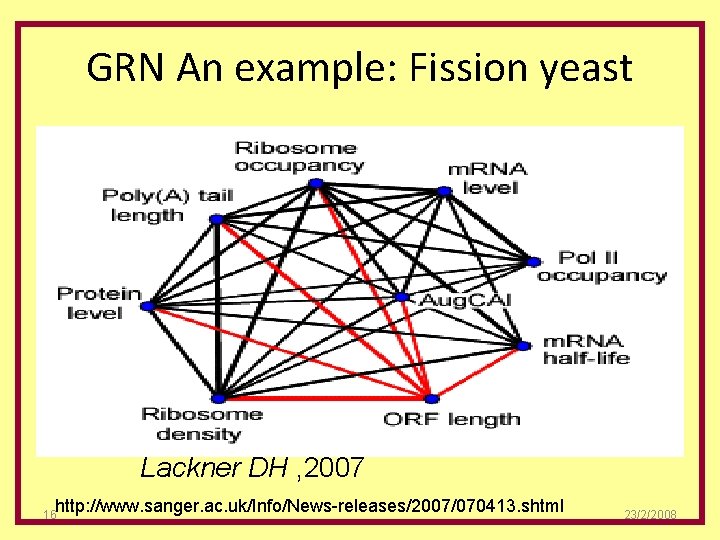
GRN An example: Fission yeast Lackner DH , 2007 http: //www. sanger. ac. uk/Info/News-releases/2007/070413. shtml 16 23/2/2008
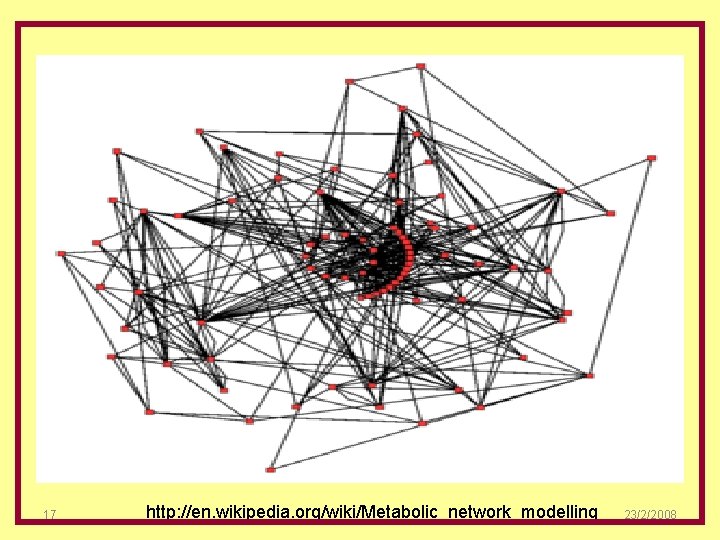
17 http: //en. wikipedia. org/wiki/Metabolic_network_modelling 23/2/2008
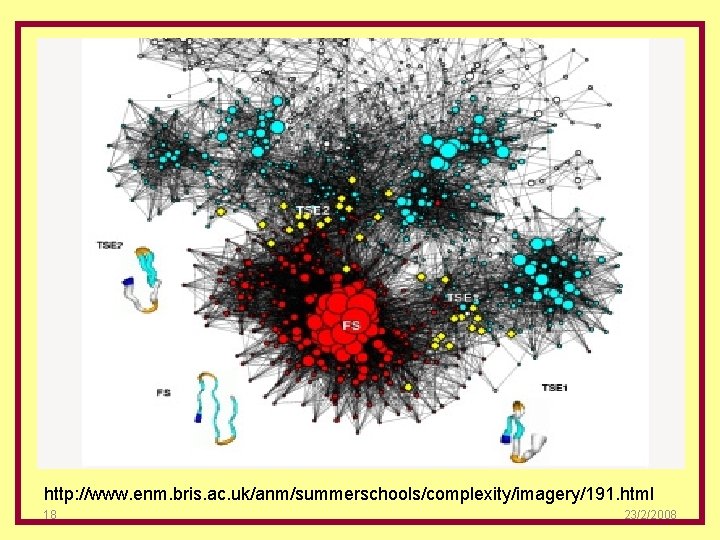
http: //www. enm. bris. ac. uk/anm/summerschools/complexity/imagery/191. html 18 23/2/2008
OUTLINES Ø What is the Gene Regulatory Network? GRN ØApplication of GRN Ø GRN Construction Methodology Ø GRN modeling steps Ø GRN Models Ø GRS Software Ø Next work Ø Reference 19 23/2/2008
Why build a Gene Network? Functional Genomics Ø Allow researchers to make predictions about gene function that can then be tested at the bench. ØThe Focus is gradually shifting to Functional Genomics. 20 23/2/2008
Application of GRN Translational Genomics Ø we can study the effects of a compound (such as a drug) on the level of expression of many genes. Ø Translational Genomics The mission of the Translational Genomics is to translate genomic discoveries into advances in human health. 21 23/2/2008
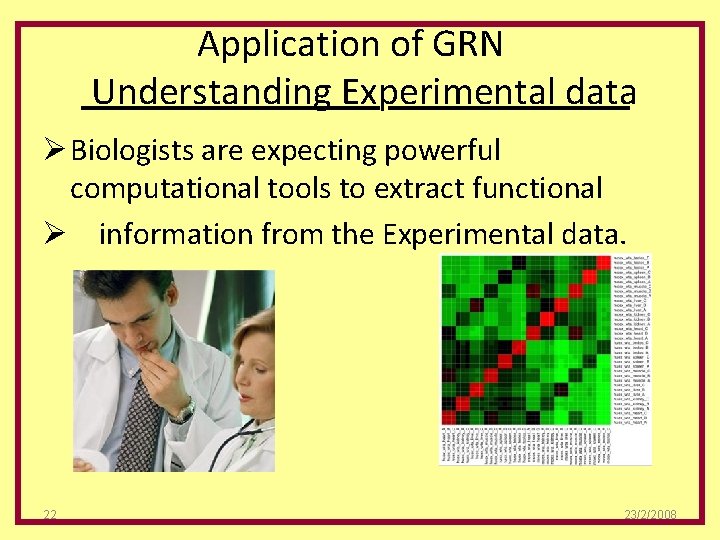
Application of GRN Understanding Experimental data Ø Biologists are expecting powerful computational tools to extract functional Ø information from the Experimental data. 22 23/2/2008
GRN Model Objective Construct a gene network model that: ØDescribes known genes interactions well ØPredicts interactions not known so far ØAllows for Drug effect simulation ØUnderstand the etiology of the Disease 23 23/2/2008
OUTLINES Ø What is the Gene Regulatory Network? GRN Ø Application of GRN ØGRN Construction Methodology Ø GRN modeling steps Ø GRN Models Ø GRS Software Ø Next work Ø Reference 24 23/2/2008
GRN Construction Methodology Ø Forward Engineering Ø Inverse Engineering “Traditional methodology” 25 23/2/2008
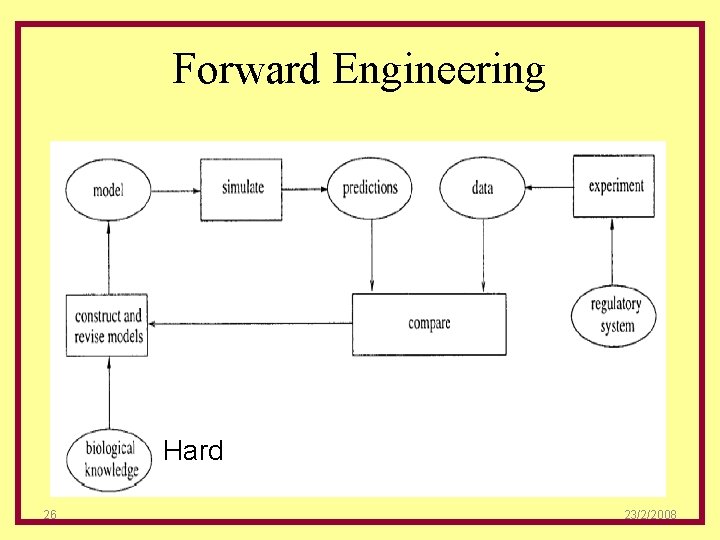
Forward Engineering Hard 26 23/2/2008
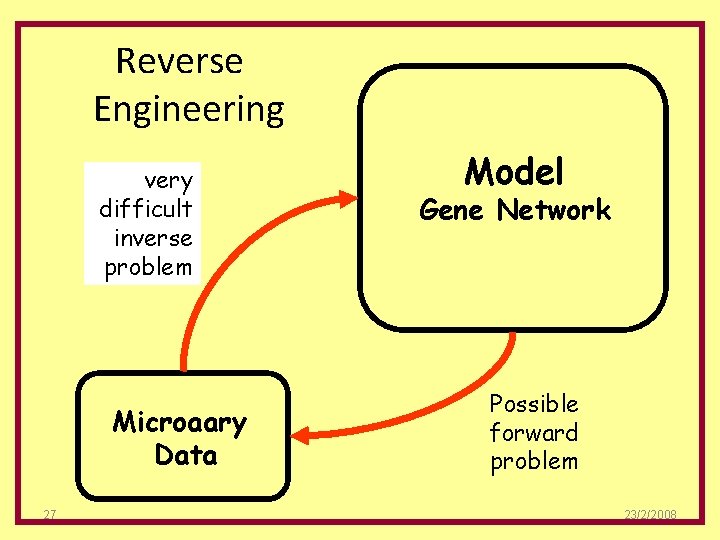
Reverse Engineering very difficult inverse problem Microaary Data 27 Model Gene Network Possible forward problem 23/2/2008
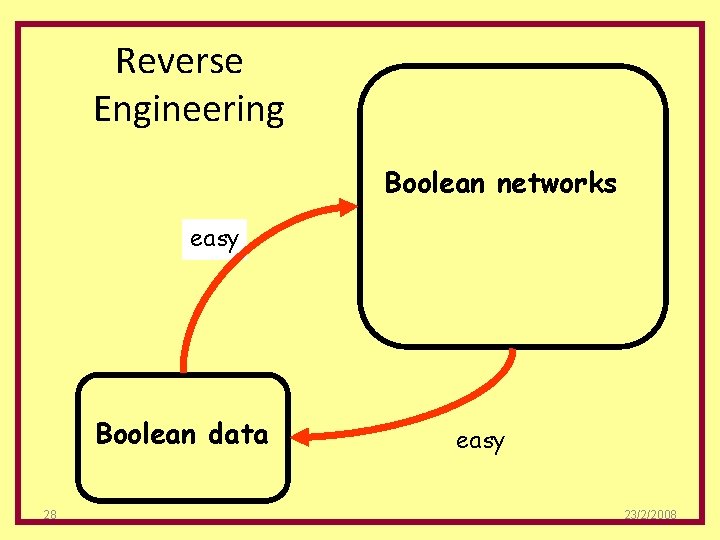
Reverse Engineering Boolean networks easy Boolean data 28 easy 23/2/2008
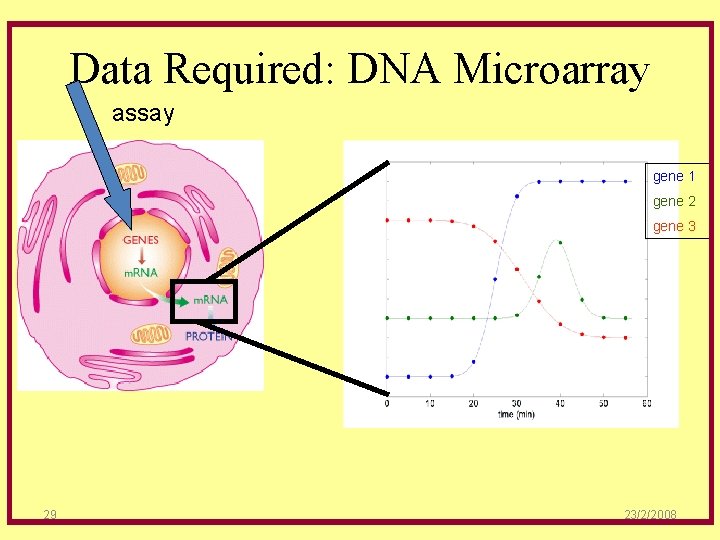
Data Required: DNA Microarray assay gene 1 gene 2 gene 3 29 23/2/2008
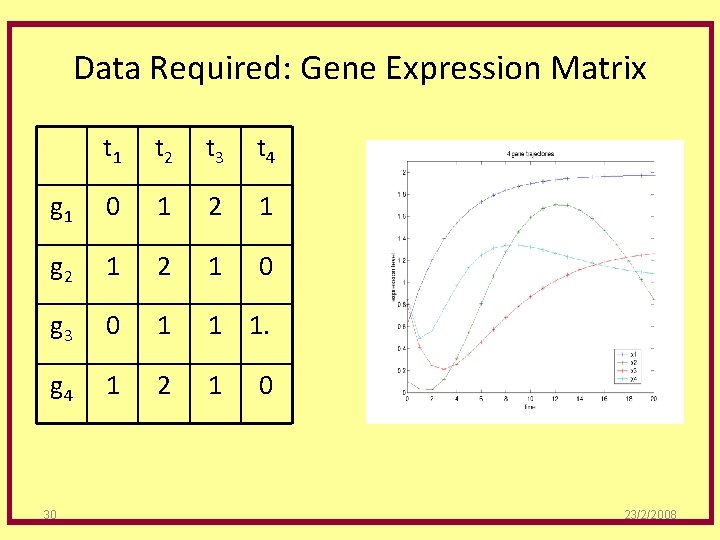
Data Required: Gene Expression Matrix t 1 t 2 t 3 t 4 g 1 0 1 2 1 g 2 1 0 g 3 0 1 1 1. g 4 1 2 1 30 0 23/2/2008
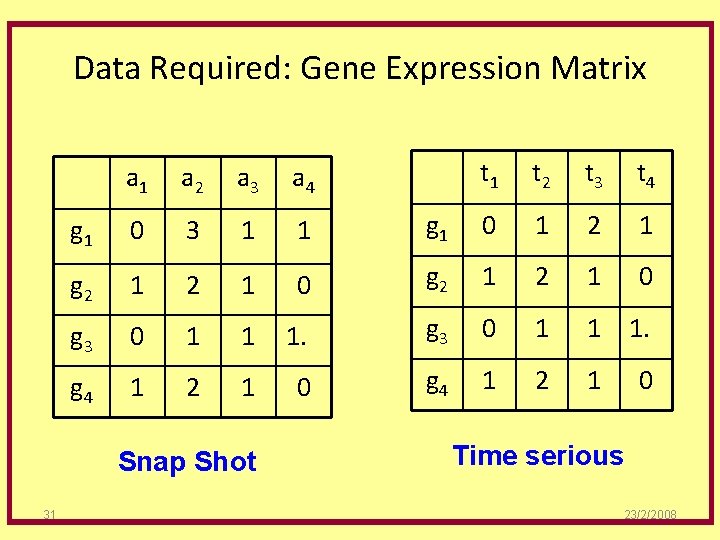
Data Required: Gene Expression Matrix t 1 t 2 t 3 t 4 g 1 0 1 2 1 0 g 2 1 0 1 1. g 3 0 1 1 1. 1 0 g 4 1 2 1 a 2 a 3 a 4 g 1 0 3 1 1 g 2 1 g 3 0 1 g 4 1 2 Snap Shot 31 0 Time serious 23/2/2008
OUTLINES Ø What is the Gene Regulatory Network? GRN Ø Application of GRN Ø GRN Construction Methodology ØGRN Modeling Steps Ø GRN Models Ø GRS Software Ø Next work Ø Reference 32 23/2/2008
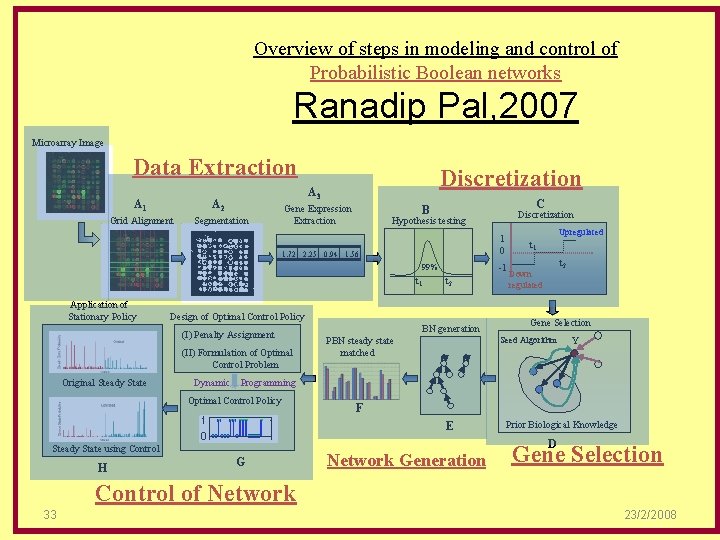
Overview of steps in modeling and control of Probabilistic Boolean networks Ranadip Pal, 2007 Microarray Image Data Extraction A 1 A 2 Grid Alignment Discretization A 3 Segmentation Gene Expression Extraction C B Hypothesis testing t 1 Original Steady State t 2 Design of Optimal Control Policy (II) Formulation of Optimal Control Problem Dynamic BN generation PBN steady state matched t 2 Down regulated Gene Selection Seed Algorithm Y Programming Optimal Control Policy F E Steady State using Control H t 1 -1 99% (I) Penalty Assignment Upregulated 1 0 1. 72 2. 25 0. 94 1. 56 Application of Stationary Policy Discretization G Network Generation Prior Biological Knowledge D Gene Selection Control of Network 33 23/2/2008
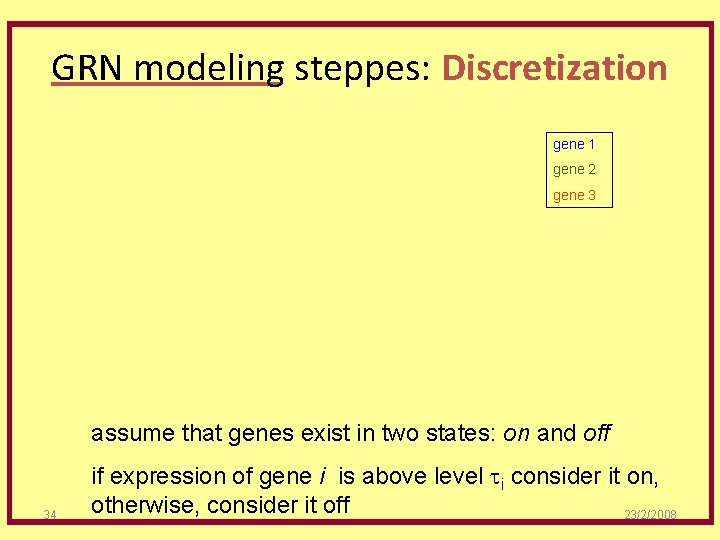
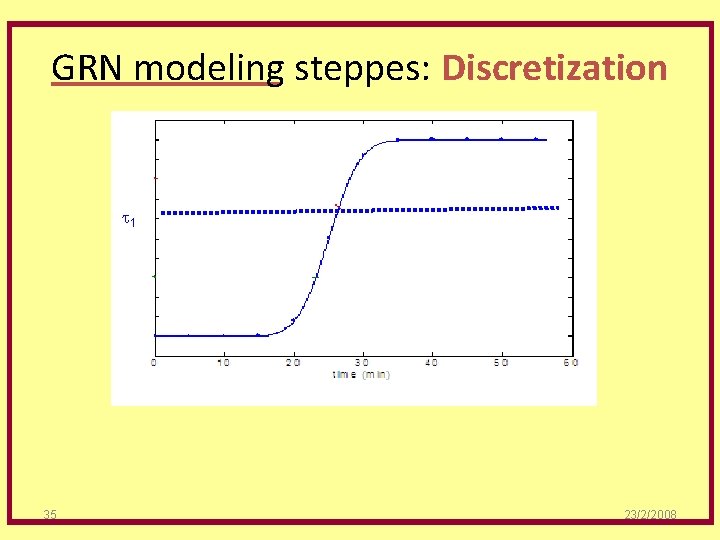
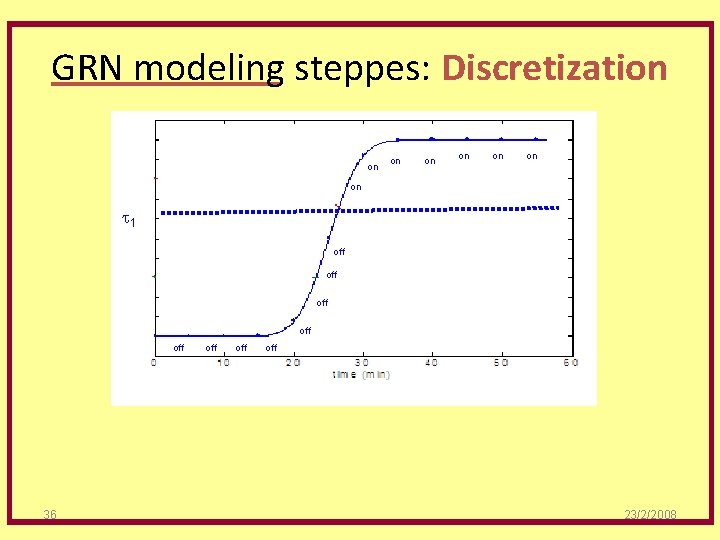
GRN modeling steppes: Discretization gene 1 gene 2 gene 3 assume that genes exist in two states: on and off 34 if expression of gene i is above level ti consider it on, otherwise, consider it off 23/2/2008
GRN modeling steppes: Discretization t 1 35 23/2/2008
GRN modeling steppes: Discretization on t 1 off off off 36 off off 23/2/2008
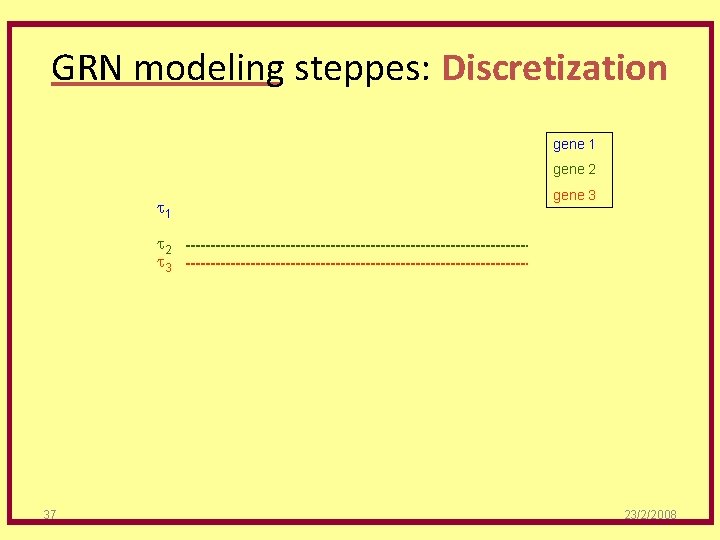
GRN modeling steppes: Discretization gene 1 gene 2 t 1 gene 3 t 2 t 3 37 23/2/2008
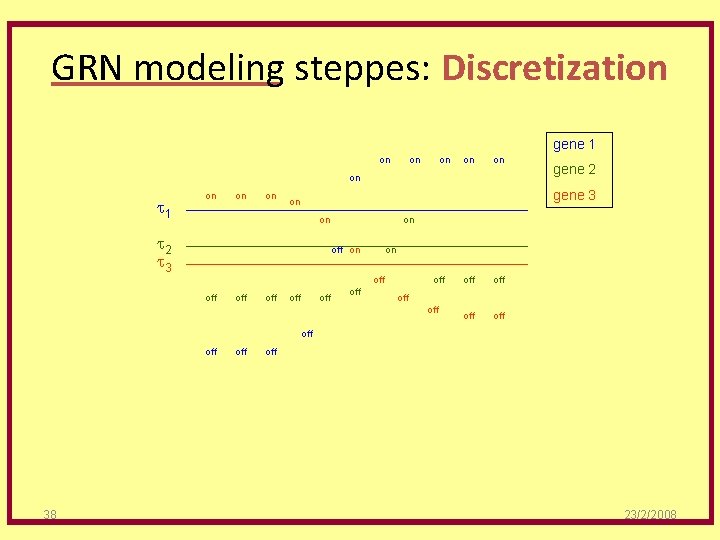
GRN modeling steppes: Discretization gene 1 on on on t 1 on on on gene 3 on on t 2 t 3 on off on on off off gene 2 off off off 38 off 23/2/2008
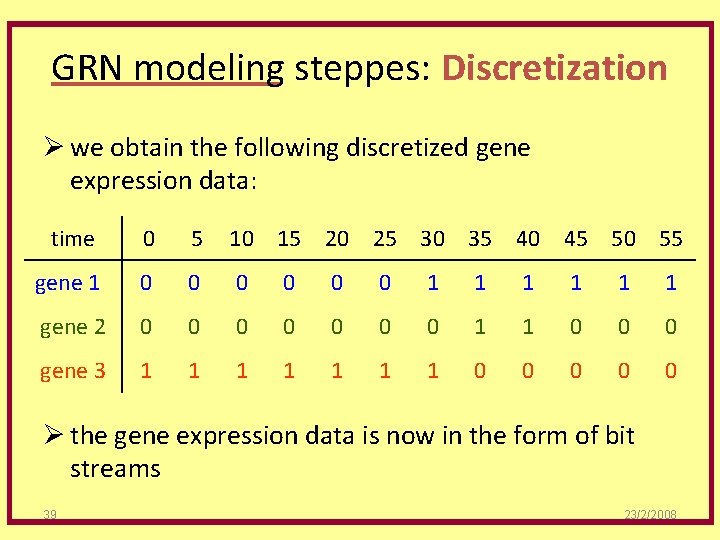
GRN modeling steppes: Discretization Ø we obtain the following discretized gene expression data: time 0 5 10 15 20 25 30 35 40 45 50 55 gene 1 0 0 0 1 1 1 gene 2 0 0 0 0 1 1 0 0 0 gene 3 1 1 1 1 0 0 0 Ø the gene expression data is now in the form of bit streams 39 23/2/2008
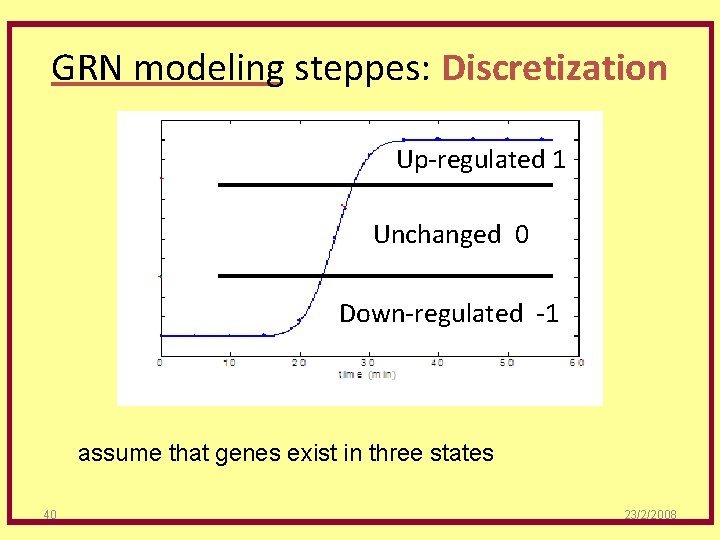
GRN modeling steppes: Discretization Up-regulated 1 Unchanged 0 Down-regulated -1 assume that genes exist in three states 40 23/2/2008
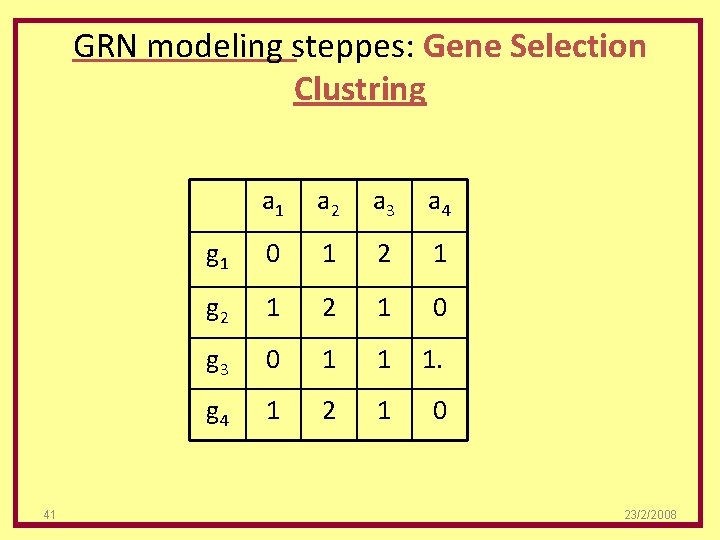
GRN modeling steppes: Gene Selection Clustring 41 a 2 a 3 a 4 g 1 0 1 2 1 g 2 1 0 g 3 0 1 1 1. g 4 1 2 1 0 23/2/2008
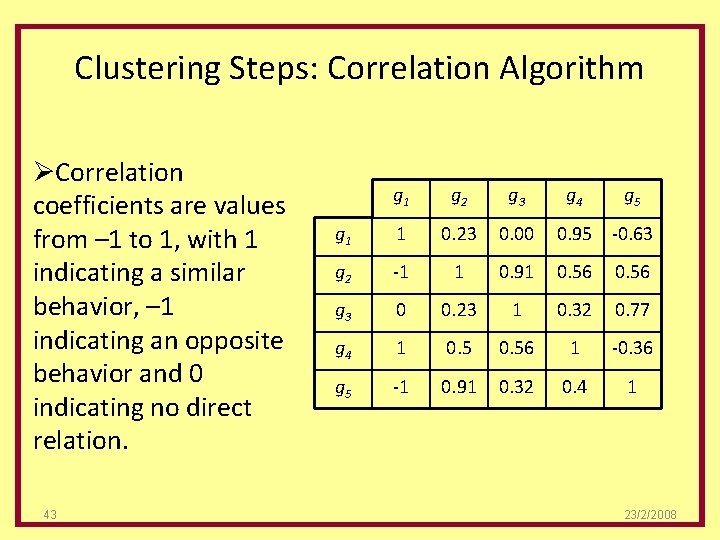
Clustering Steps: Correlation Ø Choose a similarity metric to compare the transcriptional response or the expression profiles: ØPearson Correlation ØSpearman Correlation ØEuclidean Distance Ø… 42 23/2/2008
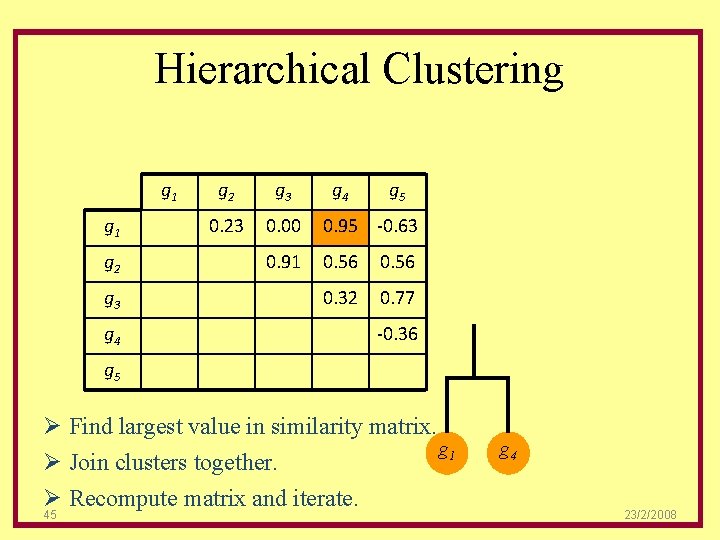
Clustering Steps: Correlation Algorithm ØCorrelation coefficients are values from – 1 to 1, with 1 indicating a similar behavior, – 1 indicating an opposite behavior and 0 indicating no direct relation. 43 g 1 g 2 g 3 g 4 g 5 g 1 1 0. 23 0. 00 0. 95 -0. 63 g 2 -1 1 0. 91 0. 56 g 3 0 0. 23 1 0. 32 0. 77 g 4 1 0. 56 1 -0. 36 g 5 -1 0. 91 0. 32 0. 4 1 23/2/2008
Clustering Steps: Clustering Algorithm Ø Choose a clustering algorithm: ØHierarchical ØK-means Ø… 44 23/2/2008
Hierarchical Clustering g 1 g 2 g 3 g 4 g 5 0. 23 0. 00 0. 95 -0. 63 0. 91 0. 56 0. 32 0. 77 -0. 36 g 5 Ø Find largest value in similarity matrix. g 1 Ø Join clusters together. Ø Recompute matrix and iterate. 45 g 4 23/2/2008
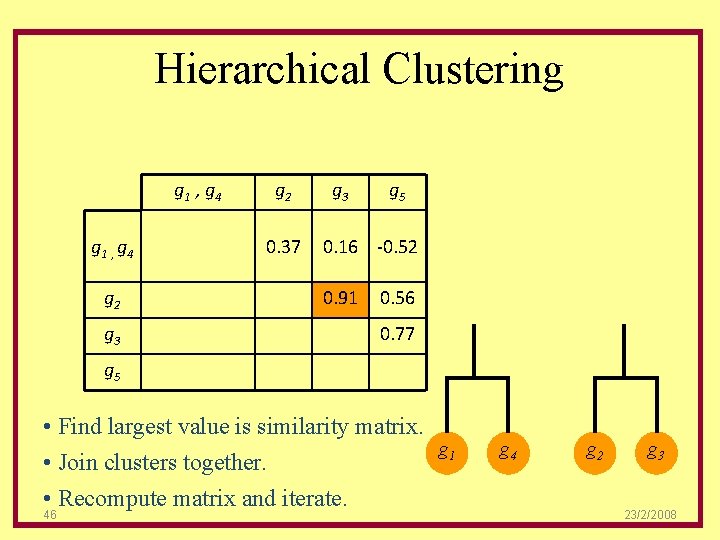
Hierarchical Clustering g 1 , g 4 g 2 g 3 g 2 0. 37 g 3 g 5 0. 16 -0. 52 0. 91 0. 56 0. 77 g 5 • Find largest value is similarity matrix. g 1 • Join clusters together. • Recompute matrix and iterate. 46 g 4 g 2 g 3 23/2/2008
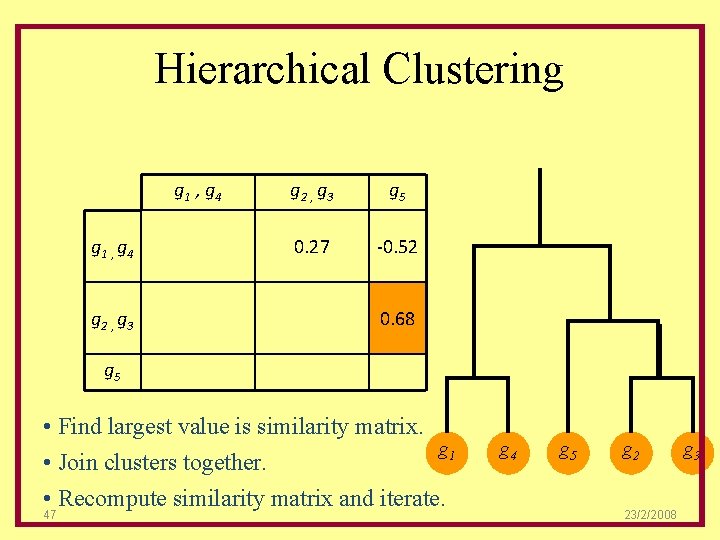
Hierarchical Clustering g 1 , g 4 g 2 , g 3 g 5 0. 27 -0. 52 0. 68 g 5 • Find largest value is similarity matrix. g 1 • Join clusters together. • Recompute similarity matrix and iterate. 47 g 4 g 5 g 2 23/2/2008 g 3
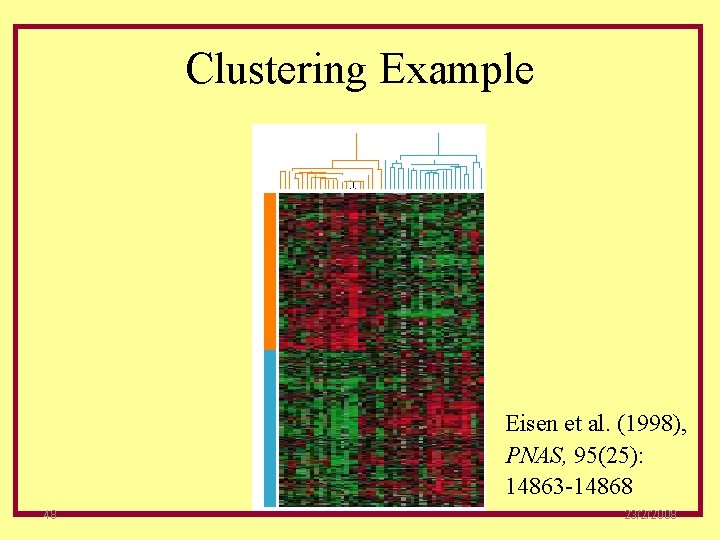
Clustering Example Eisen et al. (1998), PNAS, 95(25): 14863 -14868 48 23/2/2008
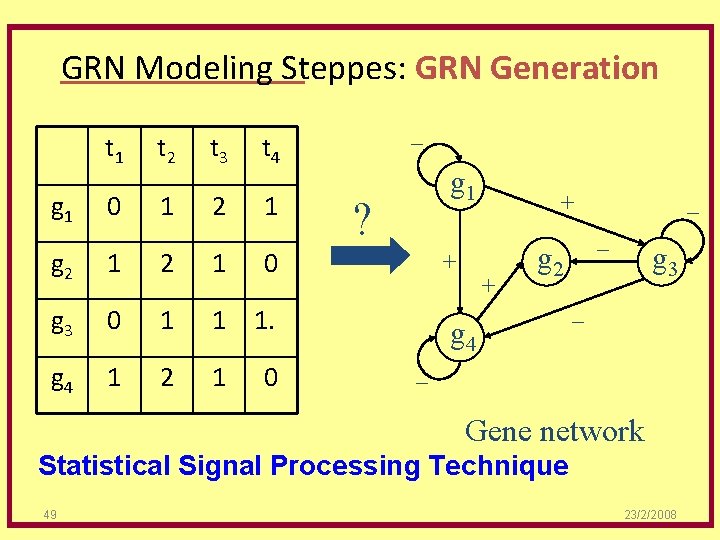
GRN Modeling Steppes: GRN Generation t 1 t 2 t 3 t 4 g 1 0 1 2 1 g 3 0 1 1 1. g 4 1 2 1 _ g 1 ? 0 0 + _ + + _ g 2 g 4 g 3 _ _ Gene network Statistical Signal Processing Technique 49 23/2/2008
OUTLINES Ø What is the Gene Regulatory Network? GRN Ø Application of GRN Ø GRN Construction Methodology Ø GRN modeling steps ØGRN Models Ø GRS Software Ø Next work Ø Reference 50 23/2/2008
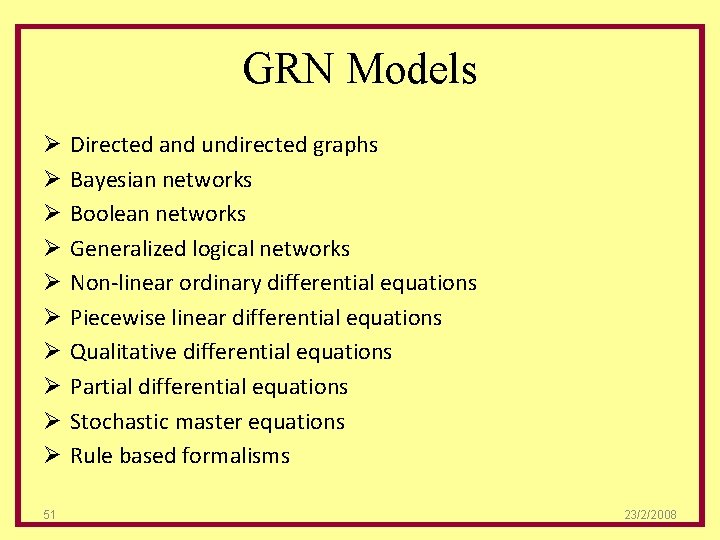
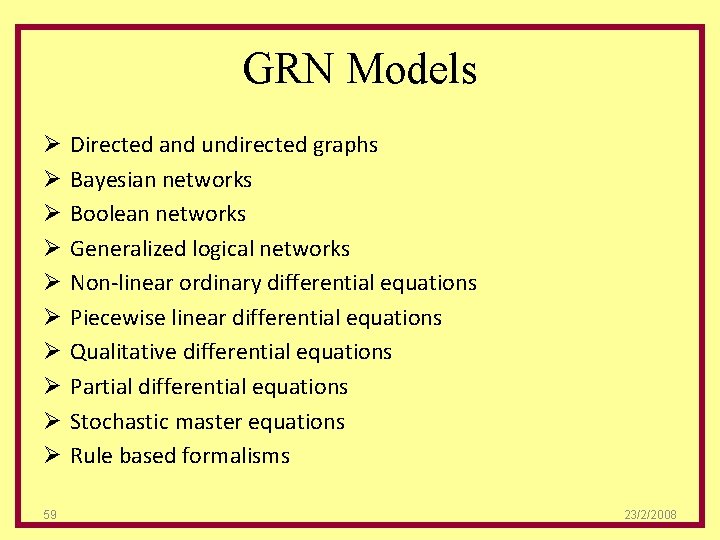
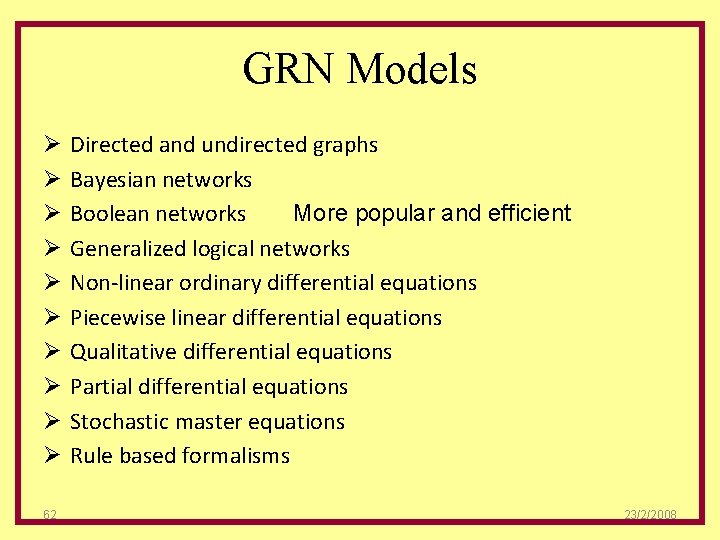
GRN Models Ø Ø Ø Ø Ø 51 Directed and undirected graphs Bayesian networks Boolean networks Generalized logical networks Non-linear ordinary differential equations Piecewise linear differential equations Qualitative differential equations Partial differential equations Stochastic master equations Rule based formalisms 23/2/2008
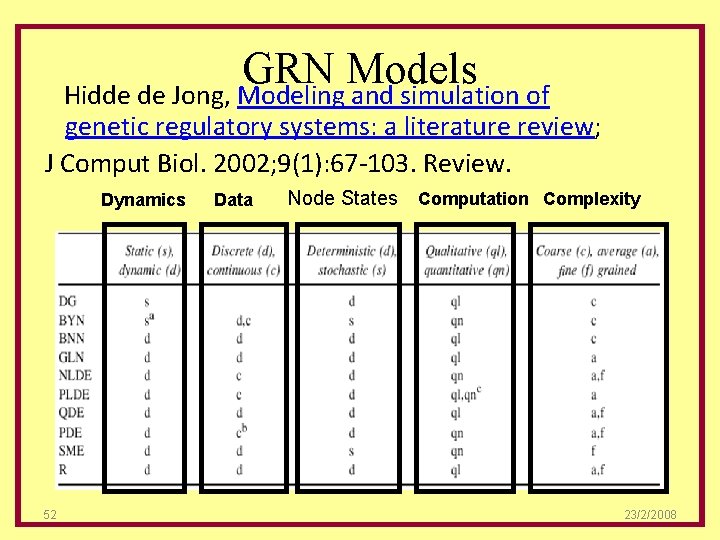
GRN Models Hidde de Jong, Modeling and simulation of genetic regulatory systems: a literature review; J Comput Biol. 2002; 9(1): 67 -103. Review. Dynamics 52 Data Node States Computation Complexity 23/2/2008
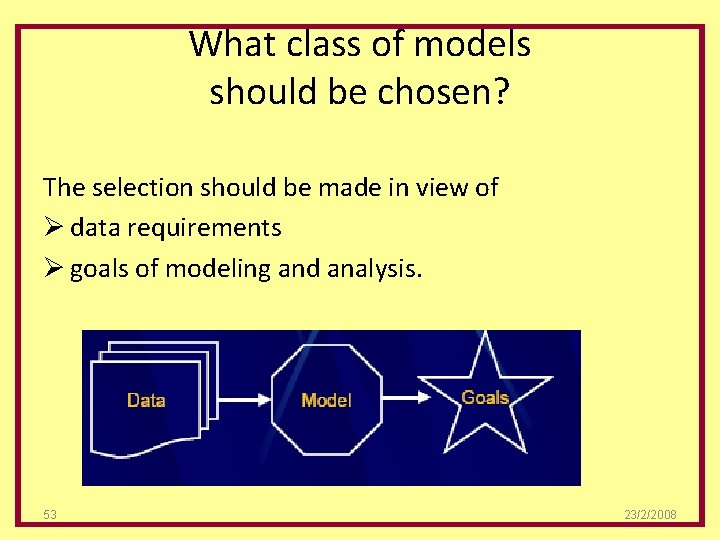
What class of models should be chosen? The selection should be made in view of Ø data requirements Ø goals of modeling and analysis. 53 23/2/2008
Classical Tradeoff Ø A “fine” model with many parameters Ømay be able to capture detailed “low-level” phenomena (protein concentrations, reaction kinetics); Ø requires very large amounts of data for inference, lest the model be “overfit”. Ø A “coarse” model with lower complexity Ømay succeed in capturing “high-level” phenomena (which genes are ON/OFF); Ørequires smaller amounts of data. 54 23/2/2008
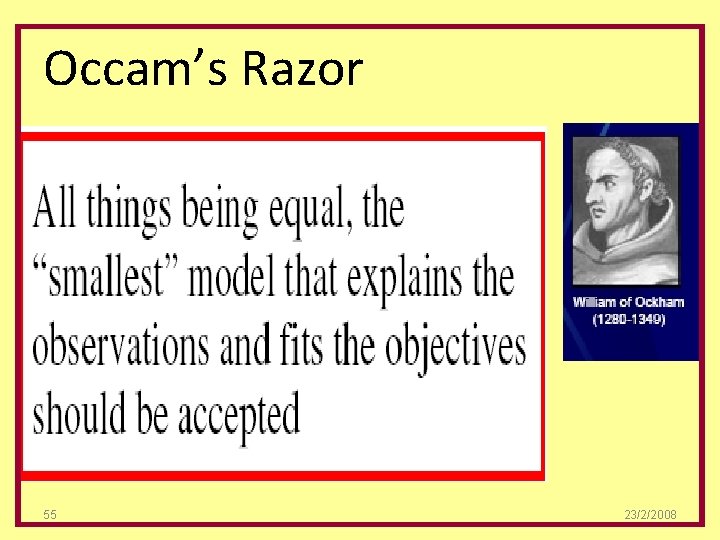
Occam’s Razor 55 23/2/2008
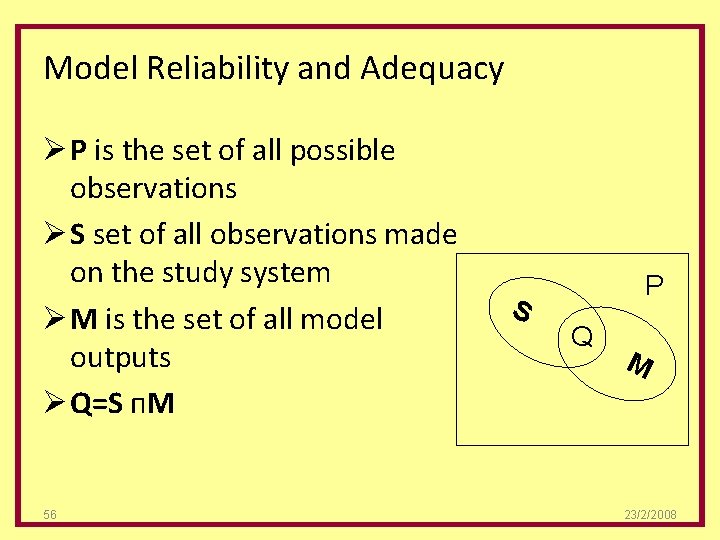
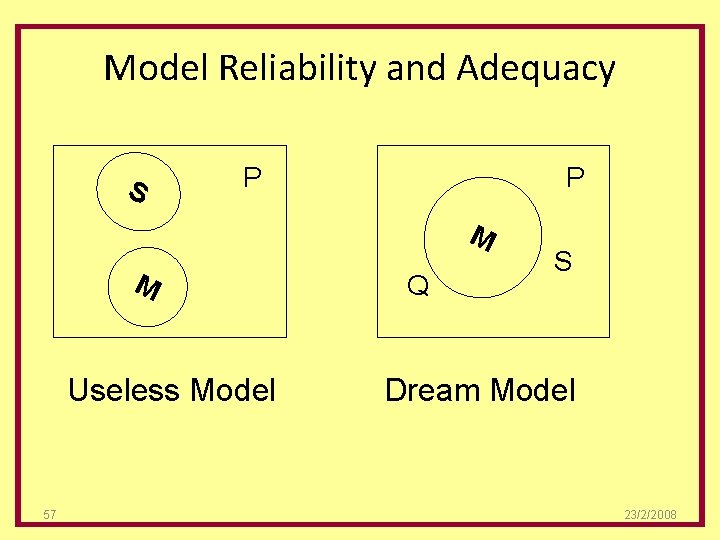
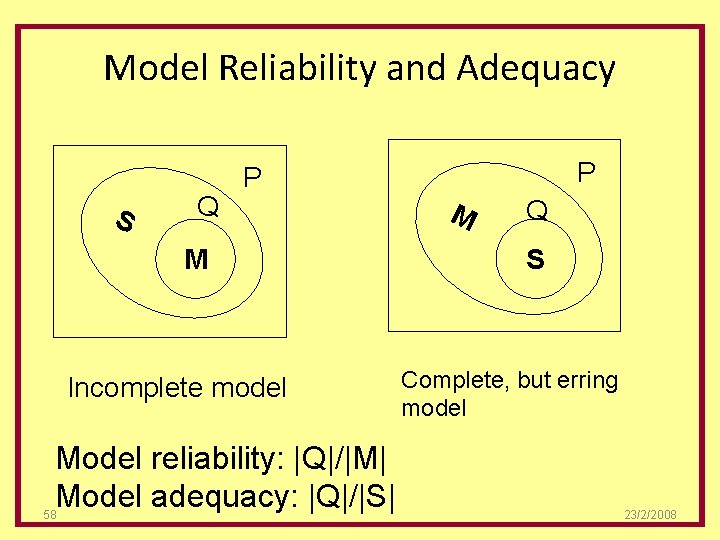
Model Reliability and Adequacy Ø P is the set of all possible observations Ø S set of all observations made on the study system Ø M is the set of all model outputs Ø Q=S п. M 56 S P Q M 23/2/2008
Model Reliability and Adequacy S P P M M Useless Model 57 Q S Dream Model 23/2/2008
Model Reliability and Adequacy S Q M Incomplete model Model reliability: |Q|/|M| Model adequacy: |Q|/|S| 58 P P M Q S Complete, but erring model 23/2/2008
GRN Models Ø Ø Ø Ø Ø 59 Directed and undirected graphs Bayesian networks Boolean networks Generalized logical networks Non-linear ordinary differential equations Piecewise linear differential equations Qualitative differential equations Partial differential equations Stochastic master equations Rule based formalisms 23/2/2008
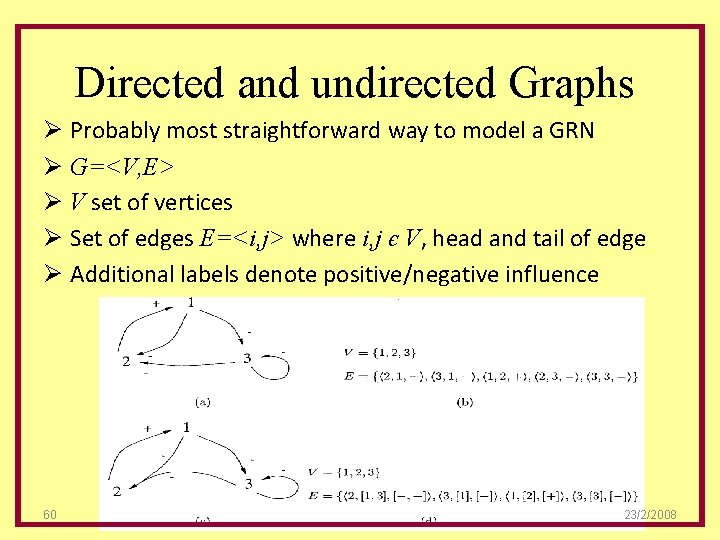
Directed and undirected Graphs Ø Probably most straightforward way to model a GRN Ø G=<V, E> Ø V set of vertices Ø Set of edges E=<i, j> where i, j є V, head and tail of edge Ø Additional labels denote positive/negative influence 60 23/2/2008
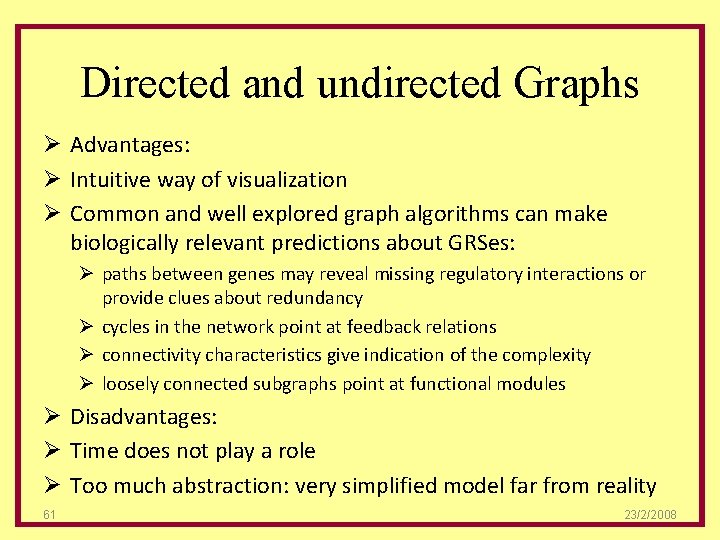
Directed and undirected Graphs Ø Advantages: Ø Intuitive way of visualization Ø Common and well explored graph algorithms can make biologically relevant predictions about GRSes: Ø paths between genes may reveal missing regulatory interactions or provide clues about redundancy Ø cycles in the network point at feedback relations Ø connectivity characteristics give indication of the complexity Ø loosely connected subgraphs point at functional modules Ø Disadvantages: Ø Time does not play a role Ø Too much abstraction: very simplified model far from reality 61 23/2/2008
GRN Models Ø Ø Ø Ø Ø 62 Directed and undirected graphs Bayesian networks Boolean networks More popular and efficient Generalized logical networks Non-linear ordinary differential equations Piecewise linear differential equations Qualitative differential equations Partial differential equations Stochastic master equations Rule based formalisms 23/2/2008
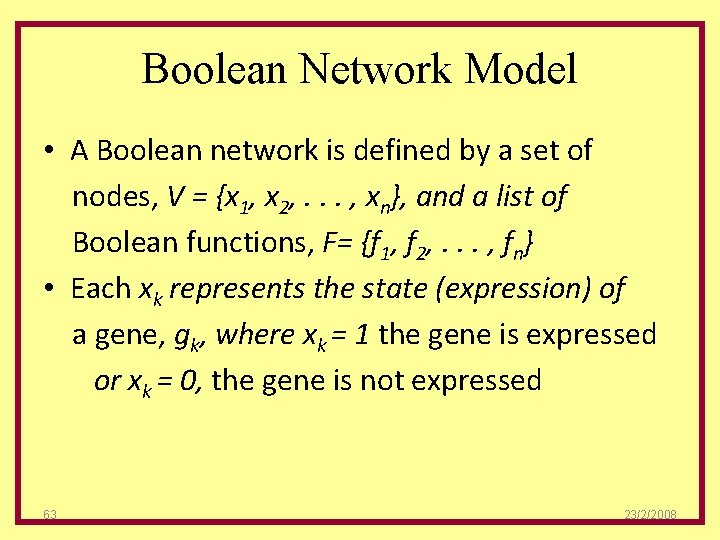
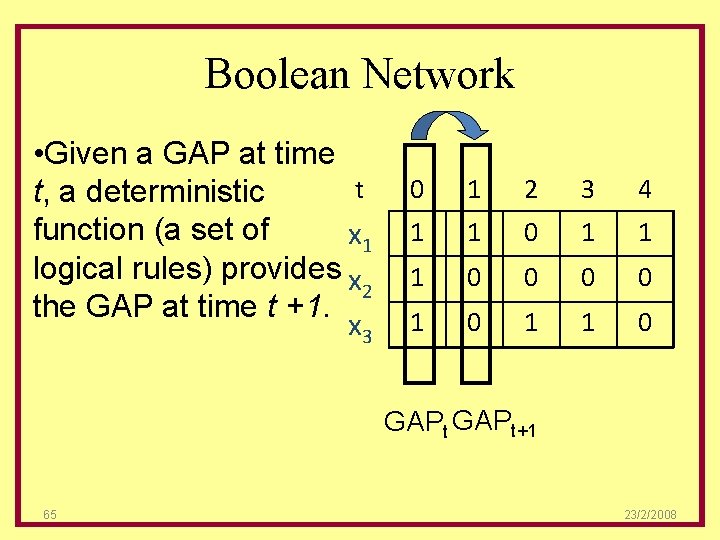
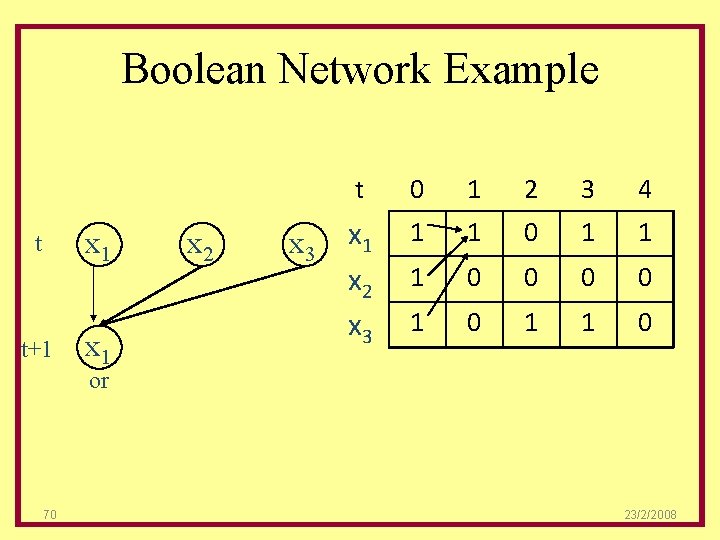
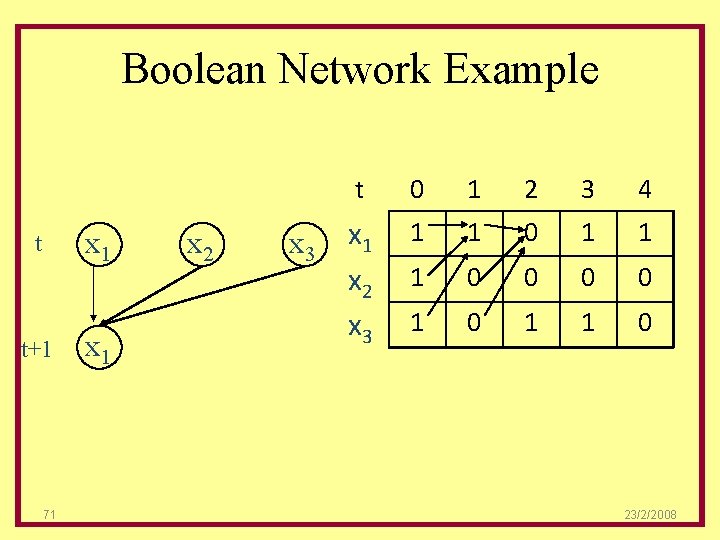
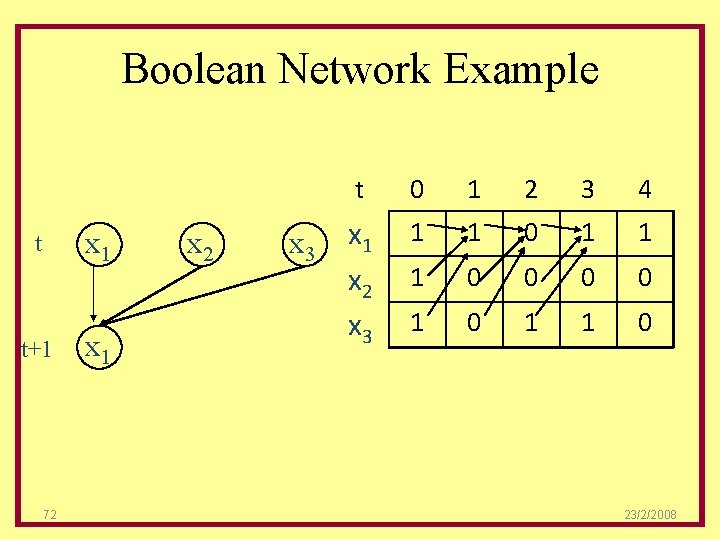
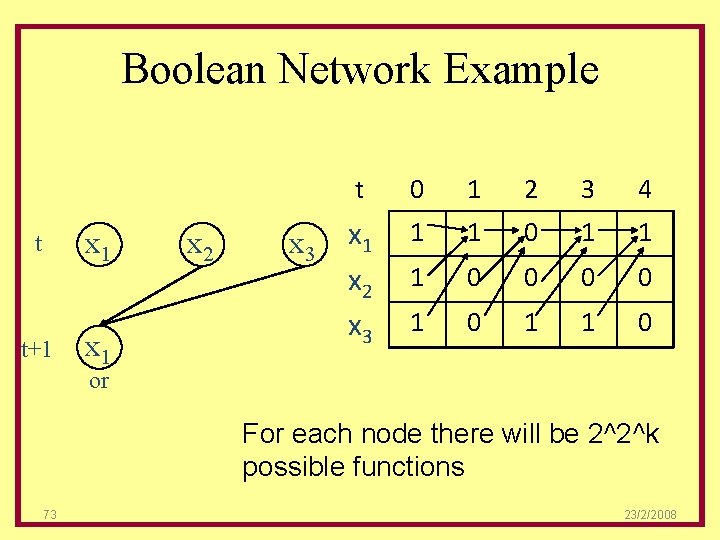
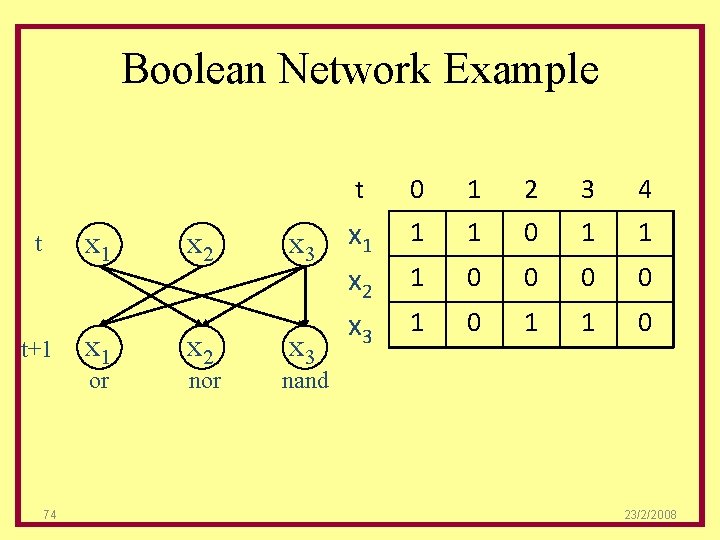
Boolean Network Model • A Boolean network is defined by a set of nodes, V = {x 1, x 2, . . . , xn}, and a list of Boolean functions, F= {f 1, f 2, . . . , fn} • Each xk represents the state (expression) of a gene, gk, where xk = 1 the gene is expressed or xk = 0, the gene is not expressed 63 23/2/2008
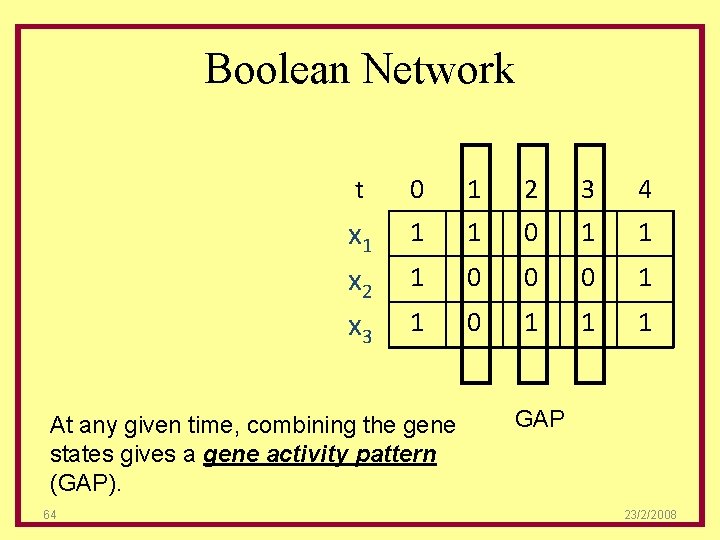
Boolean Network t 0 1 2 3 4 x 1 x 2 x 3 1 1 0 1 1 1 0 0 0 1 1 1 At any given time, combining the gene states gives a gene activity pattern (GAP). 64 GAP 23/2/2008
Boolean Network • Given a GAP at time t t, a deterministic function (a set of x 1 logical rules) provides x 2 the GAP at time t +1. x 3 0 1 2 3 4 1 1 0 1 1 1 0 0 1 0 1 1 0 GAPt+1 65 23/2/2008
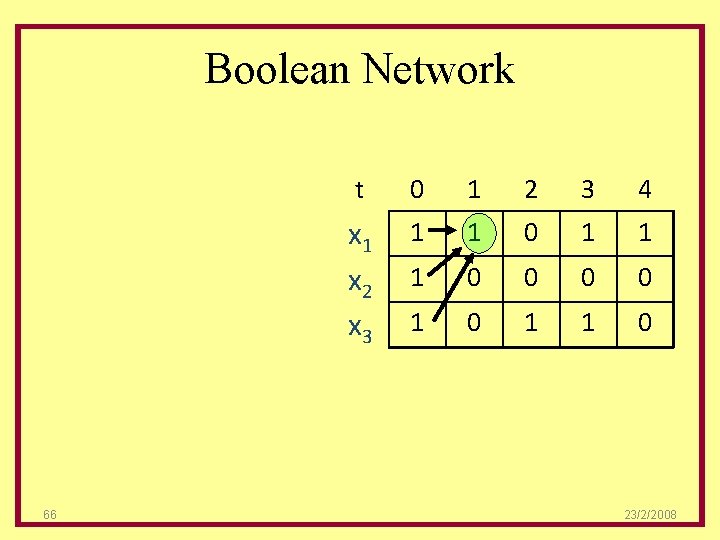
Boolean Network 66 t 0 1 2 3 4 x 1 x 2 x 3 1 1 0 1 1 1 0 0 1 0 1 1 0 23/2/2008
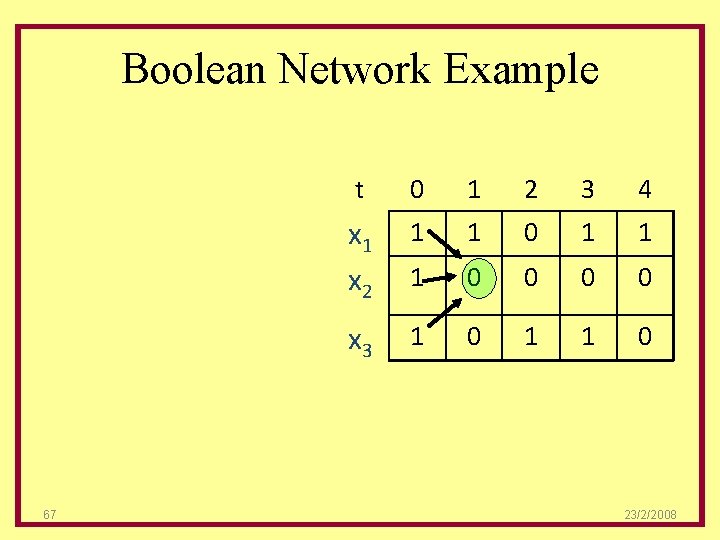
Boolean Network Example 67 t 0 1 2 3 4 x 1 x 2 1 1 0 1 1 1 0 0 x 3 1 0 1 1 0 23/2/2008
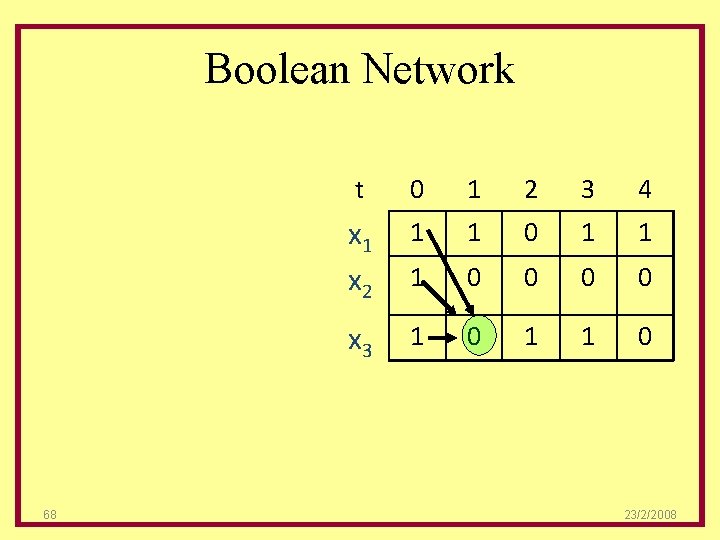
Boolean Network 68 t 0 1 2 3 4 x 1 x 2 1 1 0 1 1 1 0 0 x 3 1 0 1 1 0 23/2/2008
Boolean Network Example x 1 t t+1 69 x 1 x 2 x 3 t 0 1 2 3 4 x 1 x 2 x 3 1 1 0 1 1 1 0 0 1 0 1 1 0 23/2/2008
Boolean Network Example x 1 t t+1 x 2 x 3 t 0 1 2 3 4 x 1 x 2 x 3 1 1 0 1 1 1 0 0 1 0 1 1 0 or 70 23/2/2008
Boolean Network Example x 1 t t+1 71 x 2 x 3 t 0 1 2 3 4 x 1 x 2 x 3 1 1 0 1 1 1 0 0 1 0 1 1 0 23/2/2008
Boolean Network Example x 1 t t+1 72 x 1 x 2 x 3 t 0 1 2 3 4 x 1 x 2 x 3 1 1 0 1 1 1 0 0 1 0 1 1 0 23/2/2008
Boolean Network Example x 1 t t+1 x 2 x 3 t 0 1 2 3 4 x 1 x 2 x 3 1 1 0 1 1 1 0 0 1 0 1 1 0 or For each node there will be 2^2^k possible functions 73 23/2/2008
Boolean Network Example x 1 t t+1 x 1 or 74 x 2 nor x 3 t 0 1 2 3 4 x 1 x 2 x 3 1 1 0 1 1 1 0 0 1 0 1 1 0 nand 23/2/2008
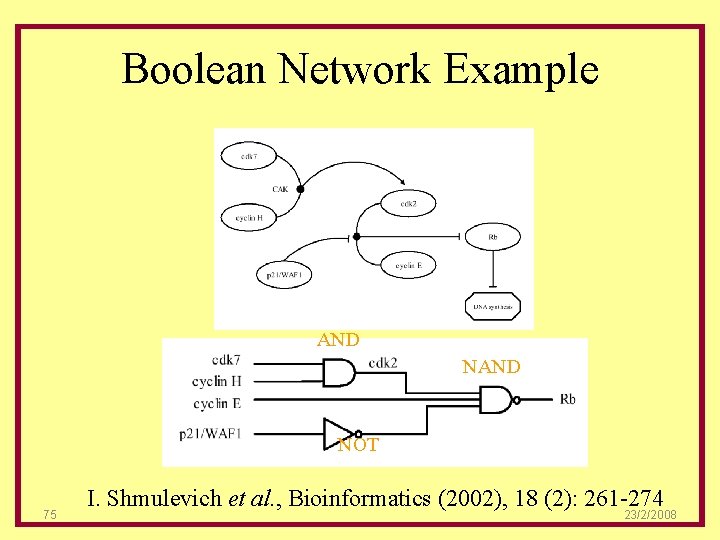
Boolean Network Example AND NOT 75 I. Shmulevich et al. , Bioinformatics (2002), 18 (2): 261 -274 23/2/2008
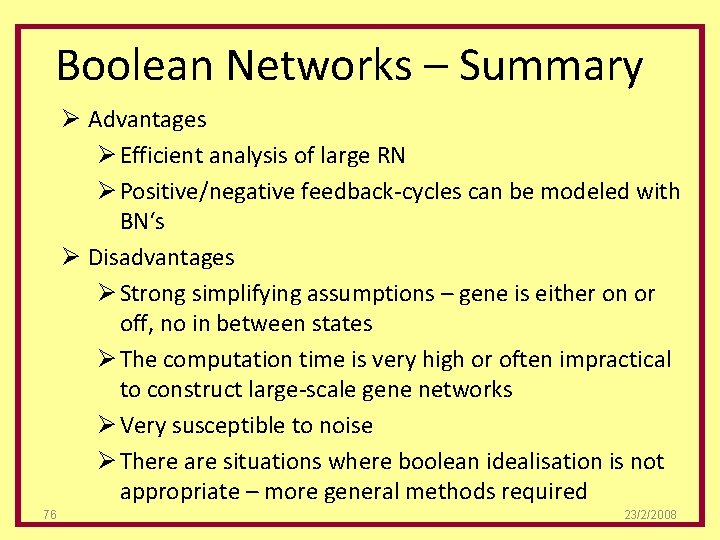
Boolean Networks – Summary Ø Advantages Ø Efficient analysis of large RN Ø Positive/negative feedback-cycles can be modeled with BN‘s Ø Disadvantages Ø Strong simplifying assumptions – gene is either on or off, no in between states Ø The computation time is very high or often impractical to construct large-scale gene networks Ø Very susceptible to noise Ø There are situations where boolean idealisation is not appropriate – more general methods required 76 23/2/2008
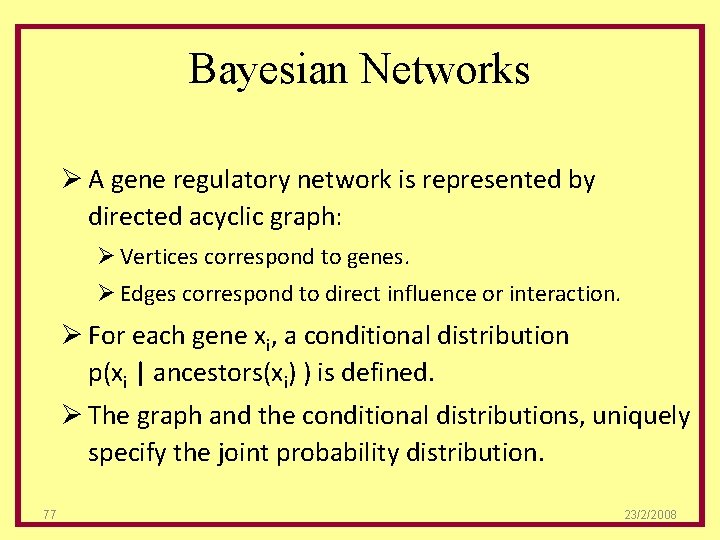
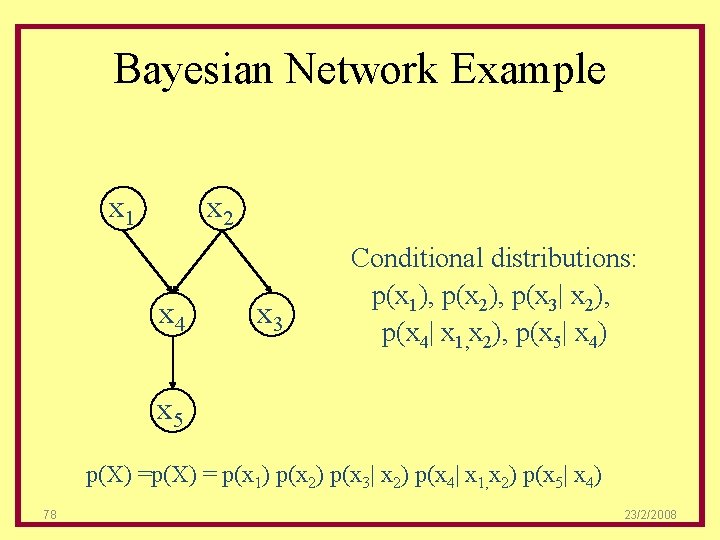
Bayesian Networks Ø A gene regulatory network is represented by directed acyclic graph: Ø Vertices correspond to genes. Ø Edges correspond to direct influence or interaction. Ø For each gene xi, a conditional distribution p(xi | ancestors(xi) ) is defined. Ø The graph and the conditional distributions, uniquely specify the joint probability distribution. 77 23/2/2008
Bayesian Network Example x 1 x 2 x 4 x 3 Conditional distributions: p(x 1), p(x 2), p(x 3| x 2), p(x 4| x 1, x 2), p(x 5| x 4) x 5 p(X) = p(x 1) p(x 2) p(x 3| x 2) p(x 4| x 1, x 2) p(x 5| x 4) 78 23/2/2008
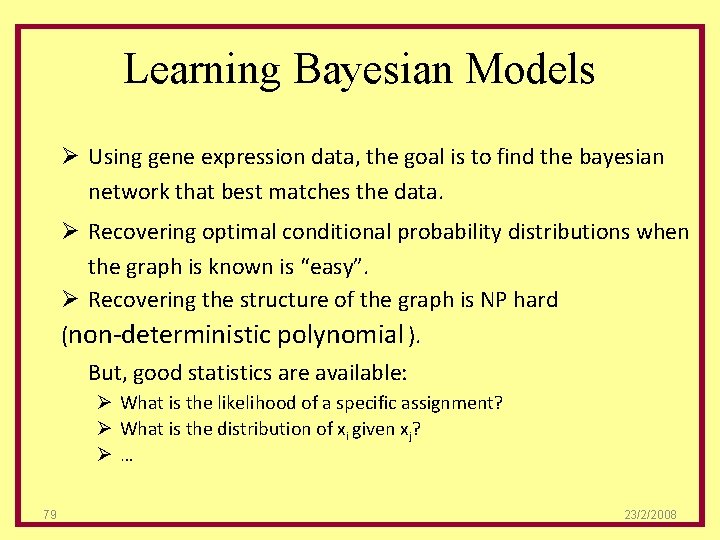
Learning Bayesian Models Ø Using gene expression data, the goal is to find the bayesian network that best matches the data. Ø Recovering optimal conditional probability distributions when the graph is known is “easy”. Ø Recovering the structure of the graph is NP hard (non-deterministic polynomial ). But, good statistics are available: Ø What is the likelihood of a specific assignment? Ø What is the distribution of xi given xj? Ø… 79 23/2/2008
Issues with Bayesian Models Ø Computationally intensive. Ø Requires lots of data. Ø Does not allow for feedback loops which are known to play an important role in biological networks. Ø Does not make use of the temporal aspect of the data. Ø Dynamical Bayesian Networks aim at solving some of these issues but they require even more data. 80 23/2/2008
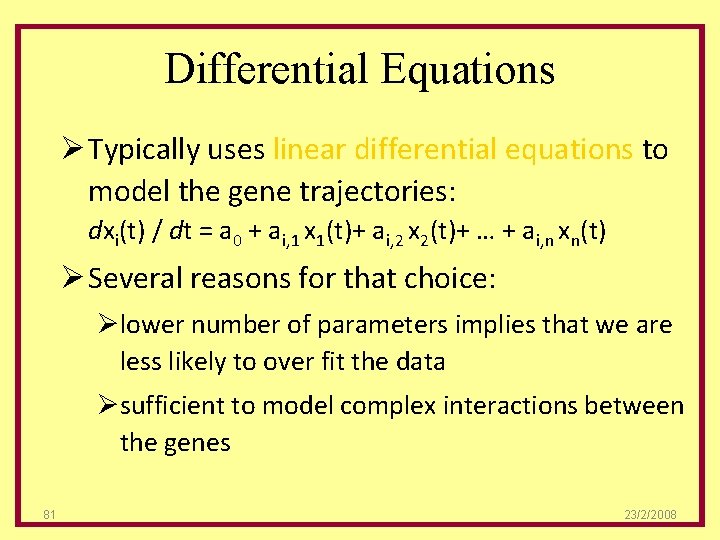
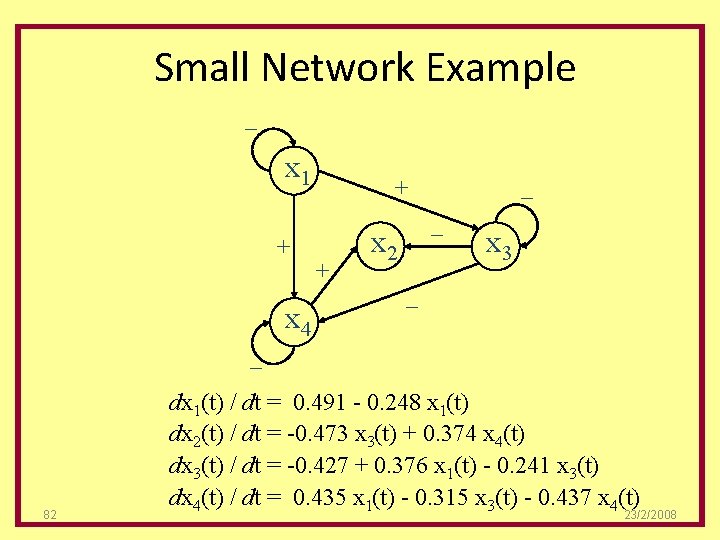
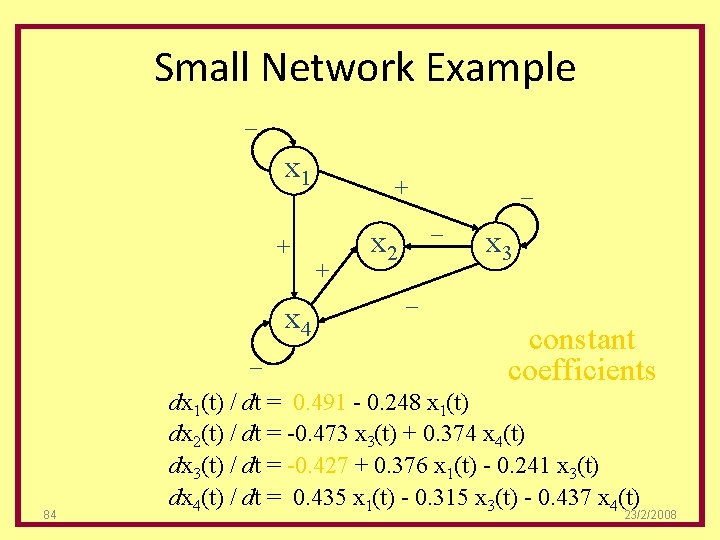
Differential Equations Ø Typically uses linear differential equations to model the gene trajectories: dxi(t) / dt = a 0 + ai, 1 x 1(t)+ ai, 2 x 2(t)+ … + ai, n xn(t) Ø Several reasons for that choice: Ølower number of parameters implies that we are less likely to over fit the data Øsufficient to model complex interactions between the genes 81 23/2/2008
Small Network Example _ x 1 + x 4 _ + + _ x 2 x 3 _ _ 82 dx 1(t) / dt = 0. 491 - 0. 248 x 1(t) dx 2(t) / dt = -0. 473 x 3(t) + 0. 374 x 4(t) dx 3(t) / dt = -0. 427 + 0. 376 x 1(t) - 0. 241 x 3(t) dx 4(t) / dt = 0. 435 x 1(t) - 0. 315 x 3(t) - 0. 437 x 4(t) 23/2/2008
Small Network Example _ x 1 + x 4 _ 83 _ + + _ x 2 x 3 _ one interaction coefficient dx 1(t) / dt = 0. 491 - 0. 248 x 1(t) dx 2(t) / dt = -0. 473 x 3(t) + 0. 374 x 4(t) dx 3(t) / dt = -0. 427 + 0. 376 x 1(t) - 0. 241 x 3(t) dx 4(t) / dt = 0. 435 x 1(t) - 0. 315 x 3(t) - 0. 437 x 4(t) 23/2/2008
Small Network Example _ x 1 + x 4 _ 84 _ + + _ x 2 x 3 _ constant coefficients dx 1(t) / dt = 0. 491 - 0. 248 x 1(t) dx 2(t) / dt = -0. 473 x 3(t) + 0. 374 x 4(t) dx 3(t) / dt = -0. 427 + 0. 376 x 1(t) - 0. 241 x 3(t) dx 4(t) / dt = 0. 435 x 1(t) - 0. 315 x 3(t) - 0. 437 x 4(t) 23/2/2008
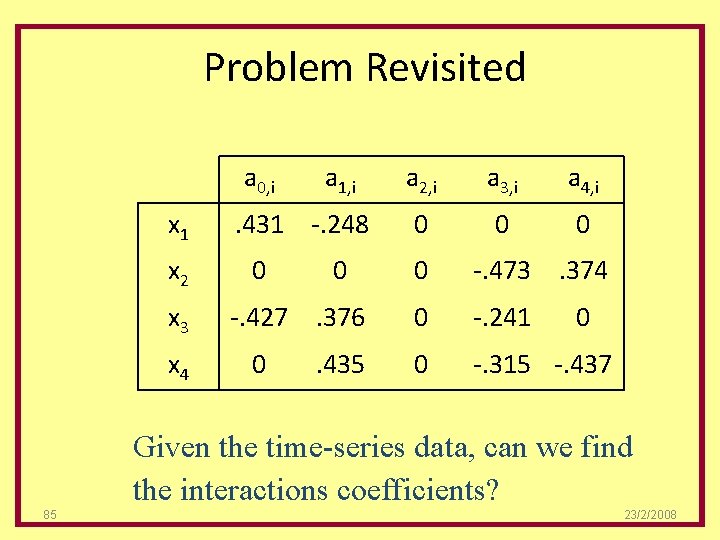
Problem Revisited a 0, i x 1 x 2 x 3 x 4 a 1, i . 431 -. 248 0 0 -. 427. 376 0 . 435 a 2, i a 3, i a 4, i 0 0 -. 473. 374 0 -. 241 0 -. 315 -. 437 0 Given the time-series data, can we find the interactions coefficients? 85 23/2/2008
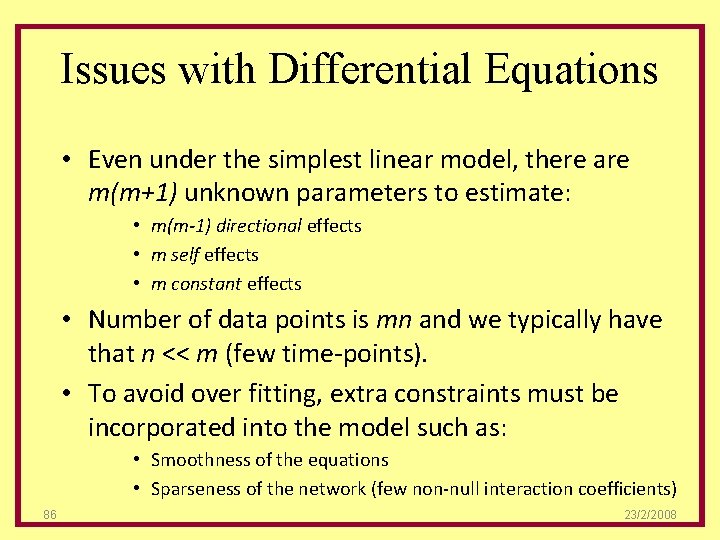
Issues with Differential Equations • Even under the simplest linear model, there are m(m+1) unknown parameters to estimate: • m(m-1) directional effects • m self effects • m constant effects • Number of data points is mn and we typically have that n << m (few time-points). • To avoid over fitting, extra constraints must be incorporated into the model such as: • Smoothness of the equations • Sparseness of the network (few non-null interaction coefficients) 86 23/2/2008
OUTLINES Ø What is the Gene Regulatory Network? GRN Ø Application of GRN Ø GRN Construction Methodology Ø GRN modeling steps Ø GRN Models ØGRS Software Ø Next work Ø Reference 87 23/2/2008
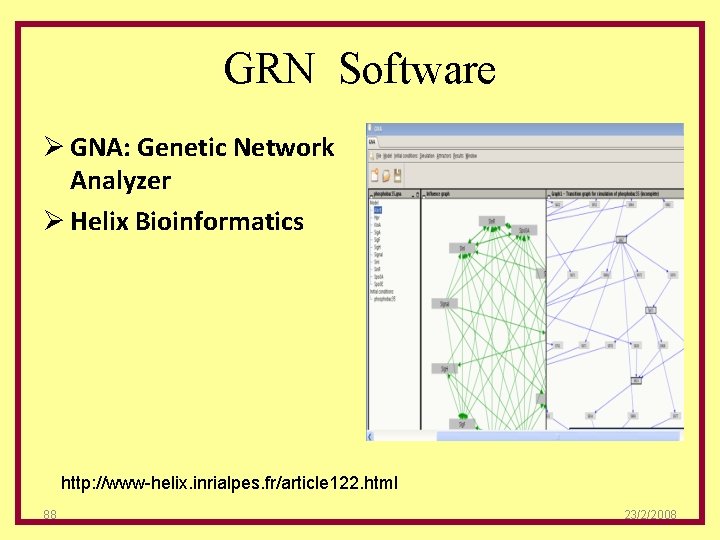
GRN Software Ø GNA: Genetic Network Analyzer Ø Helix Bioinformatics http: //www-helix. inrialpes. fr/article 122. html 88 23/2/2008
GRN Software Ø Probabilistic Boolean Networks (PBN) Ø Matlab Tool Box Ø Ilya Shmulevich Ø Institute for Systems Biology 89 23/2/2008
OUTLINES Ø What is the Gene Regulatory Network? GRN Ø Application of GRN Ø GRN Construction Methodology Ø GRN modeling steps Ø GRN Models Ø GRS Software ØNext work Ø Reference 90 23/2/2008
Future Work: Literature Review • Study the noisy natural of Microarray Data. • Study in depth the existing modeling methodology. • Focus on specialized problem like cancer. 91 23/2/2008
Future Work : GSP Statistics Books Ø Genomics signal processing and statistics, Edward, 2006 Ø Introduction to genomics signal processing with control, Ily, 2006 Ø Computational and Statistical Approaches to Genomics (Springer, 2006), Ily 92 23/2/2008
Future Work : Statistics Books Ø Handbook of Computational Statistics Ø An Introduction to Statistical Signal Processing, Robert M. Gray, 2007 Ø fundamentals of statistical signal processing : estimation theory, steven kay Ø nonlinear signal processing a statistical approach, Gonzalo R, 2005 Ø Inference_in_HMM, Olivier Cappe, 2005 93 23/2/2008
Future Work : Modeling Books Ø Modeling and Control of Complex Systems (Control Engineering) by Petros A. Ioannou, Andreas Pitsillides, 2008 Ø MODELING BIOLOGICAL SYSTEMS: Principles and Applications 2005 Ø gene regulation and metabolism postgenomic computational approaches, Julio, 2000 94 23/2/2008
Future Work: Resources Ø Ø Ø Ø 95 IEEE Transactions on Computational Biology and Bioinformatics IEEE International Workshop on Genomic Signal Processing and Statistics IEEE Journal of Selected Topics in Signal Processing: Special Issue on Genomic and Proteomic Signal Processing EURASIP Journal of Bioinformatics and Systems Biology Special issue of the on Genetic Regulatory Networks IEEE Signal Processing Magazine on Signal Processing Special issue of the Methods in Genomics and Proteomics IEEE Transactions on Signal Processing Special Genomic Signal Processing issue of the Workshop on Discrete Models for Genetic Regulatory Networks 23/2/2008
OUTLINES Ø What is the Gene Regulatory Network? GRN Ø Application of GRN Ø GRN Construction Methodology Ø GRN modeling steps Ø GRN Models Ø GRS Software Ø Next work ØReference 96 23/2/2008
Reference Ø Hidde de Jong, Modeling and simulation of genetic regulatory systems: a literature review; J Comput Biol. 2002; 9(1): 67 -103. Review. Ø BAYESIAN ROBUSTNESS IN THE CONTROL OF GENE REGULATORY NETWORKS Ranadip Pal 1, Aniruddha Datta 2, Edward R. Dougherty Ø Anastassiou, D. (2001). Genomic Signal Processing. IEEE Signal Processing Ø Dougherty, E. R. and A. Datta (2005). "Genomic signal processing: diagnosis and therapy. " Signal Processing Magazine, IEEE 22(1): 107 - 112. Ø Vaidyanathan, P. P. (2004). Genomics and Proteomics: A Signal Processorapos's Tour. Circuits and Systems Magazine, IEEE. 4: 1 -1. 97 23/2/2008
Reference Ø Vaidyanathan, P. P. and B. -J. Yoon (2004). "The role of signal-processing concepts in genomics and proteomics. " Journal of the Franklin Institute. (Special Issue on Genomics). 98 23/2/2008
99 23/2/2008