Welcome to DataDriven Decision Making Presenter Gene Woodard






- Slides: 30
Welcome to Data-Driven Decision Making Presenter: Gene Woodard
Gene Woodard Director of the Building Services Department (BSD) at the University of Washington Sponsored by Tennant Company 2
Presentation Overview What we will cover today: o How data and measurement drives performance o Using measurement as a validation tool (testing, testing decision making) o How data can complete your story 3
Presentation Overview What we will cover today: If you discover something, write it down and make plans to implement it next week. self: o t Note dea i w e nt n e m e l Imp ek! e w t nex 4
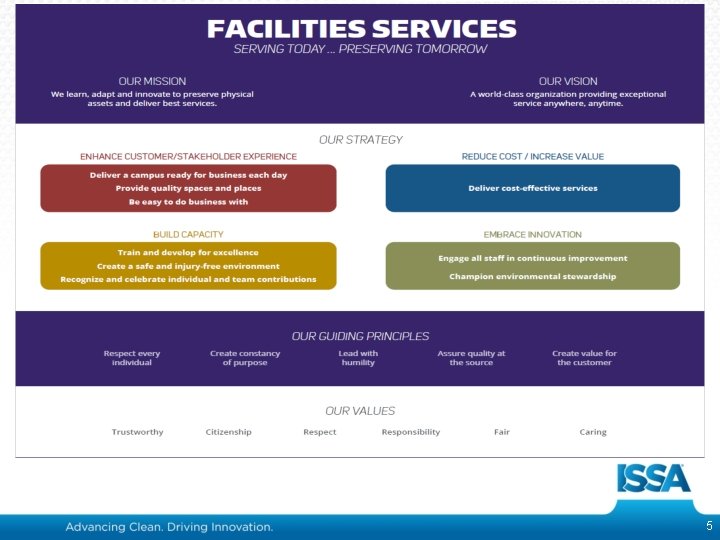
5
UW Scorecard Example Critical elements: 1. Specific metrics tied to key objectives 2. Measure champion 3. Measure owner Critical Elements of Scorecard 1. Specific Metrics Tied to Key Objectives 2. Measure Champion 3. Measure Owner 6
Ready for Business
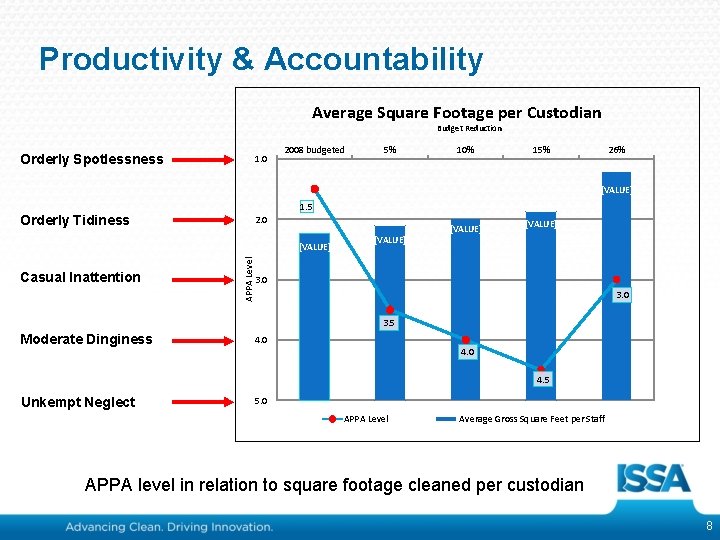
Productivity & Accountability Average Square Footage per Custodian Budget Reduction Orderly Spotlessness 1. 0 2008 budgeted 5% 10% 15% 26% 50, 000 45, 000 [VALUE] 1. 5 Orderly Tidiness 2. 0 APPA Level [VALUE] Casual Inattention 40, 000 [VALUE] 1. [VALUE] 35, 000 Critical Elements of Scorecard Specific Metrics Tied to Key Objectives 3. 0 2. Measure Champion 3. Measure Owner 20, 000 15, 000 4. 0 10, 000 4. 5 Unkempt Neglect 25, 000 3. 5 Moderate Dinginess 30, 000 5. 0 5, 000 0 APPA Level Average Gross Square Feet per Staff APPA level in relation to square footage cleaned per custodian 8
Enhance Customer / Stakeholder Experience
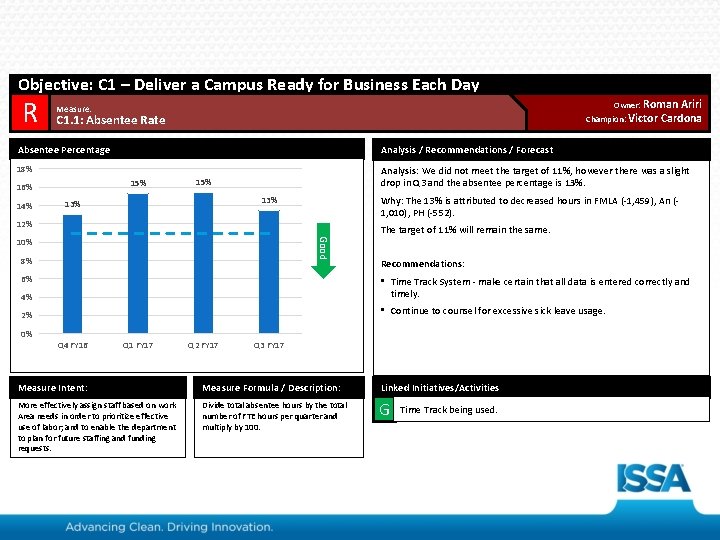
Objective: C 1 – Deliver a Campus Ready for Business Each Day G R Owner: Roman Measure: Champion: Victor C 1. 1: Absentee Rate Absentee Percentage Analysis / Recommendations / Forecast 18% 15% 16% 14% Ariri Cardona Analysis: We did not meet the target of 11%, however there was a slight drop in Q 3 and the absentee percentage is 13%. 15% Why: The 13% is attributed to decreased hours in FMLA (-1, 459), An (1, 010), PH (-552). 13% 12% The target of 11% will remain the same. Good 10% 8% 6% Recommendations: 4% • Time Track System - make certain that all data is entered correctly and timely. 2% • Continue to counsel for excessive sick leave usage. 0% Q 4 FY 16 Q 1 FY 17 Q 2 FY 17 Q 3 FY 17 Measure Intent: Measure Formula / Description: Linked Initiatives/Activities More effectively assign staff based on work Area needs in order to prioritize effective use of labor; and to enable the department to plan for future staffing and funding requests. Divide total absentee hours by the total number of FTE hours per quarter and multiply by 100. G Time Track being used. 10
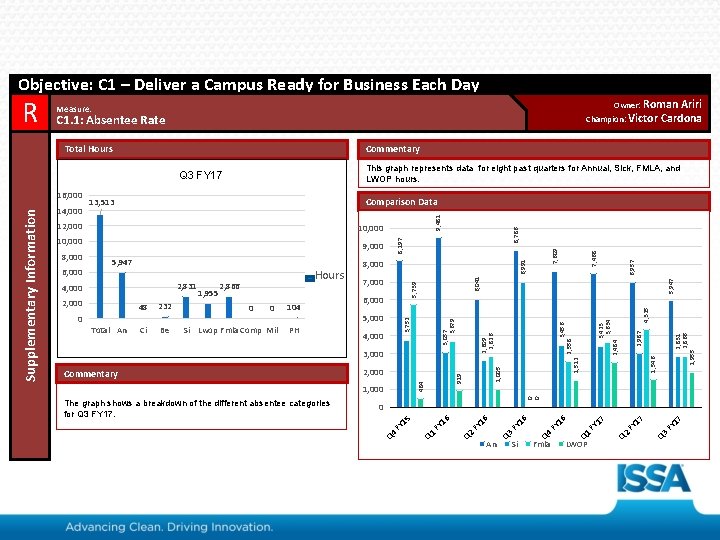
Objective: C 1 – Deliver a Campus Ready for Business Each Day Owner: Roman Measure: Champion: Victor C 1. 1: Absentee Rate Total Hours This graph represents data for eight past quarters for Annual, Sick, FMLA, and LWOP hours. Q 3 FY 17 6, 957 7, 468 5, 947 4, 325 2, 831 2, 866 1, 955 2, 484 2, 987 3, 423 3, 634 1, 546 1, 005 484 0 0 1, 000 Fmla 17 FY 17 LWOP Q 3 Si Q 2 An FY 16 FY Q 2 Q 1 FY 16 0 15 The graph shows a breakdown of the different absentee categories for Q 3 FY 17. 919 2, 000 1, 512 4, 000 3, 000 Commentary 7, 609 8, 786 6, 991 5, 000 Q 1 PH 6, 000 3, 456 Si Lwop Fmla Comp Mil 104 2, 558 Be 0 16 Ci 0 FY Total An 232 7, 000 Q 4 0 48 2, 866 16 2, 000 1, 955 8, 000 FY 2, 831 4, 000 Hours Q 3 5, 947 6, 041 6, 000 9, 000 3, 057 3, 679 8, 000 5, 739 10, 000 8, 197 10, 000 2, 609 2, 826 12, 000 9, 481 Comparison Data 13, 513 3, 752 14, 000 FY Supplementary Information 16, 000 Ariri Cardona Commentary Q 4 G R
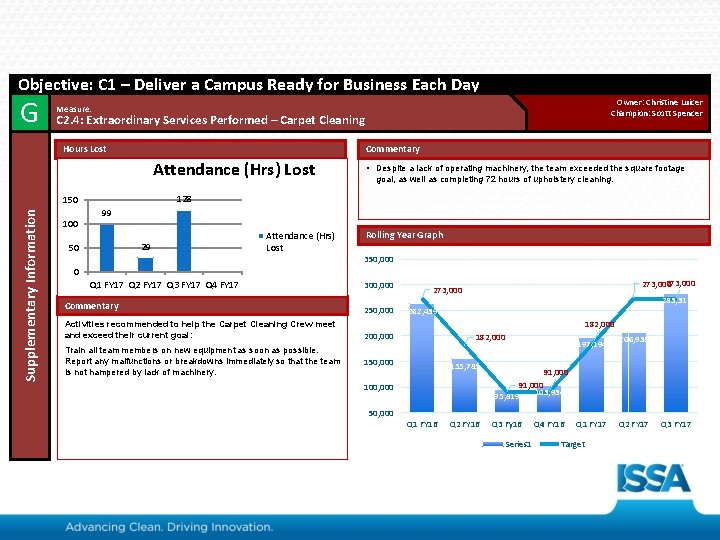
Objective: C 1 – Deliver a Campus Ready for Business Each Day G C 2. 4: Extraordinary Services Performed – Carpet Cleaning Hours Lost Commentary Attendance (Hrs) Lost 100 • Despite a lack of operating machinery, the team exceeded the square footage goal, as well as completing 72 hours of upholstery cleaning. 128 150 Supplementary Information Owner: Christine Luicer Champion: Scott Spencer Measure: 99 29 50 Attendance (Hrs) Lost Rolling Year Graph 350, 000 0 Q 1 FY 17 Q 2 FY 17 Q 3 FY 17 Q 4 FY 17 300, 000 Commentary 250, 000 Activities recommended to help the Carpet Cleaning Crew meet and exceed their current goal: 200, 000 Train all team members on new equipment as soon as possible. Report any malfunctions or breakdowns immediately so that the team is not hampered by lack of machinery. 273, 000 283, 317 262, 439 182, 000 150, 000 155, 783 100, 000 50, 000 Q 1 FY 16 Q 2 FY 16 197, 194 206, 938 91, 000 103, 934 95, 819 Q 3 Fy 16 Series 1 Q 4 FY 16 Q 1 FY 17 Q 2 FY 17 Q 3 FY 17 Target 12
Quality
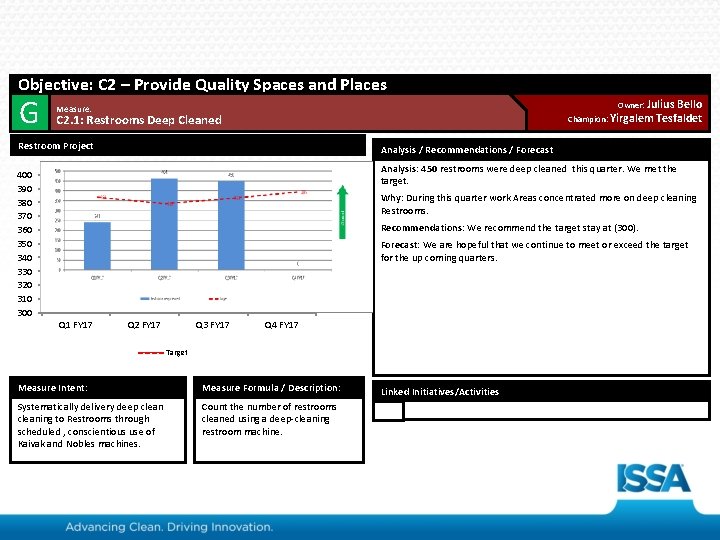
Objective: C 2 – Provide Quality Spaces and Places G R Owner: Julius Measure: Champion: Yirgalem C 2. 1: Restrooms Deep Cleaned Restroom Project Analysis / Recommendations / Forecast Analysis: 450 restrooms were deep cleaned this quarter. We met the target. 395 Why: During this quarter work Areas concentrated more on deep cleaning Restrooms. 368 363 Good 400 390 380 370 360 350 340 330 320 310 300 336 Q 1 FY 17 Bello Tesfaldet Q 2 FY 17 Q 3 FY 17 Recommendations: We recommend the target stay at (300). Forecast: We are hopeful that we continue to meet or exceed the target for the up coming quarters. Q 4 FY 17 Target Measure Intent: Measure Formula / Description: Linked Initiatives/Activities Systematically delivery deep cleaning to Restrooms through scheduled , conscientious use of Kaivak and Nobles machines. Count the number of restrooms cleaned using a deep-cleaning restroom machine. R 14
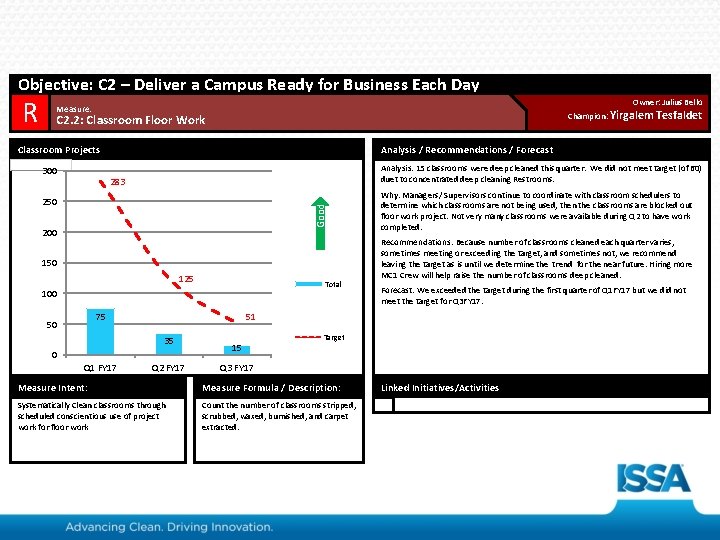
Objective: C 2 – Deliver a Campus Ready for Business Each Day G R Owner: Julius Bello Measure: Champion: Yirgalem C 2. 2: Classroom Floor Work Classroom Projects 300 Analysis / Recommendations / Forecast Analysis: 15 classrooms were deep cleaned this quarter. We did not meet target (of 60) duet to concentrated deep cleaning Restrooms. 283 Good 250 200 150 125 Total 100 75 50 Tesfaldet Recommendations: Because number of classrooms cleaned each quarter varies, sometimes meeting or exceeding the target, and sometimes not, we recommend leaving the target as is until we determine the trend for the near future. Hiring more MC 1 Crew will help raise the number of classrooms deep cleaned. Forecast: We exceeded the target during the first quarter of Q 1 FY 17 but we did not meet the target for Q 3 FY 17. 51 35 0 Q 1 FY 17 Why: Managers/ Supervisors continue to coordinate with classroom schedulers to determine which classrooms are not being used, then the classrooms are blocked out floor work project. Not very many classrooms were available during Q 2 to have work completed. Q 2 FY 17 15 Target Q 3 FY 17 Measure Intent: Measure Formula / Description: Systematically Clean classrooms through scheduled conscientious use of project work for floor work Count the number of classrooms stripped, scrubbed, waxed, burnished, and carpet extracted. . . restrooms Linked Initiatives/Activities R 15
Reduce Cost / Increase Value
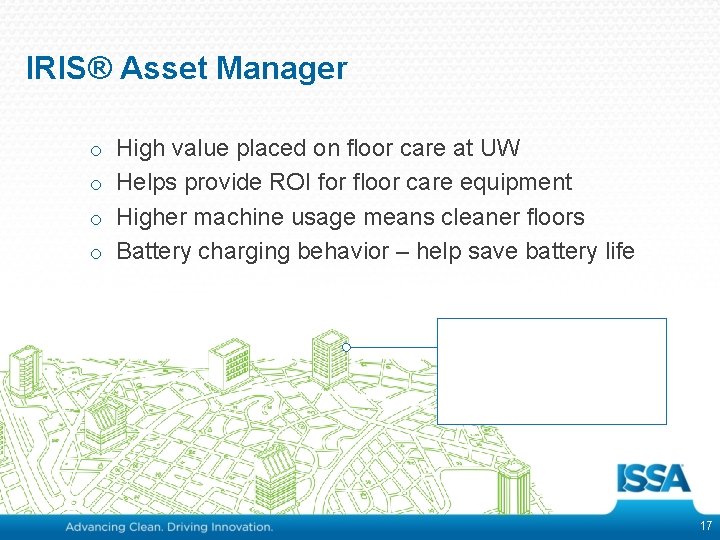
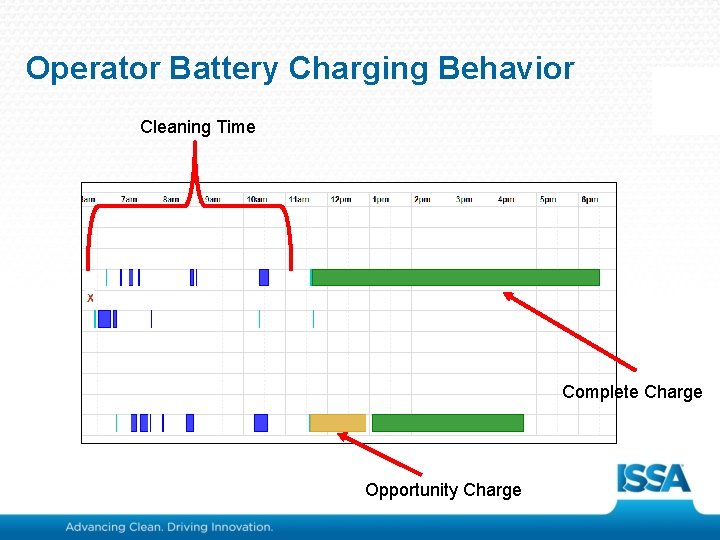
IRIS® Asset Manager o High value placed on floor care at UW o Helps provide ROI for floor care equipment o Higher machine usage means cleaner floors o Battery charging behavior – help save battery life 17
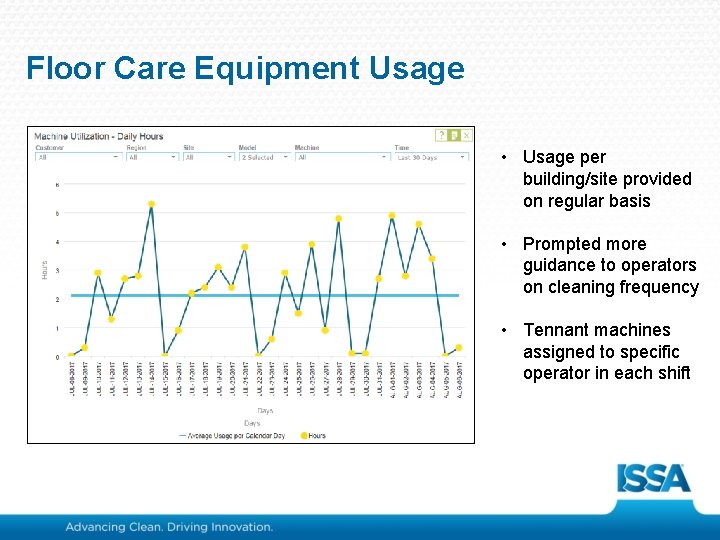
Floor Care Equipment Usage • Usage per building/site provided on regular basis • Prompted more guidance to operators on cleaning frequency • Tennant machines assigned to specific operator in each shift
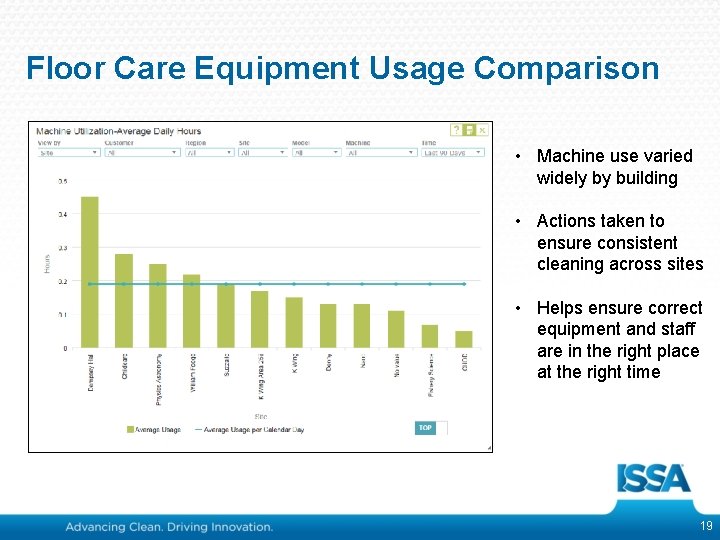
Floor Care Equipment Usage Comparison • Machine use varied widely by building • Actions taken to ensure consistent cleaning across sites • Helps ensure correct equipment and staff are in the right place at the right time 19
Operator Battery Charging Behavior Cleaning Time Complete Charge Opportunity Charge
Engage Staff
Leadership Principles (SHINGO Model) o Respect every individual o Constancy of purpose o Lead with humility “What if, and I know this sounds kooky, we communicated with the employees. ” 22
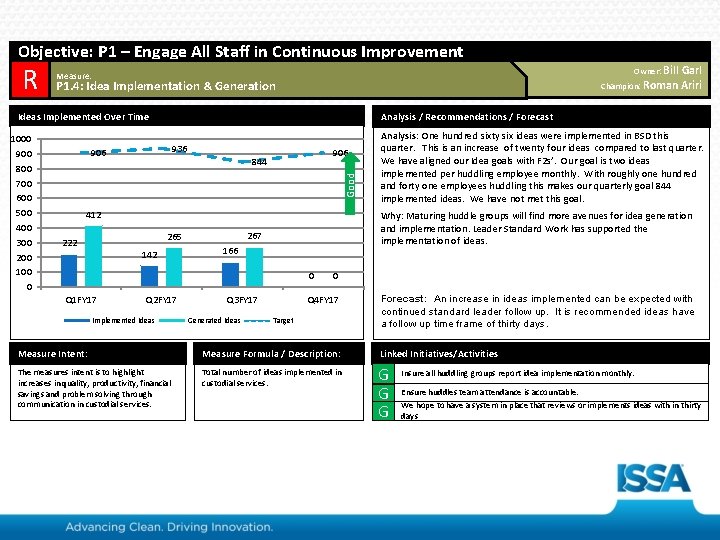
Objective: P 1 – Engage All Staff in Continuous Improvement R Owner: Bill Garl Champion: Roman Ariri Measure: P 1. 4: Idea Implementation & Generation Ideas Implemented Over Time 936 906 844 Good 1000 900 800 700 600 500 400 300 200 100 0 Analysis / Recommendations / Forecast 412 142 Why: Maturing huddle groups will find more avenues for idea generation and implementation. Leader Standard Work has supported the implementation of ideas. 267 265 222 166 0 Q 1 FY 17 Q 2 FY 17 Implemented Ideas Q 3 FY 17 Generated Ideas Analysis: One hundred sixty six ideas were implemented in BSD this quarter. This is an increase of twenty four ideas compared to last quarter. We have aligned our Idea goals with F 2 s’. Our goal is two ideas implemented per huddling employee monthly. With roughly one hundred and forty one employees huddling this makes our quarterly goal 844 implemented ideas. We have not met this goal. 0 Q 4 FY 17 Target Forecast: An increase in ideas implemented can be expected with continued standard leader follow up. It is recommended ideas have a follow up time frame of thirty days. Measure Intent: Measure Formula / Description: Linked Initiatives/Activities The measures intent is to highlight increases in quality, productivity, financial savings and problem solving through communication in custodial services. Total number of ideas implemented in custodial services. G G G Insure all huddling groups report idea implementation monthly. Ensure huddles team attendance is accountable. We hope to have a system in place that reviews or implements ideas with in thirty days
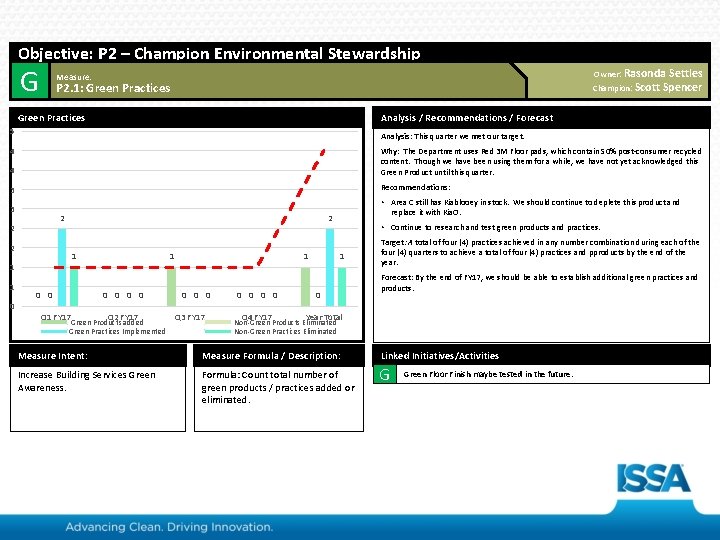
Objective: P 2 – Champion Environmental Stewardship G Owner: Rasonda Measure: Champion: Scott P 2. 1: Green Practices Settles Spencer Analysis / Recommendations / Forecast 5 Analysis: This quarter we met our target. 4 4 Why: The Department uses Red 3 M Floor pads, which contain 50% post-consumer recycled content. Though we have been using them for a while, we have not yet acknowledged this Green Product until this quarter. 3 Recommendations: • Area C still has Kiablooey in stock. We should continue to deplete this product and 3 2 2 2 1 1 1 0 replace it with Kia. O. 2 0 0 1 0 0 Q 1 FY 17 Q 2 FY 17 Green Products added Green Practices Implemented 1 0 0 0 Q 3 FY 17 0 0 Q 4 FY 17 • Continue to research and test green products and practices. 1 0 Target: A total of four (4) practices achieved in any number combination during each of the four (4) quarters to achieve a total of four (4) practices and pproducts by the end of the year. Forecast: By the end of FY 17, we should be able to establish additional green practices and products. Year Total Non-Green Products Eliminated Non-Green Practices Eliminated Measure Intent: Measure Formula / Description: Linked Initiatives/Activities Increase Building Services Green Awareness. Formula: Count total number of green products / practices added or eliminated. G Green Floor Finish maybe tested in the future.
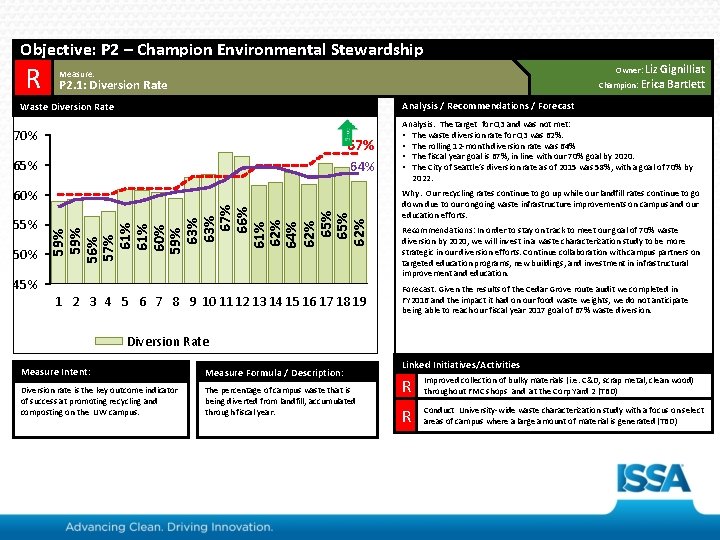
Objective: P 2 – Champion Environmental Stewardship G R Owner: Liz Owner: Gignilliat Bartlett Jessica Lisiewski Measure: Champion: Erica P 2. 1: P 2. 4: Diversion Rate Analysis / Recommendations / Forecast Waste Diversion Rate 70% 67% 65% 64% 55% 50% 59% 56% 57% 61% 60% 59% 63% 67% 66% 61% 62% 64% 62% 65% 62% 60% 45% 1 2 3 4 5 6 7 8 9 10 11 12 13 14 15 16 17 18 19 Analysis: The target for Q 3 and was not met: • The waste diversion rate for Q 3 was 62%. • The rolling 12 -month diversion rate was 64% • The fiscal year goal is 67%, in line with our 70% goal by 2020. • The City of Seattle’s diversion rate as of 2015 was 58%, with a goal of 70% by 2022. Why: Our recycling rates continue to go up while our landfill rates continue to go down due to our ongoing waste infrastructure improvements on campus and our education efforts. Recommendations: In order to stay on track to meet our goal of 70% waste diversion by 2020, we will invest in a waste characterization study to be more strategic in our diversion efforts. Continue collaboration with campus partners on targeted education programs, new buildings, and investment in infrastructural improvement and education. Forecast: Given the results of the Cedar Grove route audit we completed in FY 2016 and the impact it had on our food waste weights, we do not anticipate being able to reach our fiscal year 2017 goal of 67% waste diversion. Diversion Rate Measure Intent: Measure Formula / Description: Diversion rate is the key outcome indicator of success at promoting recycling and composting on the UW campus. The percentage of campus waste that is being diverted from landfill, accumulated through fiscal year. Linked Initiatives/Activities R Improved collection of bulky materials (i. e. C&D, scrap metal, clean wood) throughout FMC shops and at the Corp Yard 2 (TBD) R Conduct University-wide waste characterization study with a focus on select areas of campus where a large amount of material is generated (TBD)
Customer Service
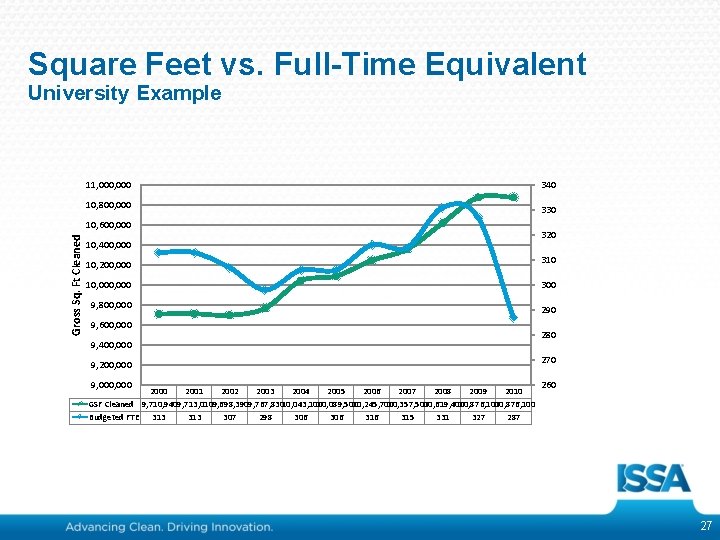
Square Feet vs. Full-Time Equivalent University Example 11, 000 10, 800, 000 Gross Sq. Ft Cleaned 10, 600, 000 10, 400, 000 10, 200, 000 10, 000 9, 800, 000 9, 600, 000 9, 400, 000 9, 200, 000 9, 000 2000 2001 2002 2003 2004 2005 2006 2007 2008 2009 2010 GSF Cleaned 9, 710, 940 9, 713, 010 9, 698, 390 9, 767, 830 10, 043, 100 10, 089, 500 10, 245, 700 10, 357, 500 10, 619, 400 10, 876, 100 Budgeted FTE 313 307 298 306 316 315 331 327 287 340 330 320 310 300 290 280 270 260 27
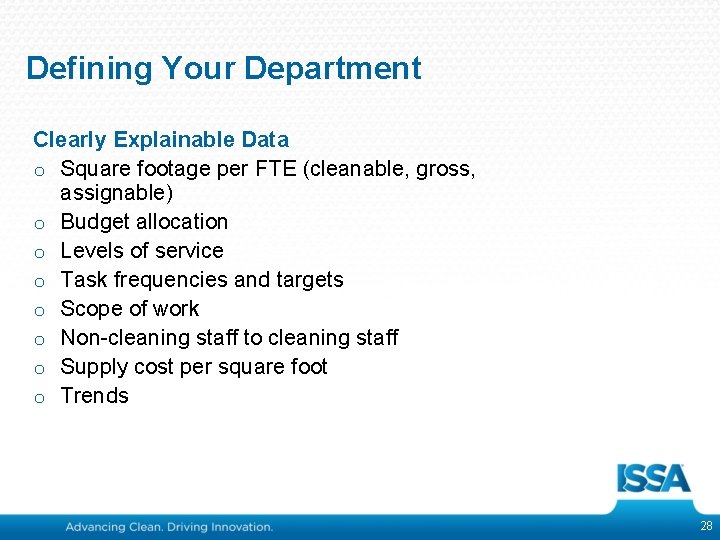
Defining Your Department Clearly Explainable Data o Square footage per FTE (cleanable, gross, assignable) o Budget allocation o Levels of service o Task frequencies and targets o Scope of work o Non-cleaning staff to cleaning staff o Supply cost per square foot o Trends 28
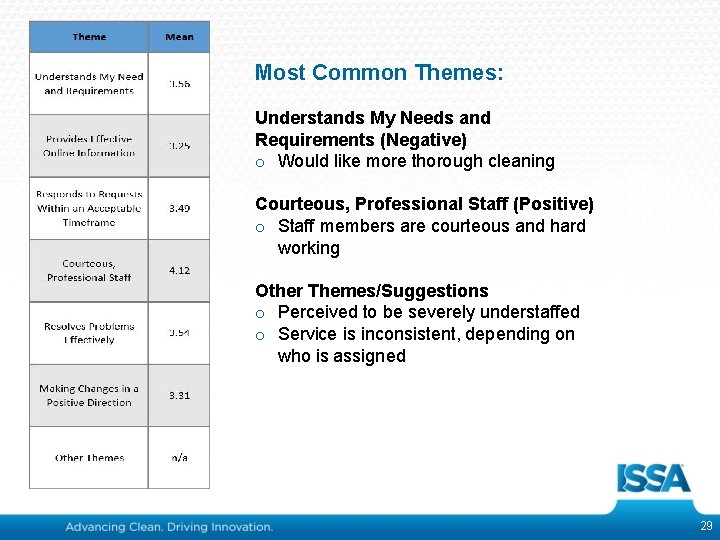
Most Common Themes: Understands My Needs and Requirements (Negative) o Would like more thorough cleaning Courteous, Professional Staff (Positive) o Staff members are courteous and hard working Other Themes/Suggestions o Perceived to be severely understaffed o Service is inconsistent, depending on who is assigned 29
Questions & Answers