Software Tools for Network Modeling Kuki A Sztrik



- Slides: 54
Software Tools for Network Modeling Kuki A. -Sztrik J. -Bolch G. University of Debrecen, Hungary University of Erlangen, Germany
Content • Introduction • PEPSY-QNS • Win. PEPSY • Using Win. PEPSY
Overview Running programs compete for computing resources, eg. CPU RAM Peripheries, etc.
The systems Systems are working on large variety of machines High level of complexity System optimization is a very difficult task
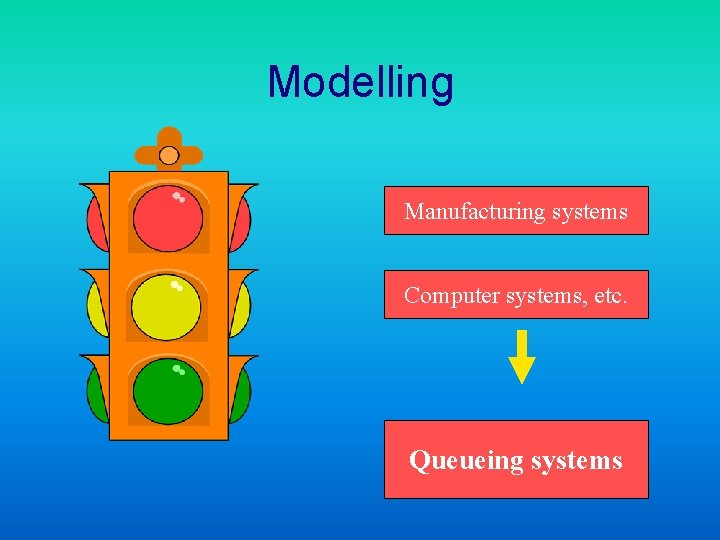
Modelling Manufacturing systems Computer systems, etc. Queueing systems
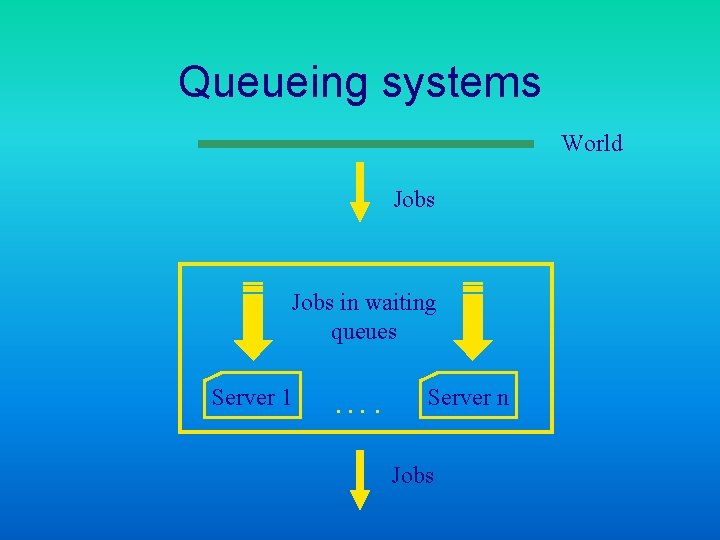
Queueing systems World Jobs in waiting queues Server 1 …. Server n Jobs
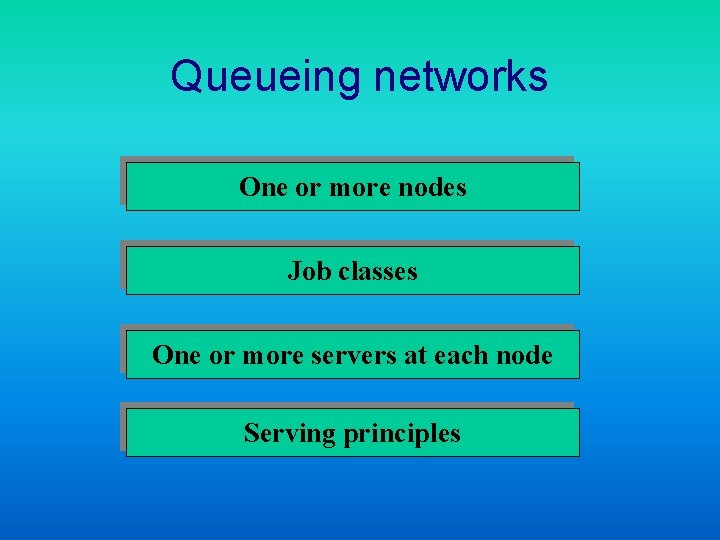
Queueing networks One or more nodes Job classes One or more servers at each node Serving principles
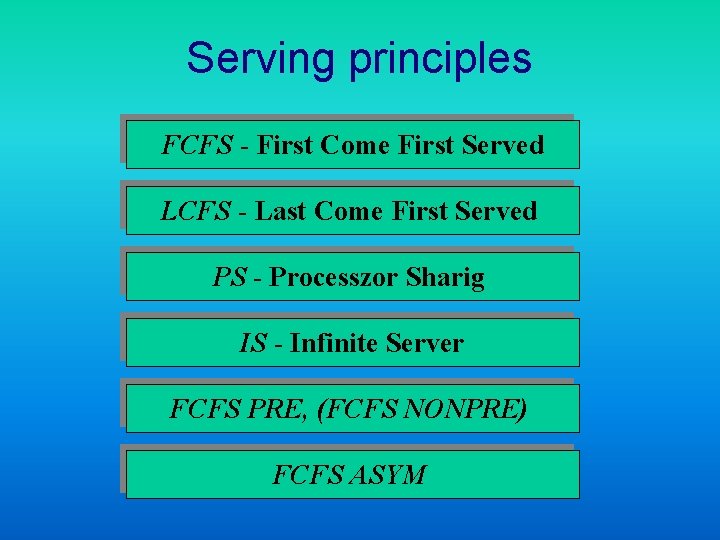
Serving principles FCFS - First Come First Served LCFS - Last Come First Served PS - Processzor Sharig IS - Infinite Server FCFS PRE, (FCFS NONPRE) FCFS ASYM
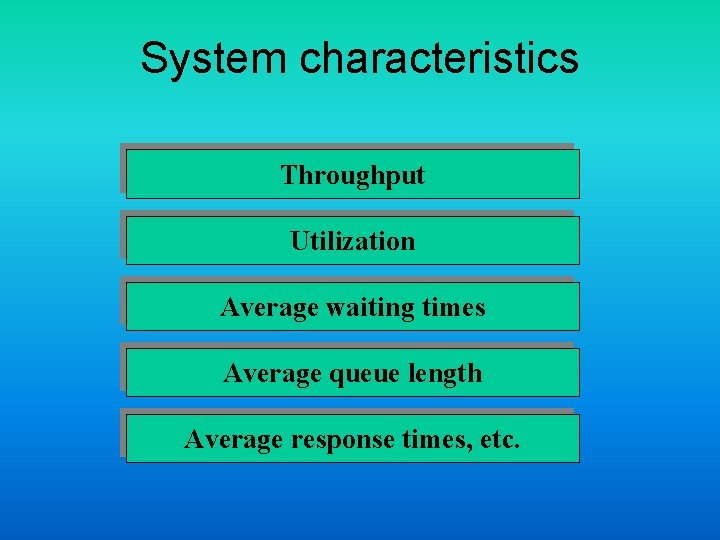
System characteristics Throughput Utilization Average waiting times Average queue length Average response times, etc.
Content • Introduction • PEPSY-QNS • Win. PEPSY • Using Win. PEPSY
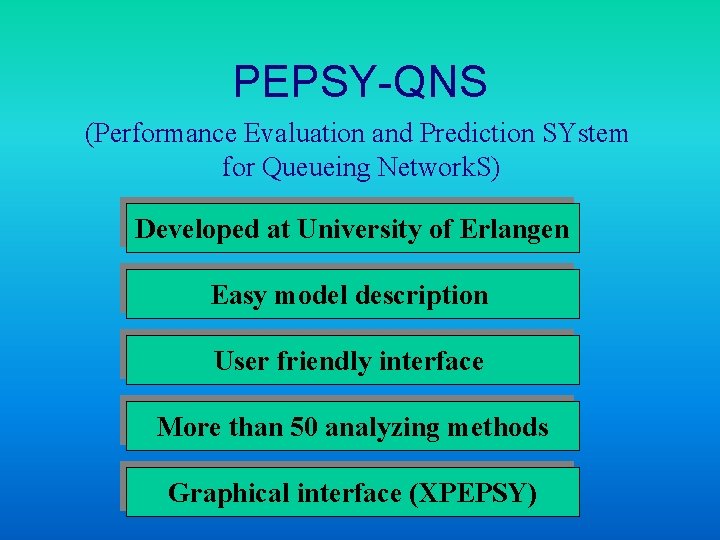
PEPSY-QNS (Performance Evaluation and Prediction SYstem for Queueing Network. S) Developed at University of Erlangen Easy model description User friendly interface More than 50 analyzing methods Graphical interface (XPEPSY)
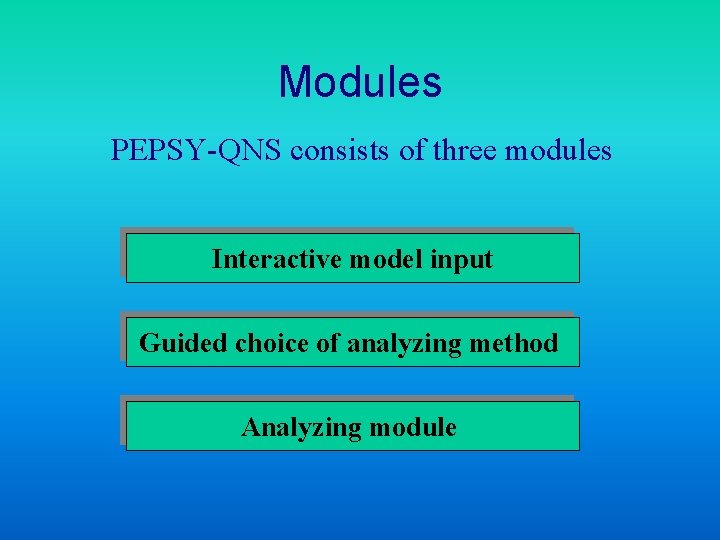
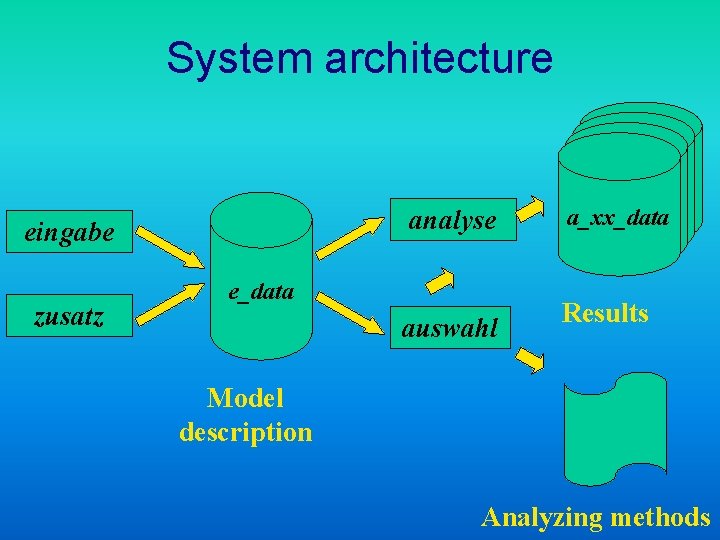
Modules PEPSY-QNS consists of three modules Interactive model input Guided choice of analyzing method Analyzing module
System architecture analyse eingabe zusatz e_data auswahl a_xx_data Results Model description Analyzing methods
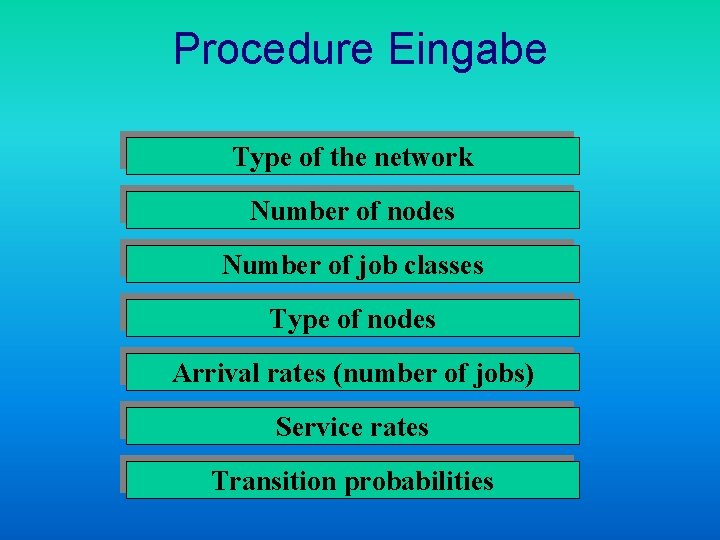
Procedure Eingabe Type of the network Number of nodes Number of job classes Type of nodes Arrival rates (number of jobs) Service rates Transition probabilities
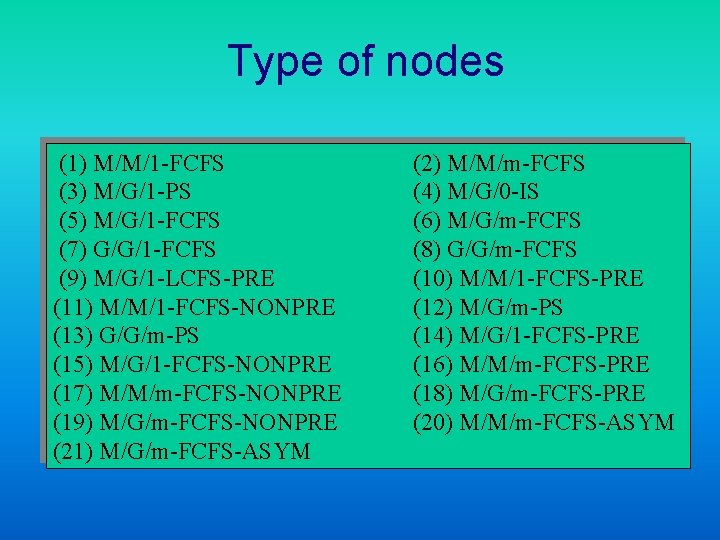
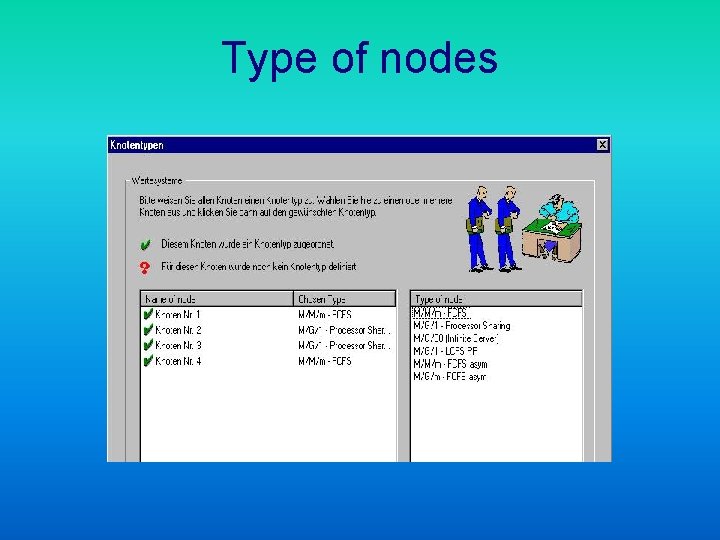
Type of nodes (1) M/M/1 -FCFS (3) M/G/1 -PS (5) M/G/1 -FCFS (7) G/G/1 -FCFS (9) M/G/1 -LCFS-PRE (11) M/M/1 -FCFS-NONPRE (13) G/G/m-PS (15) M/G/1 -FCFS-NONPRE (17) M/M/m-FCFS-NONPRE (19) M/G/m-FCFS-NONPRE (21) M/G/m-FCFS-ASYM (2) M/M/m-FCFS (4) M/G/0 -IS (6) M/G/m-FCFS (8) G/G/m-FCFS (10) M/M/1 -FCFS-PRE (12) M/G/m-PS (14) M/G/1 -FCFS-PRE (16) M/M/m-FCFS-PRE (18) M/G/m-FCFS-PRE (20) M/M/m-FCFS-ASYM
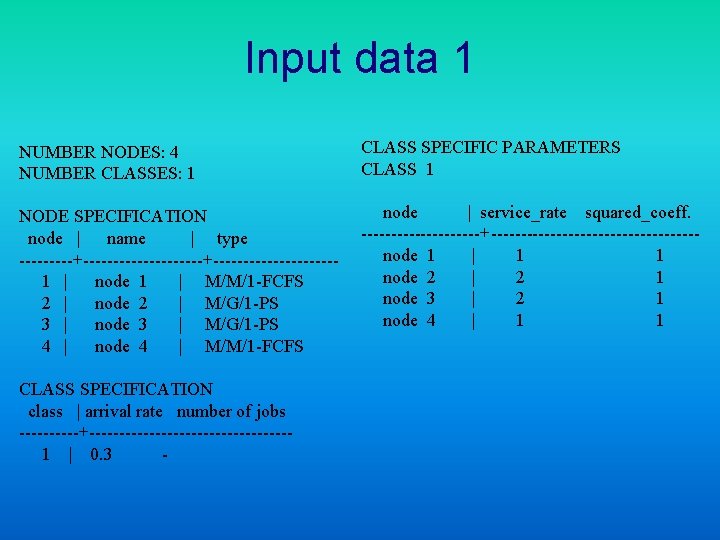
Input data 1 NUMBER NODES: 4 NUMBER CLASSES: 1 CLASS SPECIFIC PARAMETERS CLASS 1 NODE SPECIFICATION node | name | type ---------+----------------1 | node 1 | M/M/1 -FCFS 2 | node 2 | M/G/1 -PS 3 | node 3 | M/G/1 -PS 4 | node 4 | M/M/1 -FCFS node | service_rate squared_coeff. ----------+-----------------node 1 | 1 1 node 2 | 2 1 node 3 | 2 1 node 4 | 1 1 CLASS SPECIFICATION class | arrival rate number of jobs -----+-----------------1 | 0. 3 -
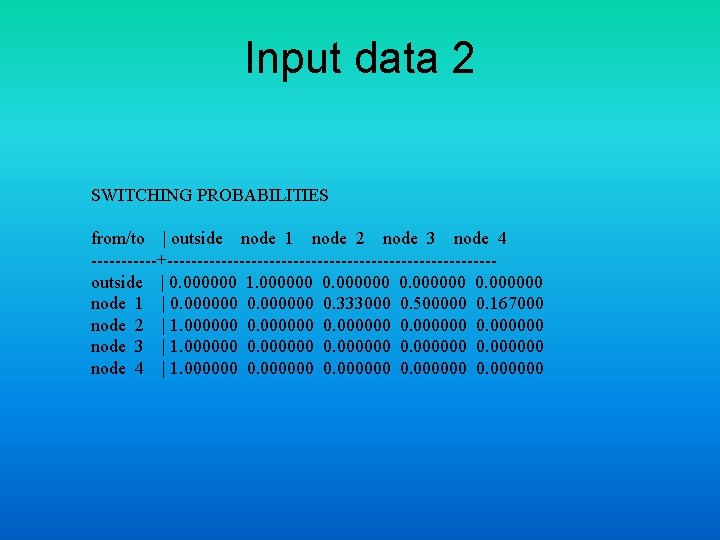
Input data 2 SWITCHING PROBABILITIES from/to | outside node 1 node 2 node 3 node 4 ------+---------------------------outside | 0. 000000 1. 000000 0. 000000 node 1 | 0. 000000 0. 333000 0. 500000 0. 167000 node 2 | 1. 000000 0. 000000 node 3 | 1. 000000 0. 000000 node 4 | 1. 000000 0. 000000
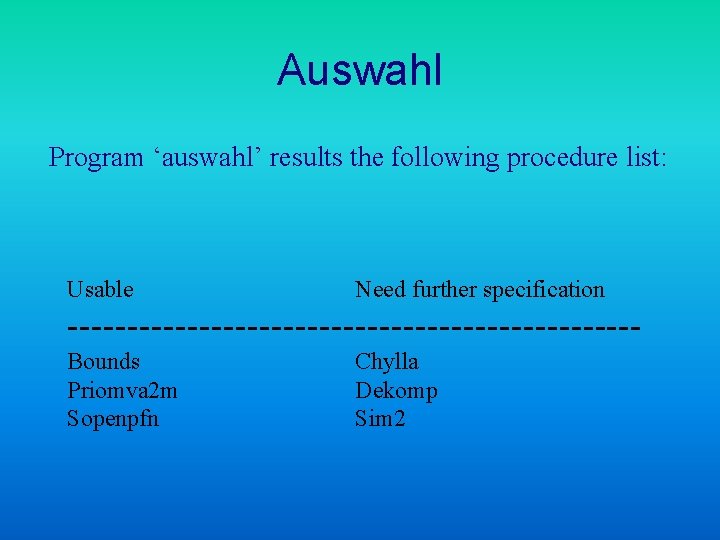
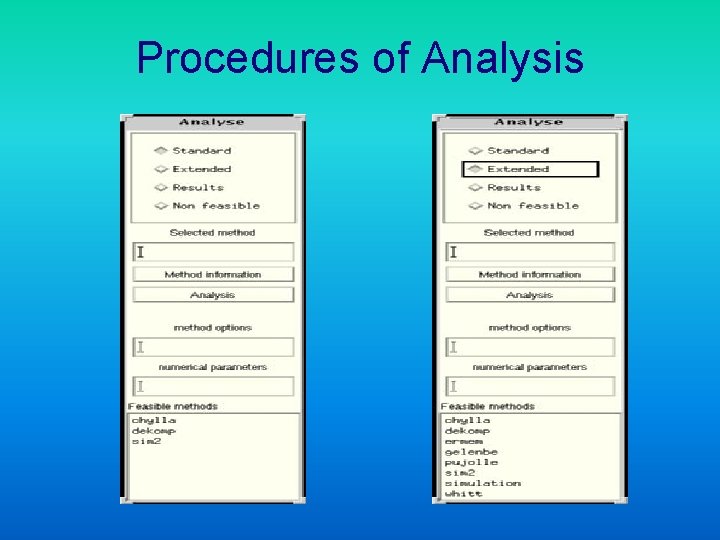
Auswahl Program ‘auswahl’ results the following procedure list: Usable Need further specification ------------------------Bounds Priomva 2 m Sopenpfn Chylla Dekomp Sim 2
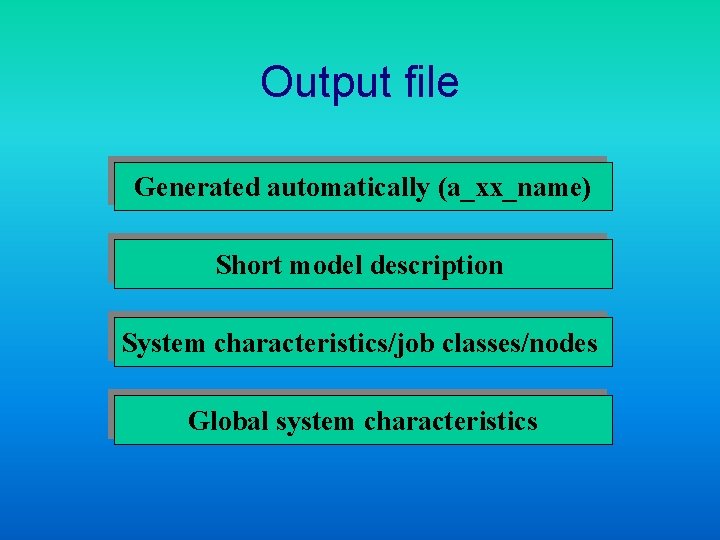
Output file Generated automatically (a_xx_name) Short model description System characteristics/job classes/nodes Global system characteristics
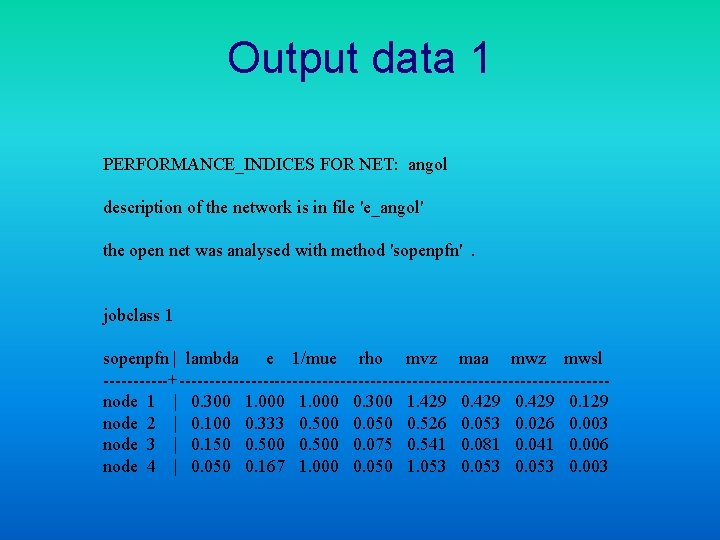
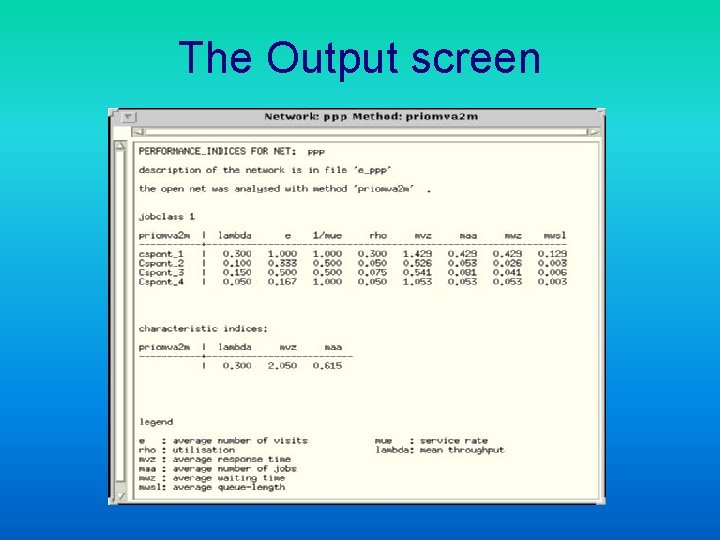
Output data 1 PERFORMANCE_INDICES FOR NET: angol description of the network is in file 'e_angol' the open net was analysed with method 'sopenpfn'. jobclass 1 sopenpfn | lambda e 1/mue rho mvz maa mwz mwsl ------+------------------------------------node 1 | 0. 300 1. 000 0. 300 1. 429 0. 129 node 2 | 0. 100 0. 333 0. 500 0. 050 0. 526 0. 053 0. 026 0. 003 node 3 | 0. 150 0. 500 0. 075 0. 541 0. 081 0. 041 0. 006 node 4 | 0. 050 0. 167 1. 000 0. 050 1. 053 0. 003
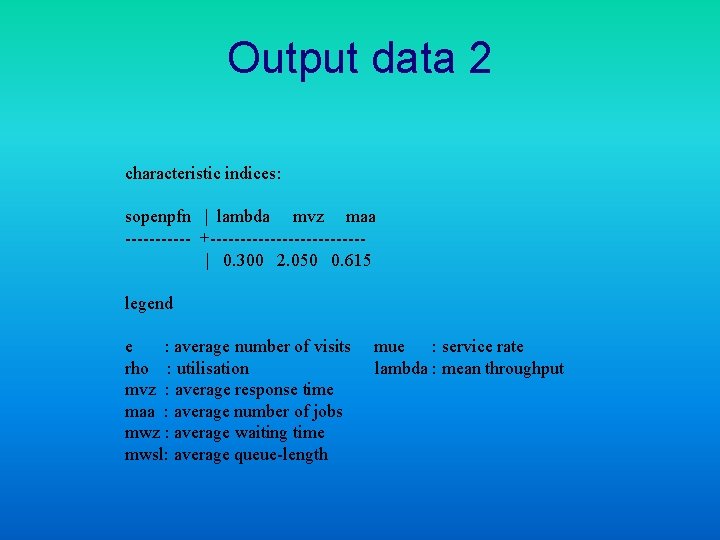
Output data 2 characteristic indices: sopenpfn | lambda mvz maa ------ +-------------| 0. 300 2. 050 0. 615 legend e : average number of visits rho : utilisation mvz : average response time maa : average number of jobs mwz : average waiting time mwsl: average queue-length mue : service rate lambda : mean throughput
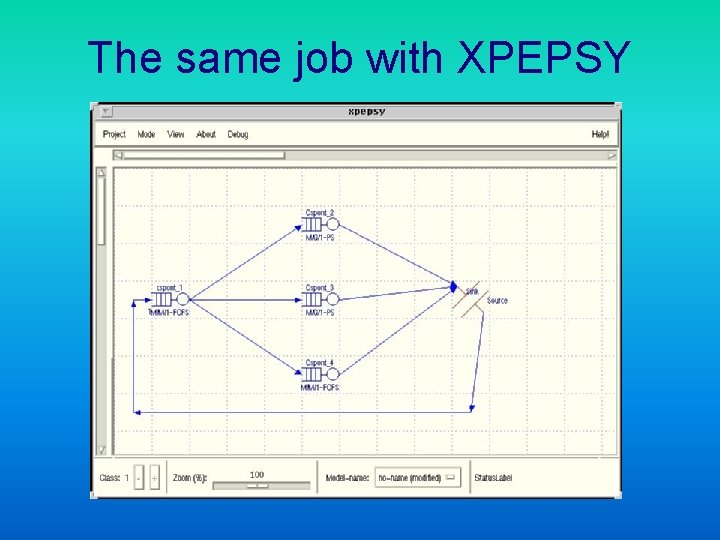
The same job with XPEPSY
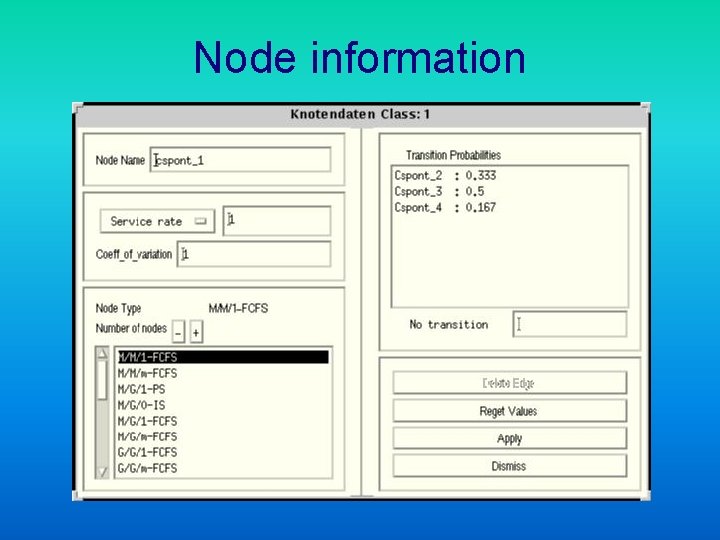
Node information
Procedures of Analysis
The Output screen
Content • Introduction • PEPSY-QNS • Win. PEPSY • Using Win. PEPSY
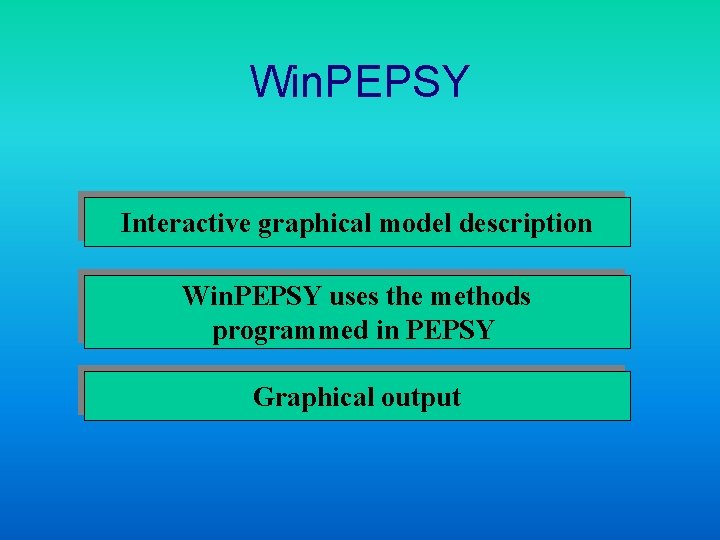
Win. PEPSY Interactive graphical model description Win. PEPSY uses the methods programmed in PEPSY Graphical output
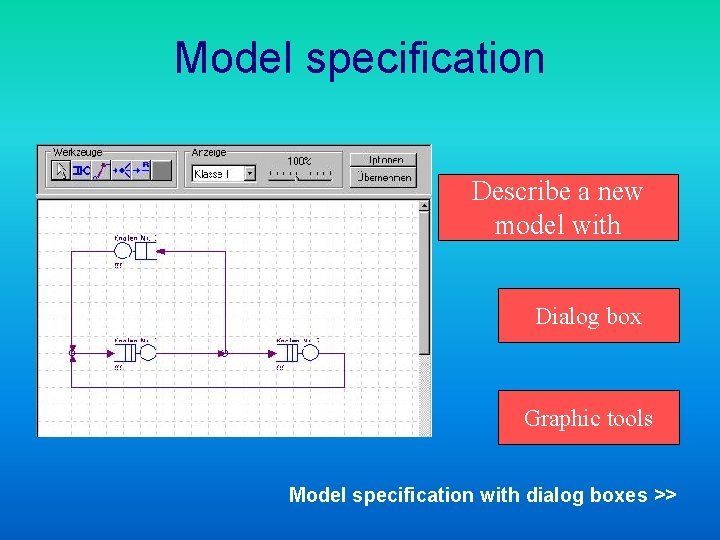
Model specification Describe a new model with Dialog box Graphic tools Model specification with dialog boxes >>
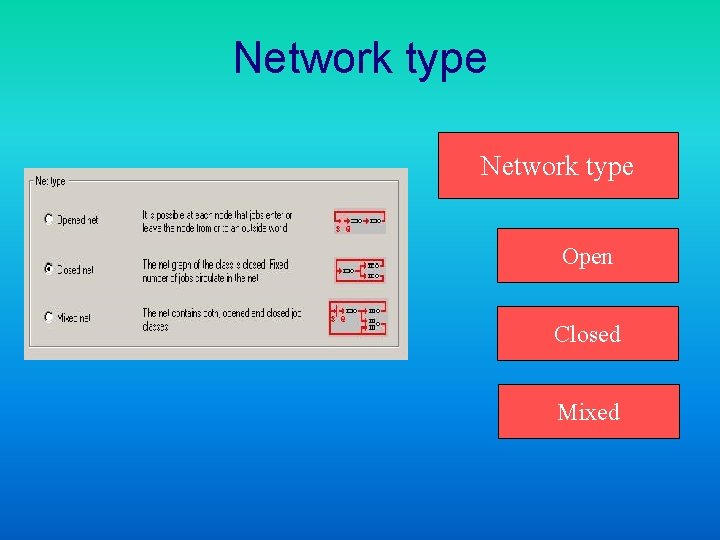
Network type Open Closed Mixed
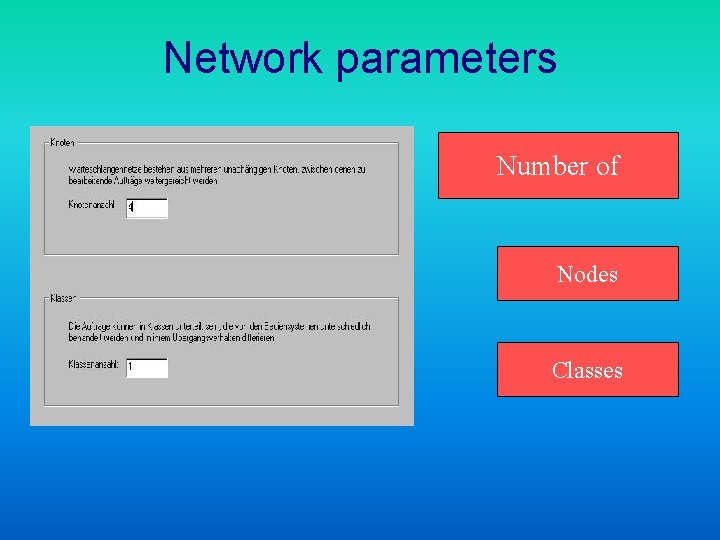
Network parameters Number of Nodes Classes
Type of nodes
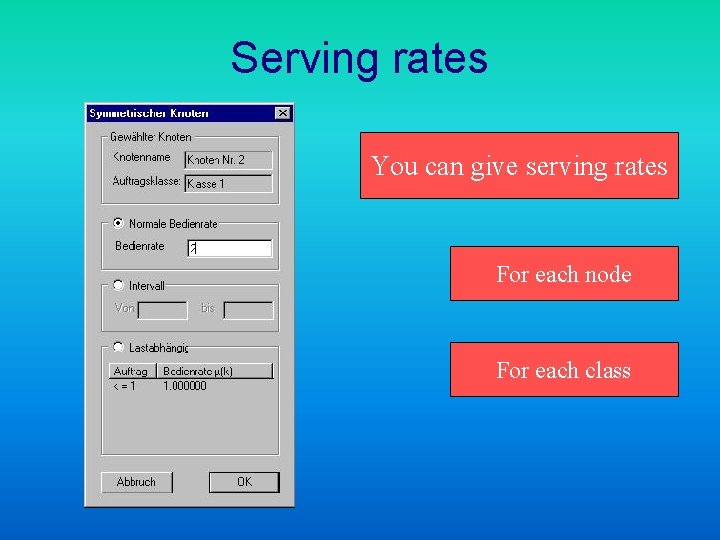
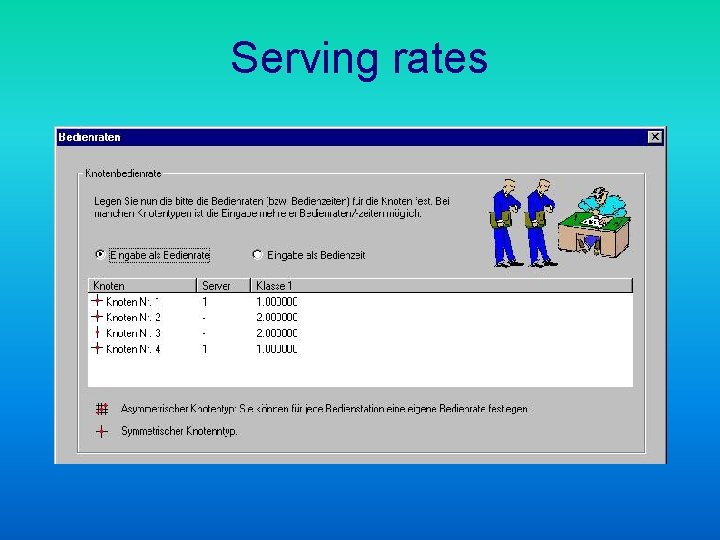
Serving rates You can give serving rates For each node For each class
Serving rates
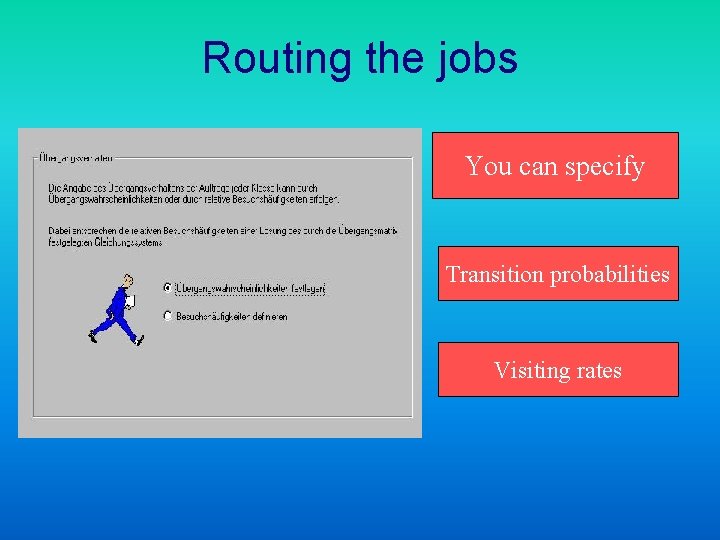
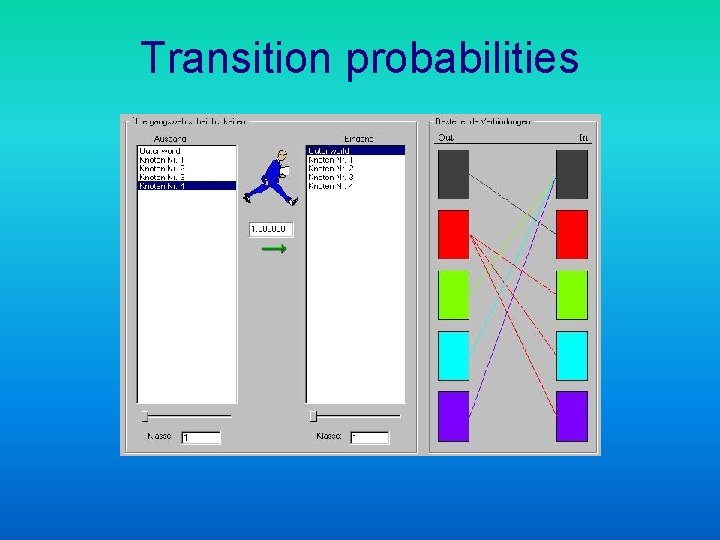
Routing the jobs You can specify Transition probabilities Visiting rates
Transition probabilities
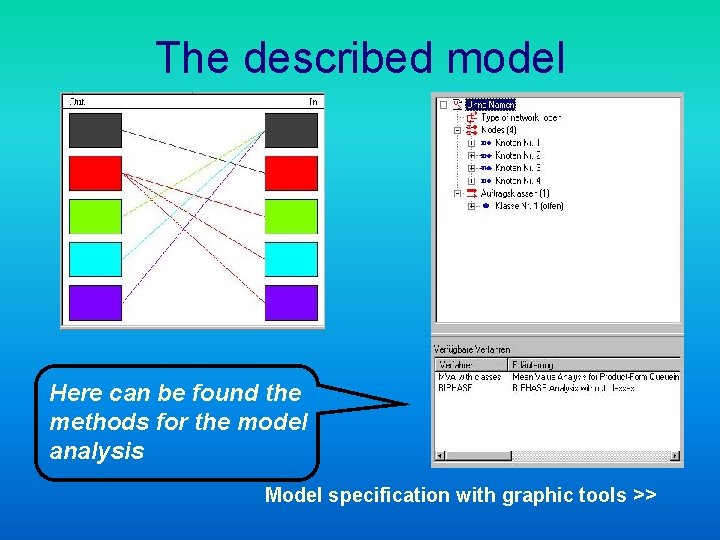
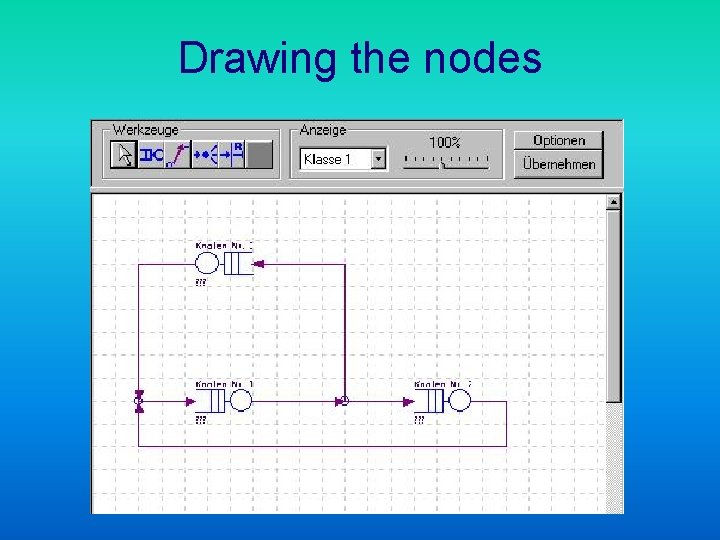
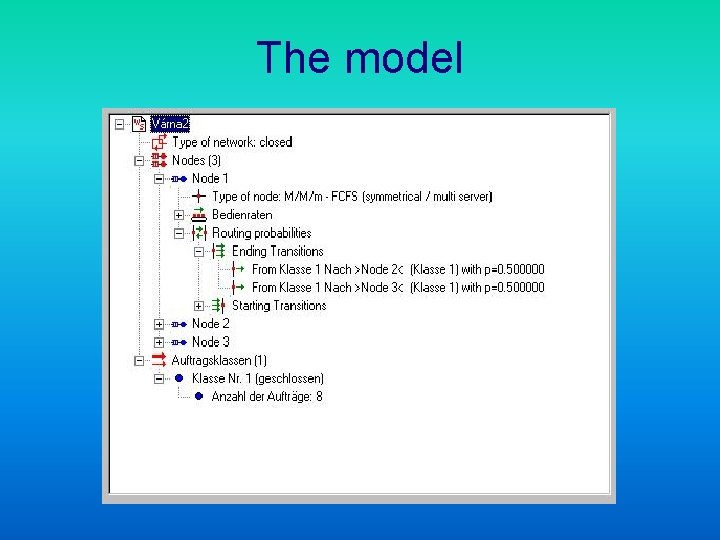
The described model Here can be found the methods for the model analysis Model specification with graphic tools >>
Drawing the nodes
The model
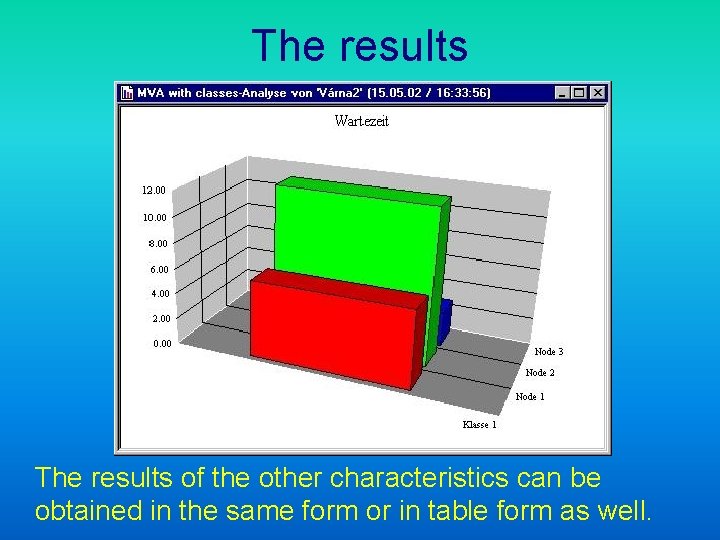
The results of the other characteristics can be obtained in the same form or in table form as well.
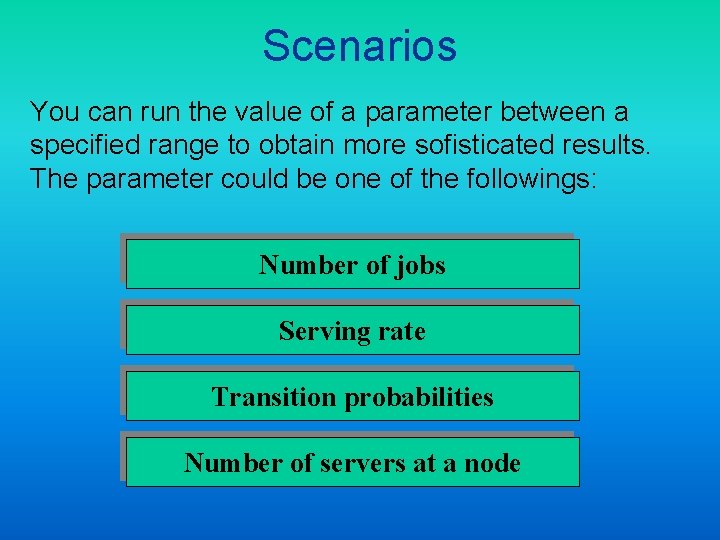
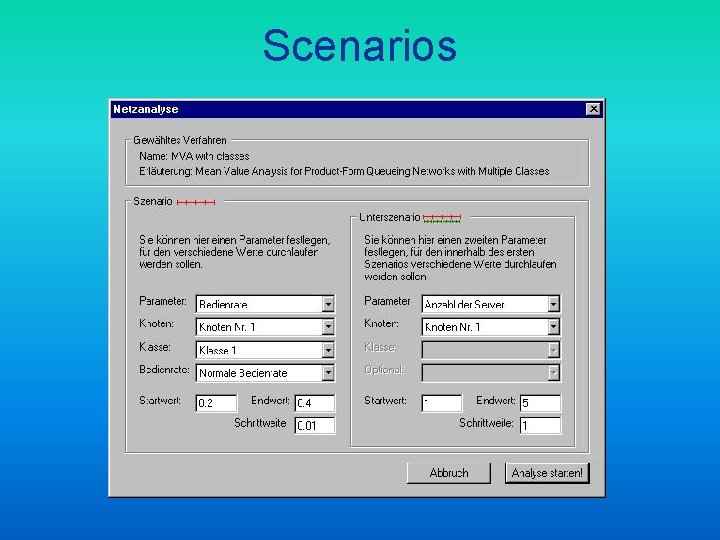
Scenarios You can run the value of a parameter between a specified range to obtain more sofisticated results. The parameter could be one of the followings: Number of jobs Serving rate Transition probabilities Number of servers at a node
Scenarios
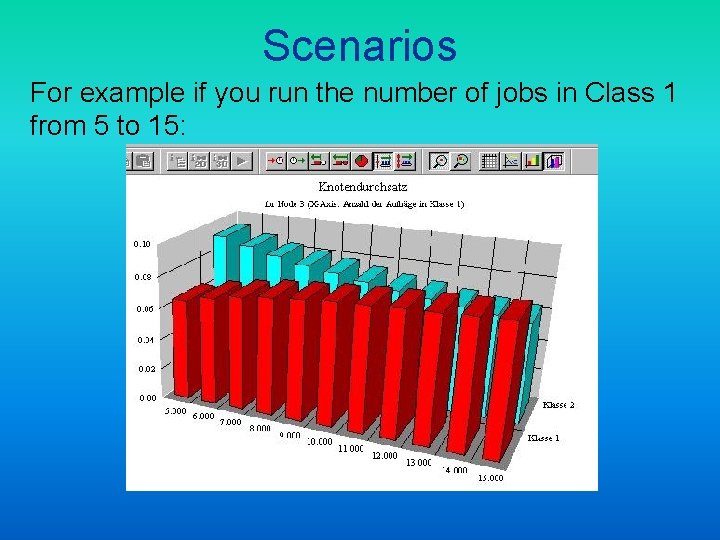
Scenarios For example if you run the number of jobs in Class 1 from 5 to 15:
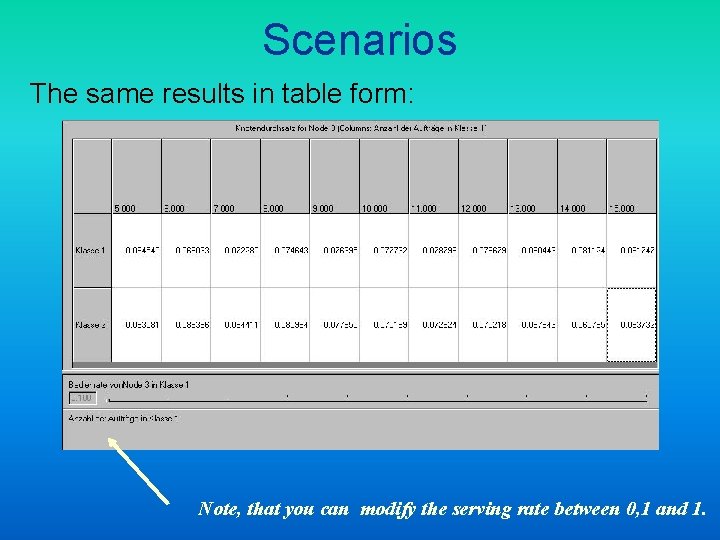
Scenarios The same results in table form: Note, that you can modify the serving rate between 0, 1 and 1.
Content • Introduction • PEPSY-QNS • Win. PEPSY • Using Win. PEPSY
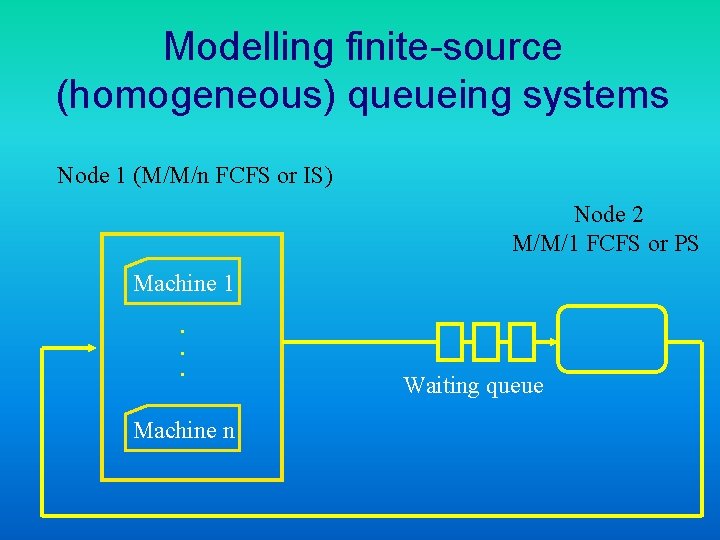
Modelling finite-source (homogeneous) queueing systems Node 1 (M/M/n FCFS or IS) Node 2 M/M/1 FCFS or PS Machine 1. . . Machine n Waiting queue
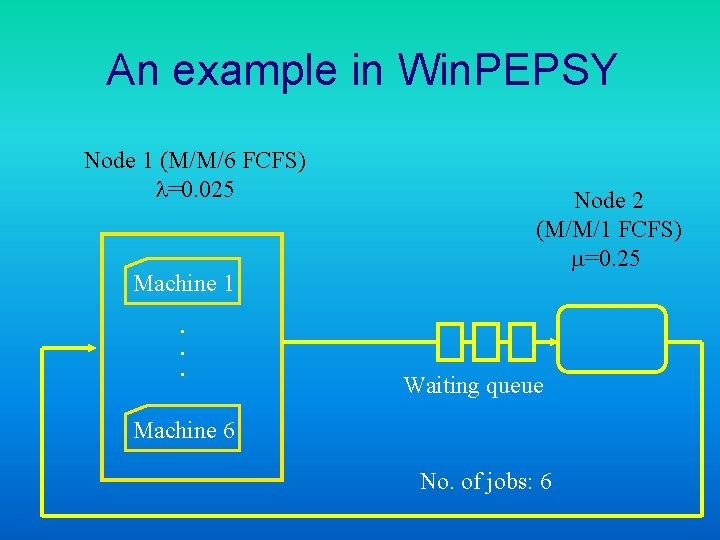
An example in Win. PEPSY Node 1 (M/M/6 FCFS) l=0. 025 Machine 1. . . Node 2 (M/M/1 FCFS) m=0. 25 Waiting queue Machine 6 No. of jobs: 6
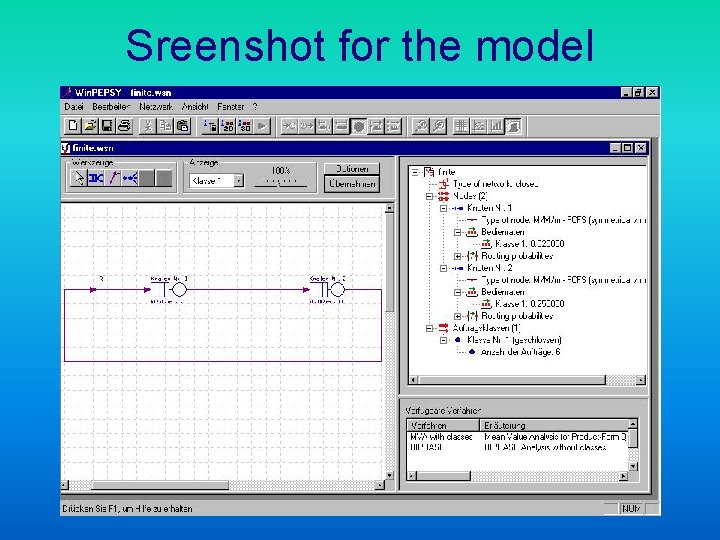
Sreenshot for the model
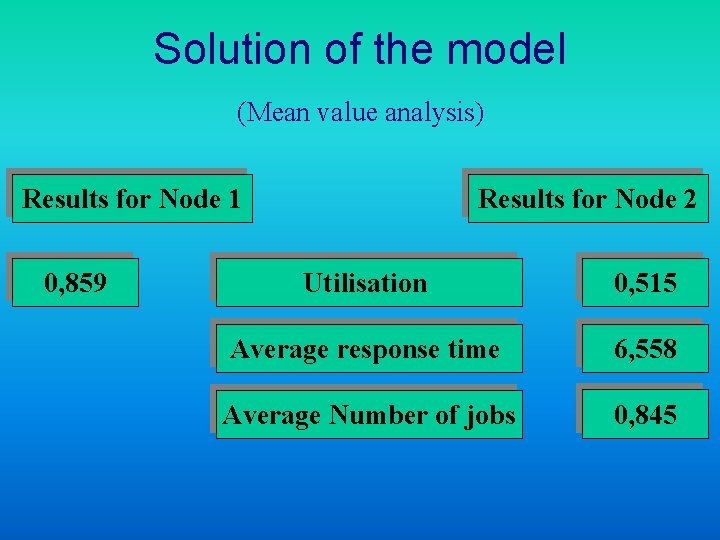
Solution of the model (Mean value analysis) Results for Node 1 0, 859 Results for Node 2 Utilisation 0, 515 Average response time 6, 558 Average Number of jobs 0, 845
Analysis with scenarios Modify the value of serving rate At Node 2 between 0, 1 and 0, 3 At Node 1 between 0, 01 and 0, 03
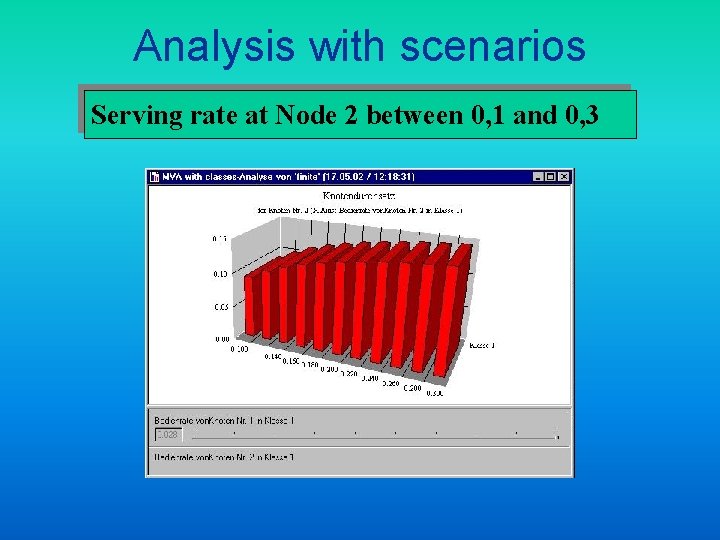
Analysis with scenarios Serving rate at Node 2 between 0, 1 and 0, 3
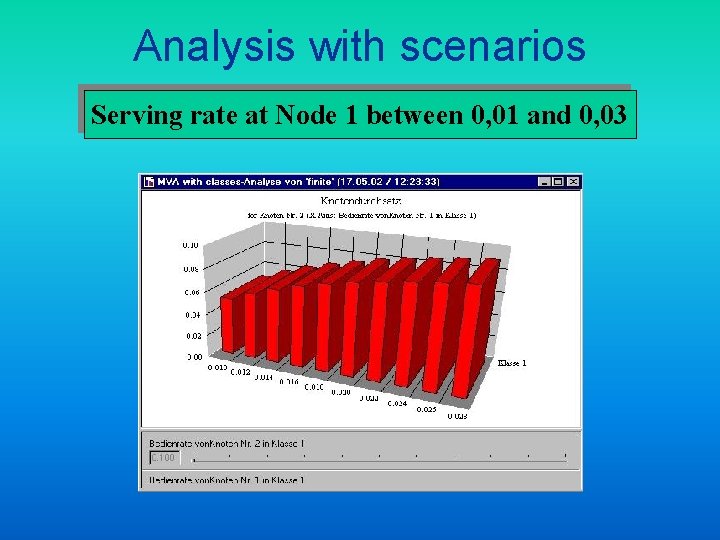
Analysis with scenarios Serving rate at Node 1 between 0, 01 and 0, 03
References [1] Bolch G. , Greiner S. , de Meer H. , Trivedi K. S. Queueing Networks and Markov Chains John Wiley & Sons Inc. New York, 1998. [2] Kleinrock L. Sorbanállás - Kiszolgálás; Bevezetés a tömegkiszolgálási rendszerek elméletébe Műszaki Könyvkiadó Budapest, 1979. [3] Sztrik J. Bevezetés a sorbanállási elméletbe és alkalmazásaiba Egyetemi jegyzet KLTE Debrecen, 1994.
Thank you for your attention