Why fractal mechanics Fracture mechanics for concrete can


")


 traced from X-ray films of concrete with four different dmax of")


 Technique DIC is based on the following principles: the image")

 small size beam 80 · 320 mm")
 Wu et al 2011")
 Wu et al 2011")
 Wu et al 2011")


 Test set-up developed by Petersson (1) Test results")
 Test set-up developed by Hordijk (2) Test results by Hordijk")
 Test set-up developed by Wang et al. (3) Test results by Wang et")
 Test set-up developed by Stang et al. (4) Test results by Stang et")
 proposed a characteristic length Paste: lch= 5 -15")
 suggested: CEB-FIP")

 where k and λ")


- Slides: 58
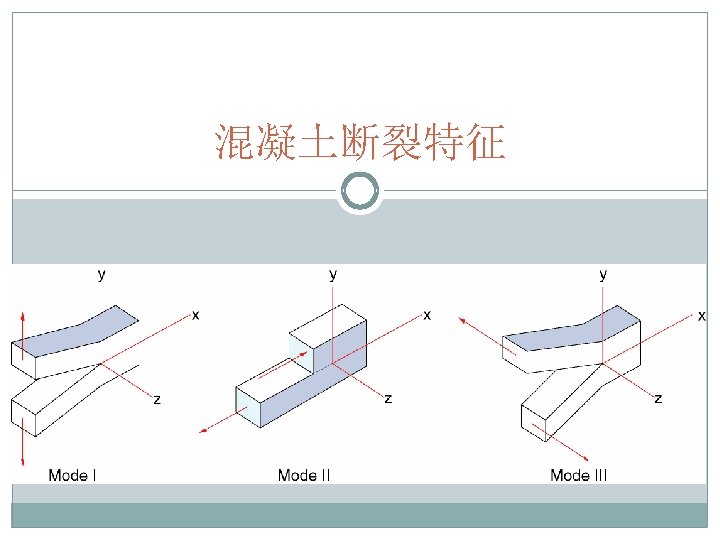
Why fractal mechanics? Fracture mechanics for concrete can be a useful tool for the designer because of the insight it provides on size effects, that is, how the size of a structural element will affect the ultimate load capacity. Fracture mechanics also provides powerful criteria for the prediction of crack propagation.
History review Linear elastic fracture mechanics theory was developed in 1920, but not until 1961 was the first experimental research in concrete performed. Before Fracture mechanics was used successfully in design for metallic and brittle materials early on; 1970 s however comparatively few applications were found for concrete. This trend continued up until the middle ’ 70 s when finally major advances were made. Consistent In the ‘ 80 s and ‘ 90 s intensive research has been. And continual development performed and applications of fracture mechanics in design of beams, anchorage and large dams are becoming more common.
Material properties Rock, Stone Cement, Concrete http: //www. lehigh. edu/~intribos/Resources/ Young’s modulus VS Density
Material properties Cement Concrete http: //www. lehigh. edu/~intribos/Resources/ Young’s modulus VS Strength
Material properties Cement Concrete http: //www. lehigh. edu/~intribos/Resources/ Toughness VS Density
Material properties Cement Concrete http: //www. lehigh. edu/~intribos/Resources/ Toughness VS Strength
Material properties Cement Concrete http: //www. lehigh. edu/~intribos/Resources/ Toughness VS Young’s modulus
INTRODUCTION • Portland cement concrete is a relatively brittle material. As a results, mechanical behaviour of concrete, and fibre reinforced concrete is critically influenced by crack propagation. • Unlike metallic materials, cement-based materials does not exhibit significant plastic deformations. It seems that linear elastic fracture mechanics might be readily applicable. Crack Propagation Mechanical Performance of Structures Fracture Mechanics
However, it is being realized now that because of the heterogeneity inherent in the microstructure of concrete, strain softening, microcracking and larger scale process zone, the fracture parameters such as stress intensity factor (KIc) and fracture energy (Gf) determined in accordance with linear elastic fracture mechanics are size dependent.
• Linear elastic fracture mechanics is only applicable to large -scale initially cracked structures and ultrabrittle concrete in which the effect of the nonlinear process zone can be neglected. • In all other cases, i. e. , for normal-sized concrete structures, the classic linear elastic concepts of fracture mechanics have to be modified in order to predict crack propagation. P P f h Pmax b CMOD L Pfc f, CMOD
Linear elastic fracture mechanics is not enough A typical tensile stress-elongation curve for an ideally brittle material for which linear elastic fracture mechanics is valid A typical tensile stress-elongation curve for quasi-brittle material like concrete with substantial non-linearity existing before the maximum stress
Linear elastic fracture mechanics is not enough Failure area Process zone in brittle-ductile materials. (a) Ductile-brittle (metals) Failure area Process zone in brittle-ductile materials. (b) Quasi-brittle (concrete).
Toughening Mechanism of Concrete Process zone
Fractal Process Zone
Concept model I of FPZ development Initiation of the fracture Around the branches of the main crack there are closed microcracks and in front of them opening microcracks exist Development of the fracture Mihashi, 1987 Just before the failure
Concept model II of FPZ development Wittman, 1992 These concepts are valuable but do not define the fracture process zone completely. !!!
Tests of FPZ
Laser speckle method Mechanisms: Speckle pattern was exposed twice on the same film before and after the deformation. By the double exposure, two sets of speckles, which are slightly apart corresponding to the magnitude of displacement at each point, are recorded on the film. After developing the negative film, a laser beam at a point on the film was applied. Then fringes appear on the screen. The direction of the fringe is perpendicular to the direction of the displacement, and the distance between the fringes is inversely proportional to the magnitude of displacement at the point where the laser beam is applied. Measuring the spacing and the direction of the fringe, the magnitude and direction of the displacement at the point are obtained. Using an image analysis technique and the fast Fourier transform, the spacing and the direction of the fringe are calculated Xu and Reinhardt, 1999
Size L=600 mm Height D=150 mm Thickness B=100 mm Notch length a 0=60 mm Xu and Reinhardt, 1999
Photo elastic coating (PEC)
Size L=3000 mm Height D=3000 mm Thickness B=100 mm Notch length a 0=1200 mm The photographs of photoelastic coating pattern at different stresses Zhang et al. , 2011
Size L=800 mm Height D=800 mm Thickness B=200 mm Notch length a 0=125 mm Wu et al. , 2001
X-ray inspection technique Cesium carboate Otsuka, 1992
Size a=350 mm Thickness b=80 mm Notch length=185 mm Notch thick d=5 mm Otsuka, 2000
Comparison of FPZ(FCZ) traced from X-ray films of concrete with four different dmax of aggregates Size a=350 mm Thickness b=80 mm Notch length=185 mm Notch thick d=5 mm Otsuka, 2000
Effect of size Otsuka, 2000
Otsuka, 2000
29 Skarżyński and Tejchman 2016
Skarżyński and Tejchman, 2016
Skarżyński and Tejchman 2016
X-ray robots inside and outside of a pipe searching for cracks. (Source: Internet site University of Strathclyde (2006))
Acoustic Emission Otsuka, 2000
Sagar et al 2013
M-type specimen, Otsuka and Date, 2000
Otsuka and Date, 2000
Digital Image Correlation (DIC) Technique DIC is based on the following principles: the image of the body is described by a discrete function representing the grey level of each pixel (dark 0 -255 white). The displacement field is assumed to be homogeneous inside a pattern. The initial image representing the body before distortion is a discrete function f (x, y) and is transformed into another discrete function f ∗(x∗, y∗) after distortion or displacement. Shah and Chandra Kishen 2010
Skarzyn´ski et al 2011
FPZ from DIC in sand concrete: (a) small size beam 80 · 320 mm 2, (b) small size long beam 80 · 640 mm 2, (c) medium size beam 160 · 640 mm 2, (d) medium size long beam 320 · 1290 mm 2, (e) large size long beam 320 · 1280 mm 2 (vertical and horizontal axes denote coordinates in [mm], colour scales denotes the strain intensity [-]) Skarzyn´ski et al 2011
Span=300 mm Thickness=40 mm Height=60 mm Notch depth a=18 (mm) Wu et al 2011
Span=160 mm Thickness=40 mm Height=40 mm Notch depth a=12 (mm) Wu et al 2011
Span=160 mm Thickness=40 mm Height=40 mm Notch depth a=12 (mm) Wu et al 2011
Relationship between FPZ length and specimen height Relationship between FPZ length and notch depth/beam height ratio. Wu et al 2011
Stress-strain curves for hardening material behavior Steel polymer Stress-strain curves for softening material behavior Concrete ceramic
Softening curve may be a constitutive relation for a brittle or semi-brittle material Softening curve is a characteristic of fracture damage of concrete Softening curve is important for numerical calculation Softening curve can be determined experimentally Cohesive crack model requires a unique σ(w) curve to quantify the value of energy dissipation. The choice of the σ(w) function influences the prediction of the structural response significantly The local fracture behaviour, for example the crack opening displacement, is particularly sensitive to the shape of σ(w).
Hillerborg 1983
It is clear that concrete softening is characterized by a stress--crack opening width curve (and not stressstrain). The exact characterization of the softening response should ideally be obtained from a uniaxial test of an uncracked specimen. However, it has been found (Li and Liang 1986, Hordijk, Reinhardt and Cornelissen 1989) that not only are those tests extremely sensitive, but drastically different results can be obtained from different geometries, sizes, and testing machines.
Experimental determination of -w relationship (1) Test set-up developed by Petersson (1) Test results by Petersson
(2) Test set-up developed by Hordijk (2) Test results by Hordijk
(3) Test set-up developed by Wang et al. (3) Test results by Wang et al.
(4) Test set-up developed by Stang et al. (4) Test results by Stang et al.
Type of softening curve Hillerborg (1976) proposed a characteristic length Paste: lch= 5 -15 mm Mortar: lch= 100 -200 mm Concrete: lch= 200 -400 mm Hillerborg et al (1976)
ft determined by ordinary tension test, leaving to be determined. Petersson (1981) suggested: CEB-FIP model Code 1990 suggested: Where α=8, 7 and 5 for concrete with dmax=8, 16 and 32 mm Xu and Reinhardt 1999 suggested: Roelfstra & Wittmann 1986 Where αf=9 -dmax/8
w 1 and w 2 are associated with compressive strength: f’c in 23. 9~34. 5 MPa w 1=0. 37 f’c-2. 54, w 2=5 w 1, w 0=w 2+228. 6; f’c in 34. 5~62. 5 MPa w 1=19 -0. 26 f’c, w 2=(18. 2 f’c-1. 25)w 1, w 0=w 2+228. 6 w 1, w 0, w 2 are in micrometer Liaw et al 1990
Footer et al 1986 Reinhardt 1985 Gopalaratnam & Shah (1985) where k and λ are material parameters k = − 0· 06163 and λ = 1· 01 for concrete with f’c values of 33– 47 MPa.
Reinhardt et al 1986, Hordijk 1991 For ordinary concrete, w 0=160 micrometer, C 1=2, C 2=6. 93
Summary Fracture process zone Traditional and new methods to capture this zone Softening curves