Fracture mechanisms Ductile fracture Occurs with plastic deformation


2003 Brooks/Cole, a division of Thomson Learning, Inc. Thomson Learning™ is a trademark used")

,")
2003 Brooks/Cole, a division of Thomson Learning, Inc. Thomson Learning™ is a trademark used")


: E/10 perfect mat’l-no flaws TSengineering")


, Callister 7 e.")


2003 Brooks/Cole, a division of Thomson Learning, Inc. Thomson Learning™ is a trademark used")
2003 Brooks/Cole, a division of Thomson Learning, Inc. Thomson Learning™ is a trademark used")
 70")


")
 cyclic fatigue in metals and (b) static fatigue")

- Slides: 35
Fracture mechanisms • Ductile fracture – Occurs with plastic deformation • Brittle fracture – Occurs with Little or no plastic deformation – Thus they are Catastrophic meaning they occur without warning!
Ductile vs Brittle Failure Fracture behavior: Very Ductile Moderately Ductile Brittle Large Moderate Small • Ductile fracture is nearly always desirable! %Ra or %El Ductile: warning before fracture Brittle: No warning
Example: Failure of a Pipe • Ductile failure: --one piece --large deformation • Brittle failure: --many pieces --small deformation Figures from V. J. Colangelo and F. A. Heiser, Analysis of Metallurgical Failures (2 nd ed. ), Fig. 4. 1(a) and (b), p. 66 John Wiley and Sons, Inc. , 1987. Used with permission.
Moderately Ductile Failure • Evolution to failure: necking • Resulting fracture surfaces void nucleation void growth and linkage fracture 50 50 mm mm (steel) Inclusion particles serve as void nucleation sites. shearing at surface 100 mm From V. J. Colangelo and F. A. Heiser, Analysis of Metallurgical Failures (2 nd ed. ), Fig. 11. 28, p. 294, John Wiley and Sons, Inc. , 1987. (Orig. source: P. Thornton, J. Mater. Sci. , Vol. 6, 1971, pp. 347 -56. ) Fracture surface of tire cord wire loaded in tension. Courtesy of F. Roehrig, CC Technologies, Dublin, OH. Used with permission.
(c)2003 Brooks/Cole, a division of Thomson Learning, Inc. Thomson Learning™ is a trademark used herein under license. Figure 6. 36 When a ductile material is pulled in a tensile test, necking begins and voids form – starting near the center of the bar – by nucleation at grain boundaries or inclusions. As deformation continues a 45° shear lip may form, producing a final cup and cone fracture 6
Ductile vs. Brittle Failure cup-and-cone fracture Adapted from Fig. 8. 3, Callister 7 e. brittle fracture
Brittle Failure Arrows indicate point at which failure originated Adapted from Fig. 8. 5(a), Callister 7 e.
(c)2003 Brooks/Cole, a division of Thomson Learning, Inc. Thomson Learning™ is a trademark used herein under license. Figure 6. 40 The Chevron pattern in a 0. 5 -in. -diameter quenched 4340 steel. The steel failed in a brittle manner by an impact blow 9
Brittle Fracture Surfaces: Useful to examine to determine causes of failure • Intragranular • Intergranular (between grains) 4 mm 304 S. Steel (metal) (within grains) 316 S. Steel (metal) Reprinted w/permission from "Metals Handbook", Reprinted w/ permission 9 th ed, Fig. 633, p. 650. from "Metals Handbook", Copyright 1985, ASM 9 th ed, Fig. 650, p. 357. International, Materials Copyright 1985, ASM Park, OH. (Micrograph by International, Materials J. R. Keiser and A. R. Park, OH. (Micrograph by Olsen, Oak Ridge National D. R. Diercks, Argonne Lab. ) National Lab. ) Polypropylene (polymer) Al Oxide (ceramic) Reprinted w/ permission from R. W. Hertzberg, from "Failure Analysis of "Deformation and Brittle Materials", p. 78. Fracture Mechanics of Copyright 1990, The Engineering Materials", American Ceramic (4 th ed. ) Fig. 7. 35(d), p. Society, Westerville, OH. 303, John Wiley and (Micrograph by R. M. Sons, Inc. , 1996. Gruver and H. Kirchner. ) 1 mm (Orig. source: K. Friedrick, Fracture 1977, Vol. 3, ICF 4, Waterloo, CA, 1977, p. 1119. ) 160 mm 3 mm
Failure Analysis – Failure Avoidance • Most failure occur due to the presence of defects in materials – Cracks or Flaws (stress concentrators) – Voids or inclusions • Presence of defects is best found before hand they should be determined non-destructively – X-Ray analysis – Ultra-Sonic Inspection – Surface inspection • Magna-flux • Dye Penetrant
Ideal vs Real Materials • Stress-strain behavior (Room Temp): E/10 perfect mat’l-no flaws TSengineering << TS perfect carefully produced glass fiber E/100 typical ceramic 0. 1 materials typical strengthened metal typical polymer e • Da. Vinci (500 yrs ago!) observed. . . -- the longer the wire, the smaller the load for failure. • Reasons: -- flaws cause premature failure. -- Larger samples contain more flaws! Reprinted w/ permission from R. W. Hertzberg, "Deformation and Fracture Mechanics of Engineering Materials", (4 th ed. ) Fig. 7. 4. John Wiley and Sons, Inc. , 1996.
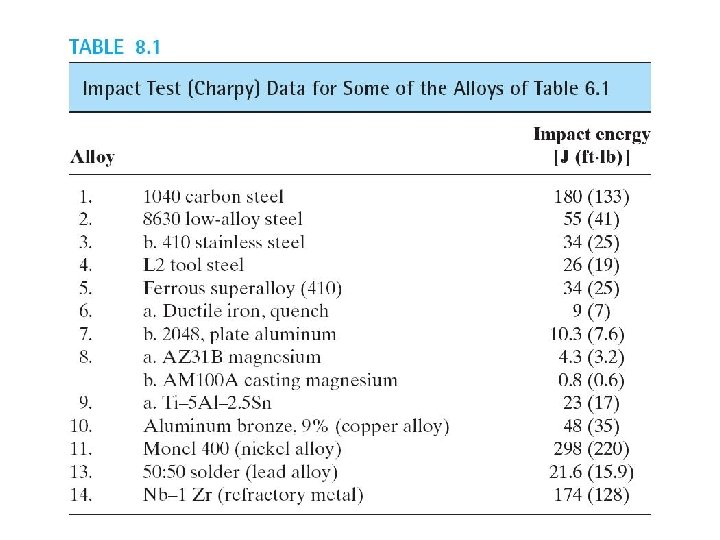
Considering Temperature Effects • Increasing temperature. . . --increases %EL and Kc • Ductile-to-Brittle Transition Temperature (DBTT). . . Impact Energy FCC metals (e. g. , Cu, Ni) BCC metals (e. g. , iron at T < 914°C) polymers Brittle More Ductile High strength materials ( y > E/150) Temperature Ductile-to-brittle transition temperature Adapted from Fig. 8. 15, Callister 7 e.
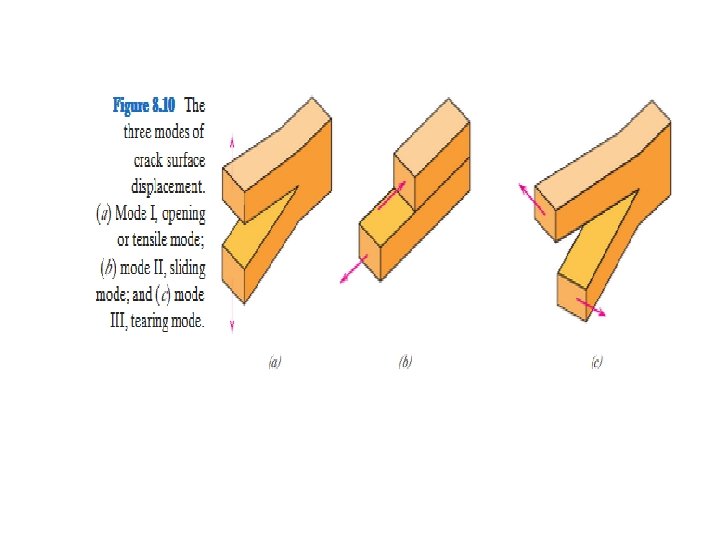
Flaws are Stress Concentrators! Results from crack propagation • Griffith Crack Model: t where t = radius of curvature of crack tip o = applied stress m = stress at crack tip Adapted from Fig. 8. 8(a), Callister 7 e.
Concentration of Stress at Crack Tip Adapted from Fig. 8. 8(b), Callister 7 e.
Engineering Fracture Design • Avoid sharp corners! o max Stress Conc. Factor, K t = sw max r, fillet radius o 2. 5 max is the concentrated stress in the narrowed region h Adapted from G. H. Neugebauer, Prod. Eng. (NY), Vol. 14, pp. 82 -87 1943. ) 2. 0 increasing w/h 1. 5 1. 0 0 0. 5 1. 0 sharper fillet radius r/h
Crack Propagation Cracks propagate due to sharpness of crack tip • A plastic material deforms at the tip, “blunting” the crack. plastic deformed region brittle Energy balance on the crack • Elastic strain energy • energy is stored in material as it is elastically deformed • this energy is released when the crack propagates • creation of new surfaces requires (this) energy
When Does a Crack Propagate? Crack propagates if applied stress is above critical stress i. e. , m > c or Kt > Kc where – – E = modulus of elasticity s = specific surface energy a = one half length of internal crack Kc = c/ 0 For ductile materials replace s by s + p where p is plastic deformation energy
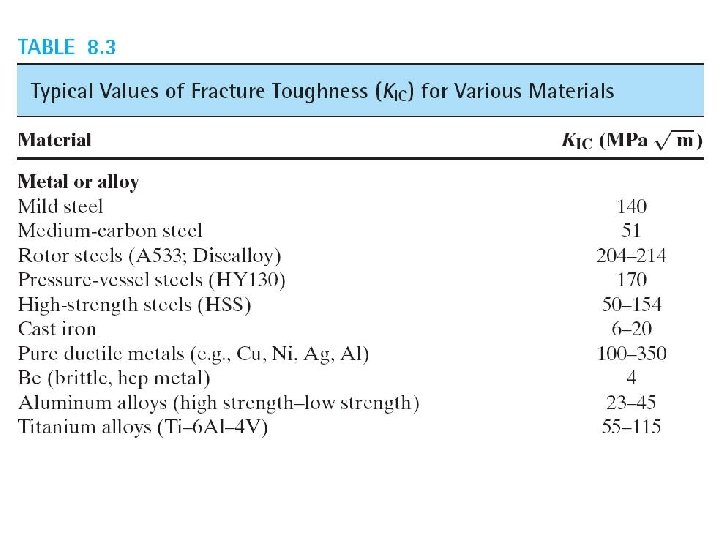
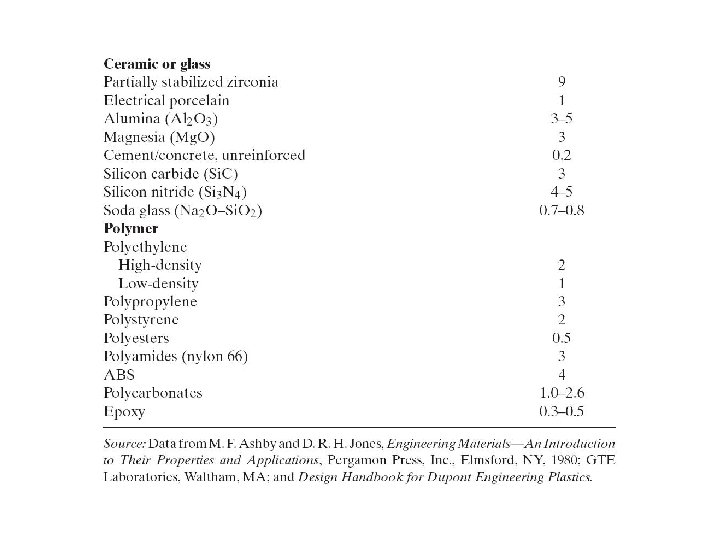
Section 6. 10 Fracture Mechanics o Fracture mechanics - The study of a material’s ability to withstand stress in the presence of a flaw. o Fracture toughness - The resistance of a material to failure in the presence of a flaw. 21
(c)2003 Brooks/Cole, a division of Thomson Learning, Inc. Thomson Learning™ is a trademark used herein under license. Figure 6. 30 Schematic drawing of fracture toughness specimens with (a) edge and (b) internal flaws 22
(c)2003 Brooks/Cole, a division of Thomson Learning, Inc. Thomson Learning™ is a trademark used herein under license. Figure 6. 31 The fracture toughness Kc of a 3000, 000 psi yield strength steel decreases with increasing thickness, eventually leveling off at the plane strain fracture toughness Klc 23
Fracture Toughness Metals/ Alloys 100 K Ic (MPa · m 0. 5 ) 70 60 50 40 30 Graphite/ Ceramics/ Semicond Polymers C-C(|| fibers) 1 Steels Ti alloys Al alloys Mg alloys 20 Al/Al oxide(sf) 2 Y 2 O 3 /Zr. O 2 (p) 4 C/C( fibers) 1 Al oxid/Si. C(w) 3 Si nitr/Si. C(w) 5 Al oxid/Zr. O 2 (p) 4 Glass/Si. C(w) 6 10 7 6 5 4 Diamond Si carbide Al oxide Si nitride 3 0. 7 0. 6 0. 5 PET PP PVC 2 1 Composites/ fibers PC <100> Si crystal <111> Glass -soda Concrete PS Polyester Glass 6 K 1 c – plane strain stress concentration factor – with edge crack; A Material Property we use for design, developed using ASTM Std: ASTM E 399 - 09 Standard Test Method for Linear. Elastic Plane-Strain Fracture Toughness K Ic of Metallic Materials Composite reinforcement geometry is: f = fibers; sf = short fibers; w = whiskers; p = particles. Addition data as noted (vol. fraction of reinforcement): 1. (55 vol%) ASM Handbook, Vol. 21, ASM Int. , Materials Park, OH (2001) p. 606. 2. (55 vol%) Courtesy J. Cornie, MMC, Inc. , Waltham, MA. 3. (30 vol%) P. F. Becher et al. , Fracture Mechanics of Ceramics, Vol. 7, Plenum Press (1986). pp. 61 -73. 4. Courtesy Coors. Tek, Golden, CO. 5. (30 vol%) S. T. Buljan et al. , "Development of Ceramic Matrix Composites for Application in Technology for Advanced Engines Program", ORNL/Sub/85 -22011/2, ORNL, 1992. 6. (20 vol%) F. D. Gace et al. , Ceram. Eng. Sci. Proc. , Vol. 7 (1986) pp. 978 -82.
Fatigue behavior: • Fatigue = failure under cyclic stress specimen compression on top bearing motor counter flex coupling tension on bottom • Stress varies with time. -- key parameters are S (stress amplitude), m, and frequency max m min (Fig. 8. 18 is from Materials Science in Engineering, 4/E by Carl. A. Keyser, Pearson Education, Inc. , Upper Saddle River, NJ. ) S time • Key points when designing in Fatigue inducing situations: -- fatigue can cause part failure, even though max < c. -- fatigue causes ~ 90% of mechanical engineering failures. • Because of its importance, ASTM and ISO have developed many special standards to assess Fatigue Strength of materials
Figure 8. 8 Fatigue corresponds to the brittle fracture of an alloy after a total of N cycles to a stress below the tensile strength.
Fatigue Design Parameters • Fatigue limit, Sfat: --no fatigue failure if S < Sfat Fatigue Limit is defined in: ASTM D 671 S = stress amplitude unsafe case for steel (typ. ) Sfat safe 10 3 Adapted from Fig. 8. 19(a), Callister 7 e. 10 5 10 7 10 9 N = Cycles to failure • However, Sometimes, the S = stress amplitude fatigue limit is zero! unsafe 10 3 10 5 10 7 10 9 N = Cycles to failure case for Al (typ. ) Adapted from Fig. 8. 19(b), Callister 7 e.
For metals other than Ferrous alloys, F. S. is taken as the stress that will cause failure after 108 cycles
Fatigue Mechanism • Cracks in Material grows incrementally typ. 1 to 6 increase in crack length per loading cycle crack origin • Failed rotating shaft --crack grew even though Kmax < Kc --crack grows faster as • D increases • crack gets longer • loading freq. increases. Adapted from D. J. Wulpi, Understanding How Components Fail, American Society for Metals, Materials Park, OH, 1985.
Figure 8. 11 An illustration of how repeated stress applications can generate localized plastic deformation at the alloy surface leading eventually to sharp discontinuities.
Improving Fatigue Life 1. Impose a compressive surface stresses (to suppress surface crack growth) S = stress amplitude Adapted from Fig. 8. 24, Callister 7 e. Increasing m near zero or compressive m moderate tensile m Larger tensile m N = Cycles to failure --Method 1: shot peening --Method 2: carburizing shot put surface into compression 2. Remove stress concentrators. bad C-rich gas better Adapted from Fig. 8. 25, Callister 7 e.
Figure 8. 20 Comparison of (a) cyclic fatigue in metals and (b) static fatigue in ceramics.
SUMMARY • Engineering materials don't reach theoretical strength. • Flaws produce stress concentrations that cause premature failure. • Sharp corners produce large stress concentrations and premature failure. • Failure type depends on T and stress: - for noncyclic and T < 0. 4 Tm, failure stress decreases with: - increased maximum flaw size, - decreased T, - increased rate of loading. - for cyclic : - cycles to fail decreases as D increases. - for higher T (T > 0. 4 Tm): - time to fail decreases as or T increases.