Wellcome Trust Advanced Courses Genomic Epidemiology in Africa

- Slides: 41
Wellcome Trust Advanced Courses; Genomic Epidemiology in Africa, 21 st – 26 th June 2015 Africa Centre for Health and Population Studies, University of Kwa. Zulu-Natal, Durban, South Africa Preparing data for GWAS analysis Tommy Carstensen
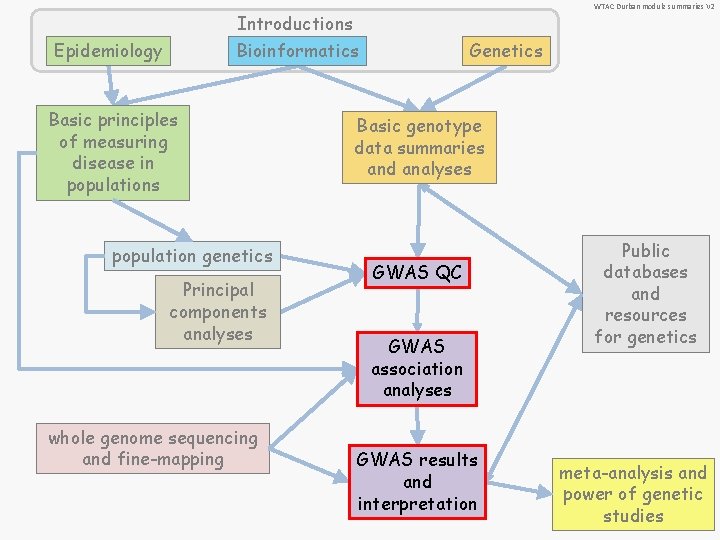
WTAC Durban module summaries V 2 Introductions Epidemiology Bioinformatics Basic principles of measuring disease in populations population genetics Principal components analyses whole genome sequencing and fine-mapping Genetics Basic genotype data summaries and analyses GWAS QC GWAS association analyses GWAS results and interpretation Public databases and resources for genetics meta-analysis and power of genetic studies
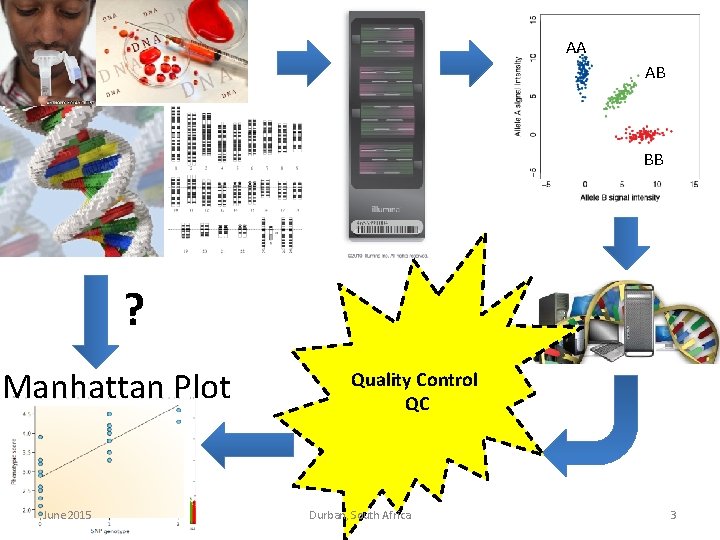
AA AB BB ? Manhattan Plot GWAS June 2015 Quality Control QC Durban, South Africa 3
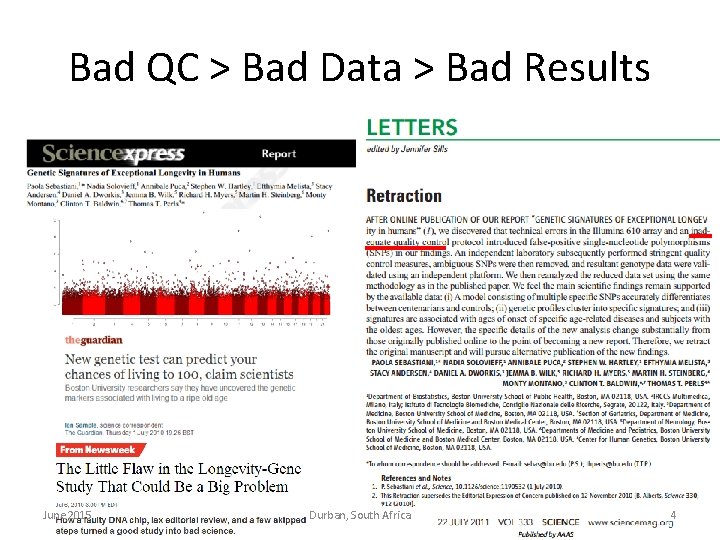
Bad QC > Bad Data > Bad Results June 2015 Durban, South Africa 4
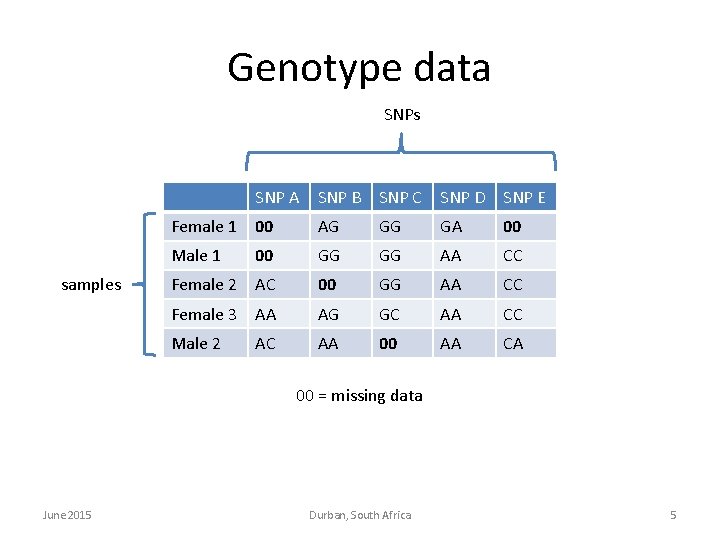
Genotype data SNPs samples SNP A SNP B SNP C SNP D SNP E Female 1 00 AG GG GA 00 Male 1 00 GG GG AA CC Female 2 AC 00 GG AA CC Female 3 AA AG GC AA CC Male 2 AC AA 00 AA CA 00 = missing data June 2015 Durban, South Africa 5
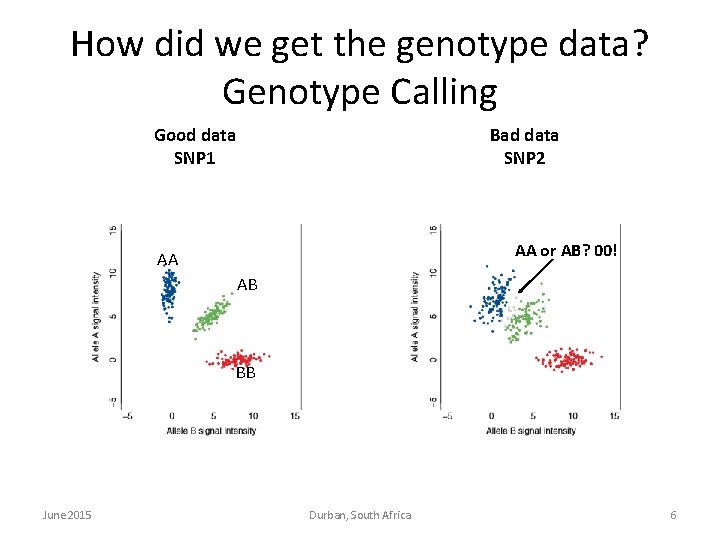
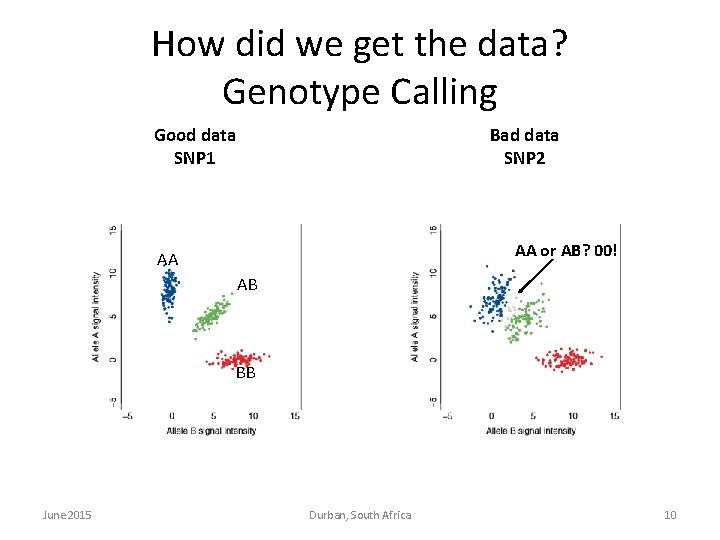
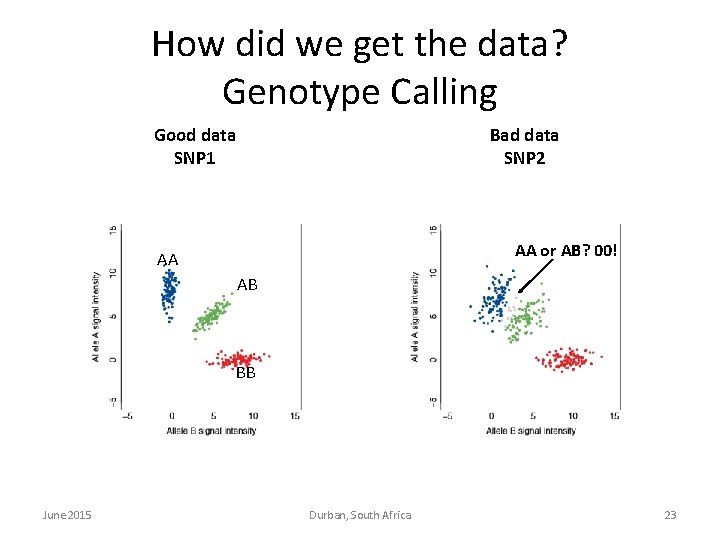
How did we get the genotype data? Genotype Calling Good data SNP 1 Bad data SNP 2 AA or AB? 00! AA AB BB June 2015 Durban, South Africa 6
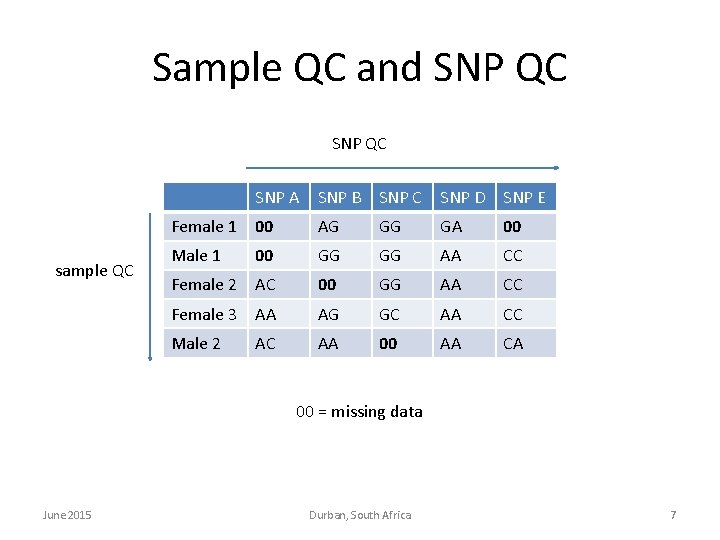
Sample QC and SNP QC sample QC SNP A SNP B SNP C SNP D SNP E Female 1 00 AG GG GA 00 Male 1 00 GG GG AA CC Female 2 AC 00 GG AA CC Female 3 AA AG GC AA CC Male 2 AC AA 00 AA CA 00 = missing data June 2015 Durban, South Africa 7
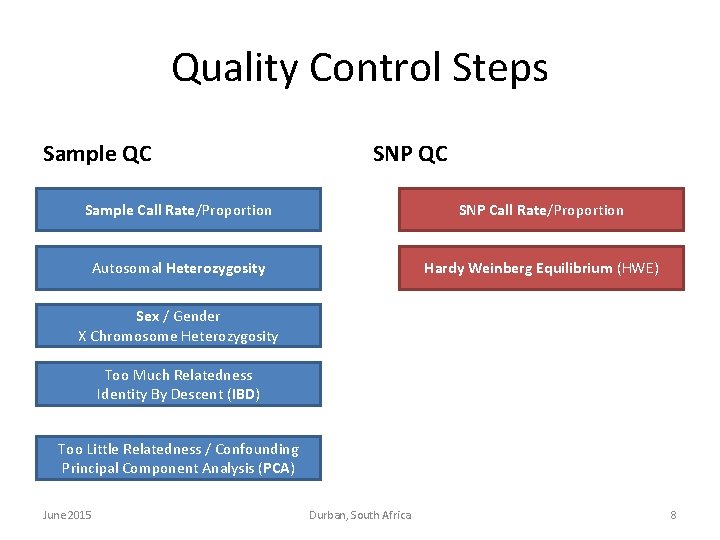
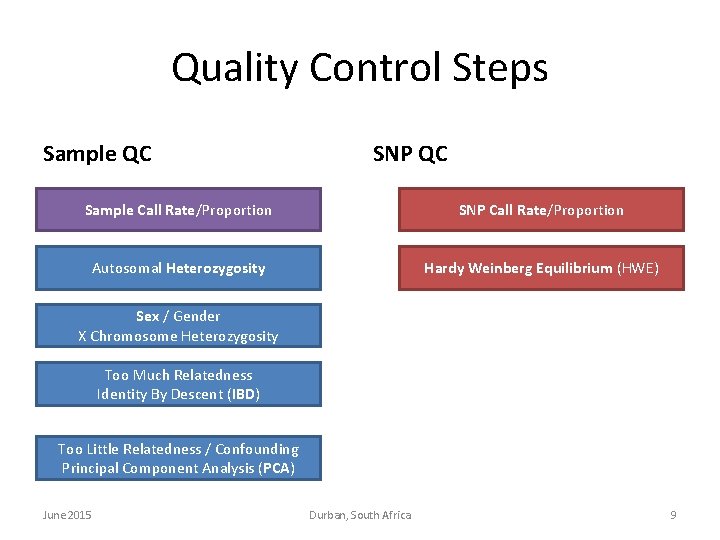
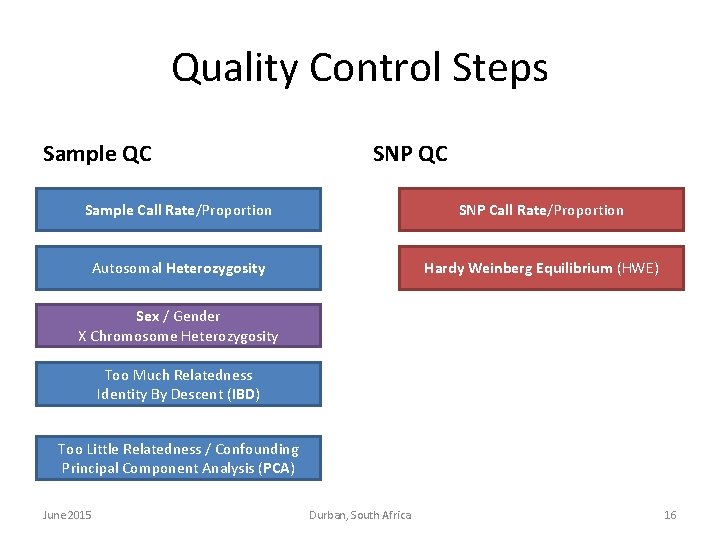
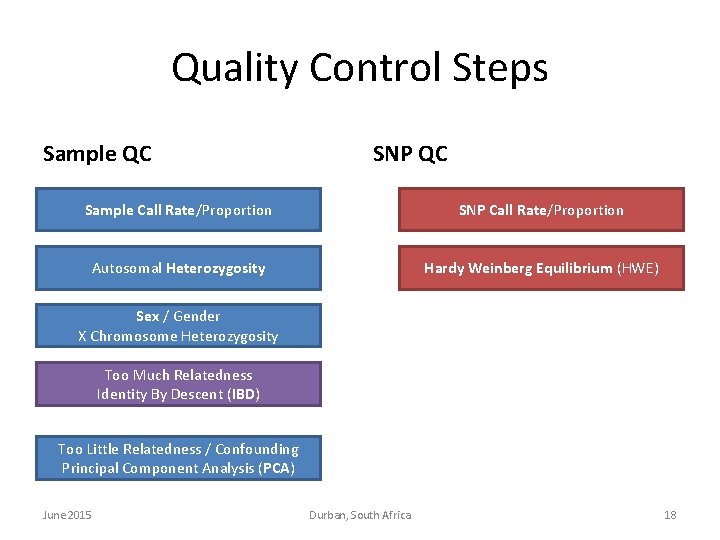
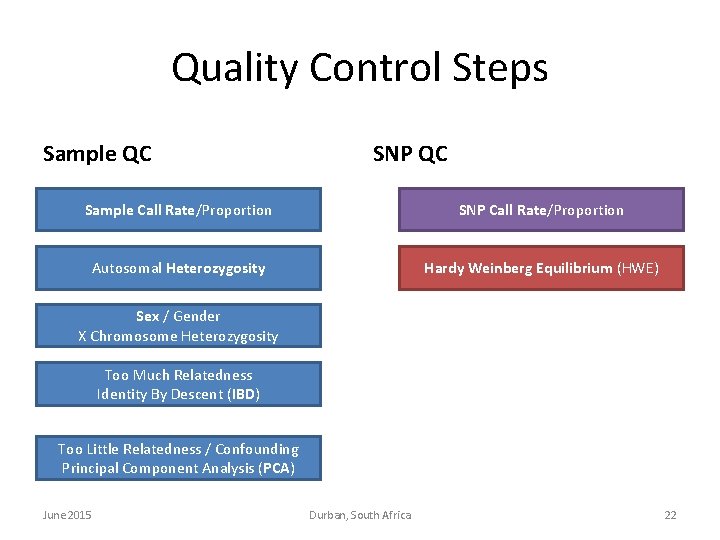
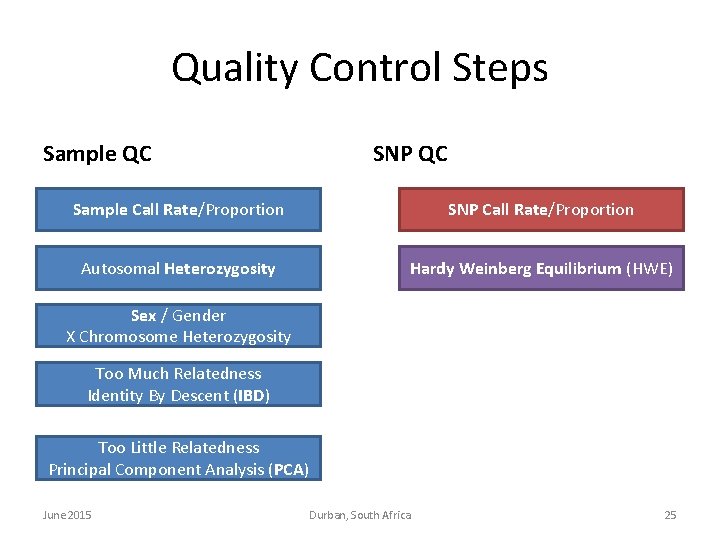
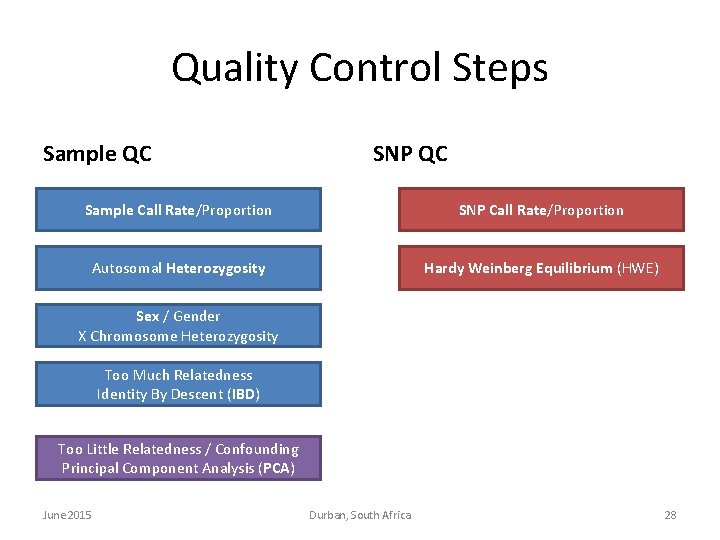
Quality Control Steps Sample QC SNP QC Sample Call Rate/Proportion SNP Call Rate/Proportion Autosomal Heterozygosity Hardy Weinberg Equilibrium (HWE) Sex / Gender X Chromosome Heterozygosity Too Much Relatedness Identity By Descent (IBD) Too Little Relatedness / Confounding Principal Component Analysis (PCA) June 2015 Durban, South Africa 8
Quality Control Steps Sample QC SNP QC Sample Call Rate/Proportion SNP Call Rate/Proportion Autosomal Heterozygosity Hardy Weinberg Equilibrium (HWE) Sex / Gender X Chromosome Heterozygosity Too Much Relatedness Identity By Descent (IBD) Too Little Relatedness / Confounding Principal Component Analysis (PCA) June 2015 Durban, South Africa 9
How did we get the data? Genotype Calling Good data SNP 1 Bad data SNP 2 AA or AB? 00! AA AB BB June 2015 Durban, South Africa 10
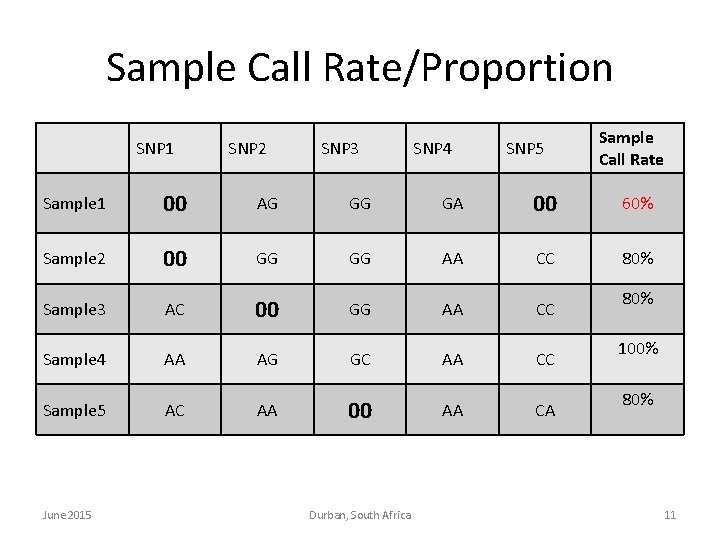
Sample Call Rate/Proportion SNP 1 SNP 2 SNP 3 SNP 4 SNP 5 Sample Call Rate Sample 1 00 00 AG GG GA 00 00 60% Sample 2 00 00 GG GG AA CC 80% Sample 3 AC 00 00 GG AA CC Sample 4 AA AG GC AA CC Sample 5 AC AA 00 00 AA CA June 2015 Durban, South Africa 80% 100% 80% 11
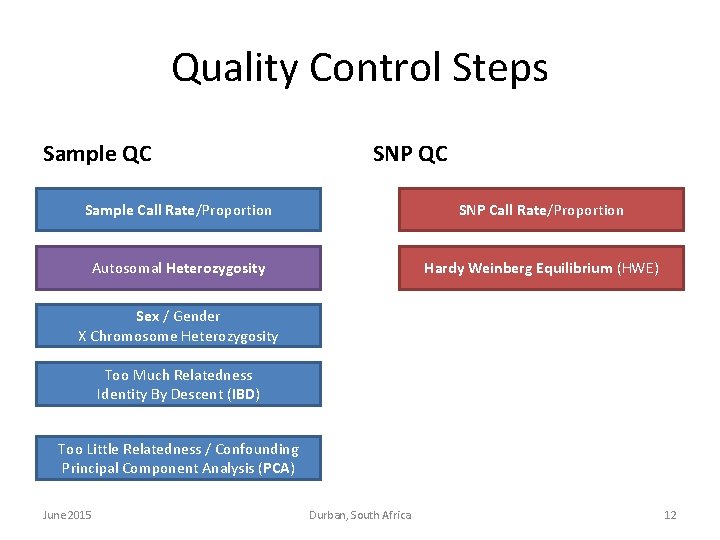
Quality Control Steps Sample QC SNP QC Sample Call Rate/Proportion SNP Call Rate/Proportion Autosomal Heterozygosity Hardy Weinberg Equilibrium (HWE) Sex / Gender X Chromosome Heterozygosity Too Much Relatedness Identity By Descent (IBD) Too Little Relatedness / Confounding Principal Component Analysis (PCA) June 2015 Durban, South Africa 12
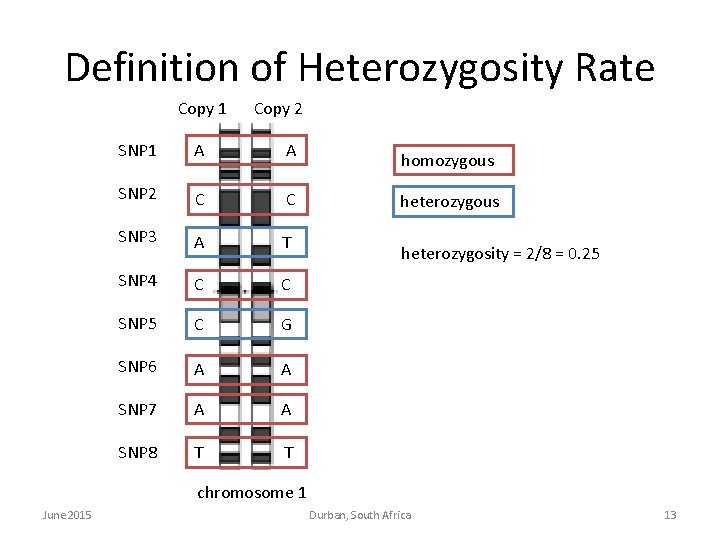
Definition of Heterozygosity Rate Copy 1 Copy 2 SNP 1 A A SNP 2 C C SNP 3 A T SNP 4 C C SNP 5 C G SNP 6 A A SNP 7 A A SNP 8 T T homozygous heterozygosity = 2/8 = 0. 25 chromosome 1 June 2015 Durban, South Africa 13
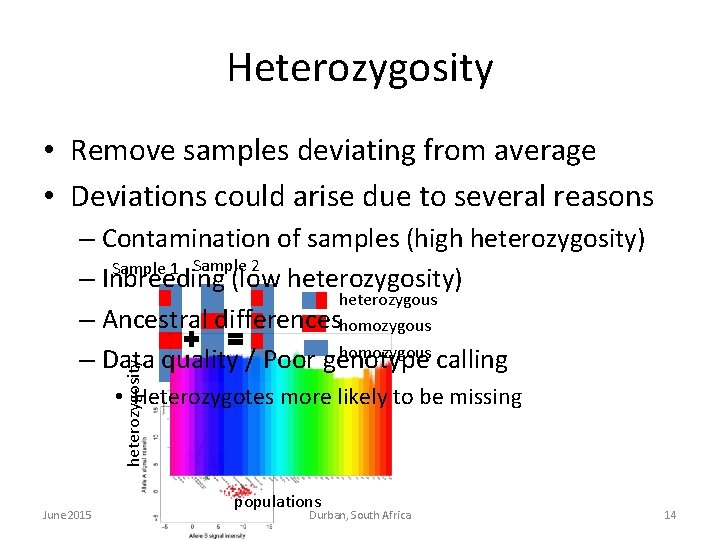
Heterozygosity • Remove samples deviating from average • Deviations could arise due to several reasons heterozygosity – Contamination of samples (high heterozygosity) Sample 1 Sample 2 – Inbreeding (low heterozygosity) heterozygous – Ancestral differenceshomozygous – Data quality / Poor genotype calling • Heterozygotes more likely to be missing June 2015 populations Durban, South Africa 14
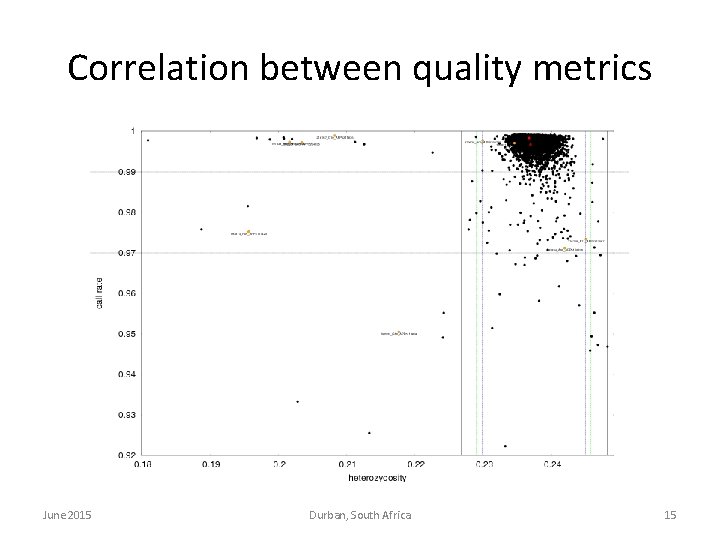
Correlation between quality metrics June 2015 Durban, South Africa 15
Quality Control Steps Sample QC SNP QC Sample Call Rate/Proportion SNP Call Rate/Proportion Autosomal Heterozygosity Hardy Weinberg Equilibrium (HWE) Sex / Gender X Chromosome Heterozygosity Too Much Relatedness Identity By Descent (IBD) Too Little Relatedness / Confounding Principal Component Analysis (PCA) June 2015 Durban, South Africa 16
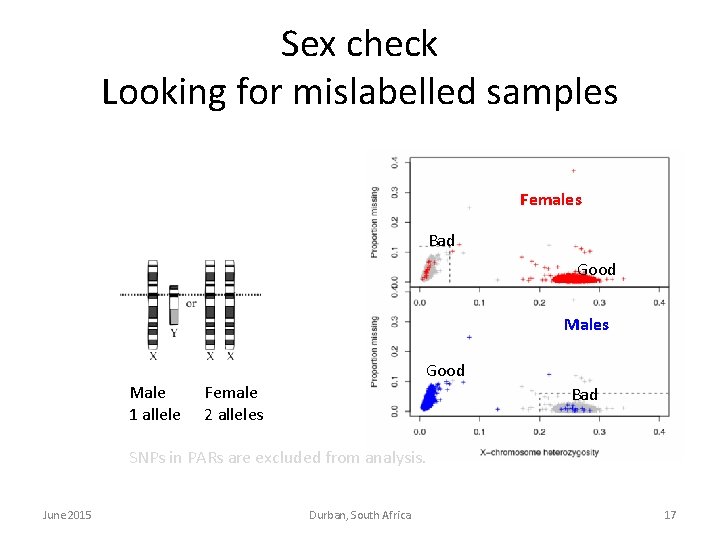
Sex check Looking for mislabelled samples Females Bad Good Males Good Male 1 allele Female 2 alleles Bad SNPs in PARs are excluded from analysis. June 2015 Durban, South Africa 17
Quality Control Steps Sample QC SNP QC Sample Call Rate/Proportion SNP Call Rate/Proportion Autosomal Heterozygosity Hardy Weinberg Equilibrium (HWE) Sex / Gender X Chromosome Heterozygosity Too Much Relatedness Identity By Descent (IBD) Too Little Relatedness / Confounding Principal Component Analysis (PCA) June 2015 Durban, South Africa 18
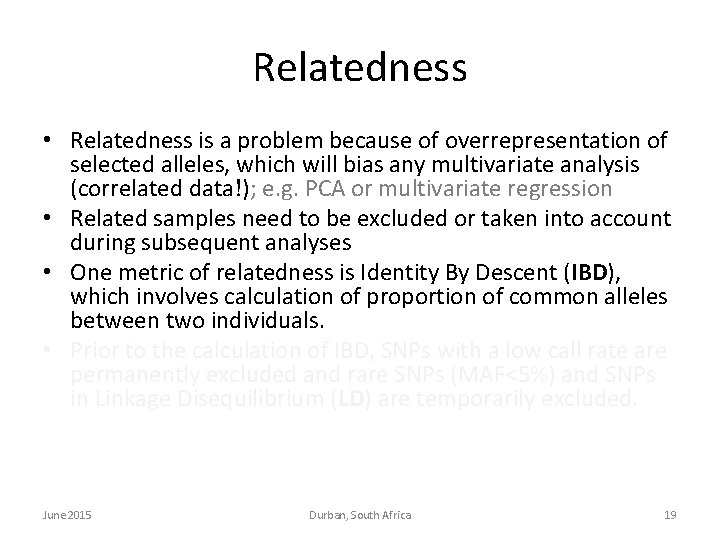
Relatedness • Relatedness is a problem because of overrepresentation of selected alleles, which will bias any multivariate analysis (correlated data!); e. g. PCA or multivariate regression • Related samples need to be excluded or taken into account during subsequent analyses • One metric of relatedness is Identity By Descent (IBD), which involves calculation of proportion of common alleles between two individuals. • Prior to the calculation of IBD, SNPs with a low call rate are permanently excluded and rare SNPs (MAF<5%) and SNPs in Linkage Disequilibrium (LD) are temporarily excluded. June 2015 Durban, South Africa 19
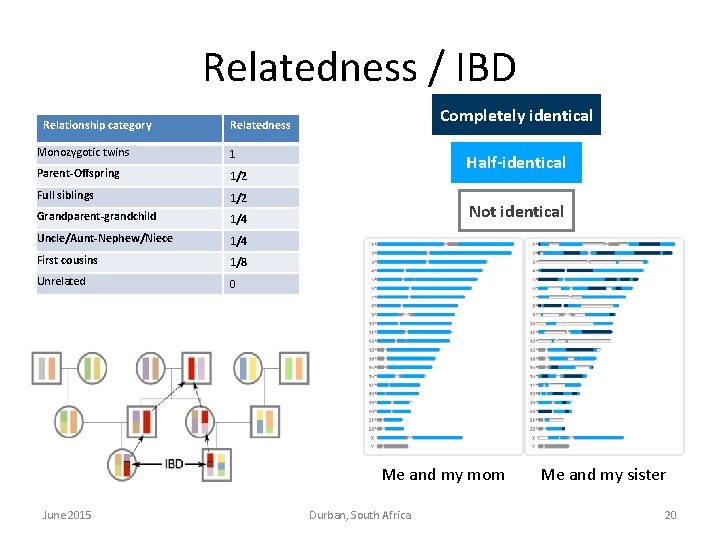
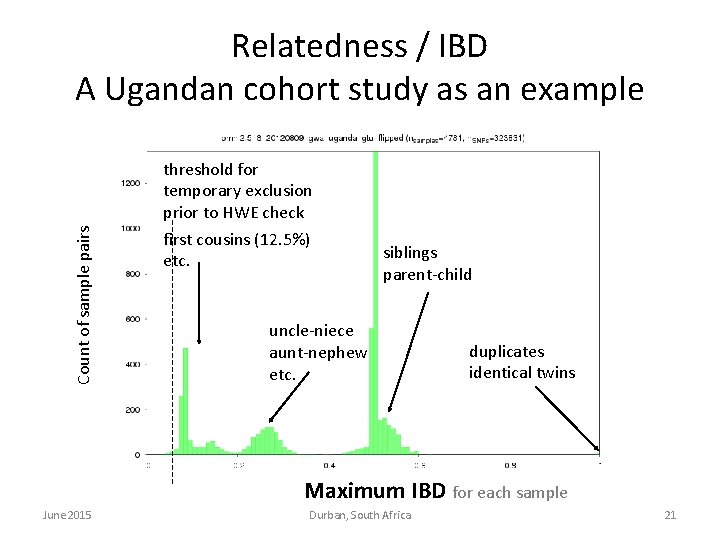
Relatedness / IBD Relationship category Completely identical Relatedness Monozygotic twins 1 Parent-Offspring 1/2 Full siblings 1/2 Grandparent-grandchild 1/4 Uncle/Aunt-Nephew/Niece 1/4 First cousins 1/8 Unrelated 0 Half-identical Not identical Me and my mom June 2015 Durban, South Africa Me and my sister 20
Count of sample pairs Relatedness / IBD A Ugandan cohort study as an example threshold for temporary exclusion prior to HWE check first cousins (12. 5%) etc. siblings parent-child uncle-niece aunt-nephew etc. duplicates identical twins Maximum IBD for each sample June 2015 Durban, South Africa 21
Quality Control Steps Sample QC SNP QC Sample Call Rate/Proportion SNP Call Rate/Proportion Autosomal Heterozygosity Hardy Weinberg Equilibrium (HWE) Sex / Gender X Chromosome Heterozygosity Too Much Relatedness Identity By Descent (IBD) Too Little Relatedness / Confounding Principal Component Analysis (PCA) June 2015 Durban, South Africa 22
How did we get the data? Genotype Calling Good data SNP 1 Bad data SNP 2 AA or AB? 00! AA AB BB June 2015 Durban, South Africa 23
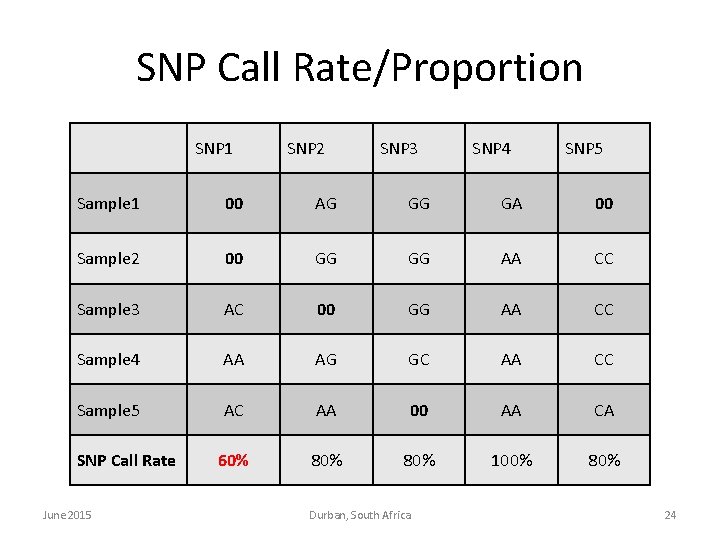
SNP Call Rate/Proportion SNP 1 SNP 2 SNP 3 SNP 4 SNP 5 Sample 1 00 AG GG GA 00 Sample 2 00 GG GG AA CC Sample 3 AC 00 GG AA CC Sample 4 AA AG GC AA CC Sample 5 AC AA 00 AA CA 60% 80% 100% 80% SNP Call Rate June 2015 Durban, South Africa 24
Quality Control Steps Sample QC SNP QC Sample Call Rate/Proportion SNP Call Rate/Proportion Autosomal Heterozygosity Hardy Weinberg Equilibrium (HWE) Sex / Gender X Chromosome Heterozygosity Too Much Relatedness Identity By Descent (IBD) Too Little Relatedness Principal Component Analysis (PCA) June 2015 Durban, South Africa 25
Hardy Weinberg Equilibrium random mating Females Males A (p) C (q) A (p) AA (p 2) AC (pq) C (q) AC (pq) CC (q 2) SNP 1 SNP 2 SNP 3 Sample 1 AC AA AC Sample 2 AA AA AC Sample 3 AC CC AC Sample 4 CC CC AC f (A)=p 4/8 4/8 f(C)=q=1 -p 4/8 4/8 fe(AA)=p 2 1/4 1/4 fe(AC)=2 pq 2/4 2/4 fe(CC)=q 2 1/4 1/4 fo(AA) 1/4 2/4 0/4 fo(AC) 2/4 0/4 4/4 fo(CC) 1/4 2/4 0/4 allele frequencies expected genotype frequencies observed genotype frequencies χ2 test June 2015 Durban, South Africa 26
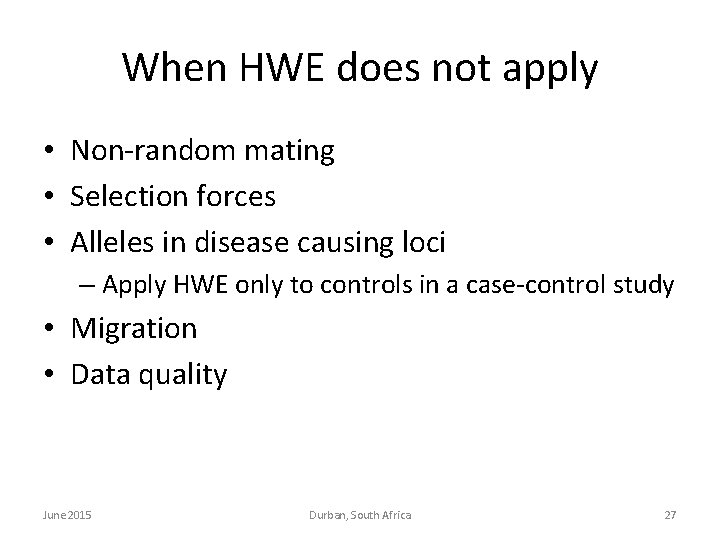
When HWE does not apply • Non-random mating • Selection forces • Alleles in disease causing loci – Apply HWE only to controls in a case-control study • Migration • Data quality June 2015 Durban, South Africa 27
Quality Control Steps Sample QC SNP QC Sample Call Rate/Proportion SNP Call Rate/Proportion Autosomal Heterozygosity Hardy Weinberg Equilibrium (HWE) Sex / Gender X Chromosome Heterozygosity Too Much Relatedness Identity By Descent (IBD) Too Little Relatedness / Confounding Principal Component Analysis (PCA) June 2015 Durban, South Africa 28
Principal Component Analysis • A statistical technique for summarizing many variables with minimal loss of information • PCA requires clean non-correlated data June 2015 Durban, South Africa 29
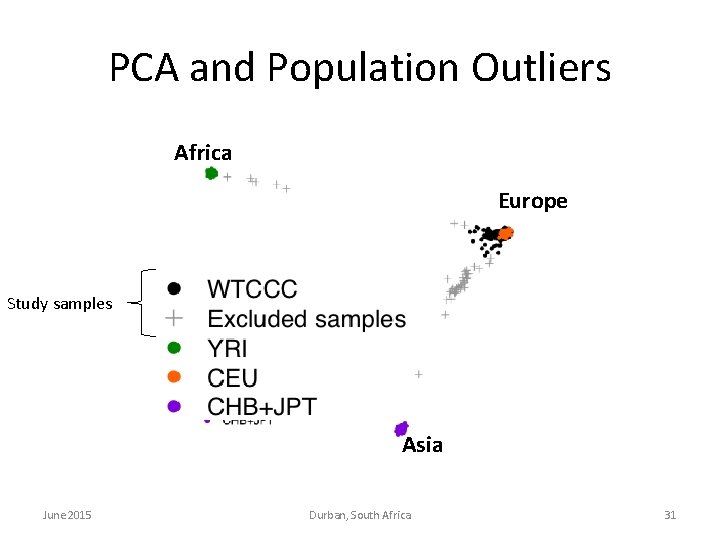
Principal Component Analysis • A statistical technique for summarizing many variables with minimal loss of information • PCA can reveal – Population outliers June 2015 Durban, South Africa 30
PCA and Population Outliers Africa Europe Study samples Asia June 2015 Durban, South Africa 31
Principal Component Analysis • A statistical technique for summarizing many variables with minimal loss of information • PCA can reveal – Population outliers – Population structure / Confounding June 2015 Durban, South Africa 32
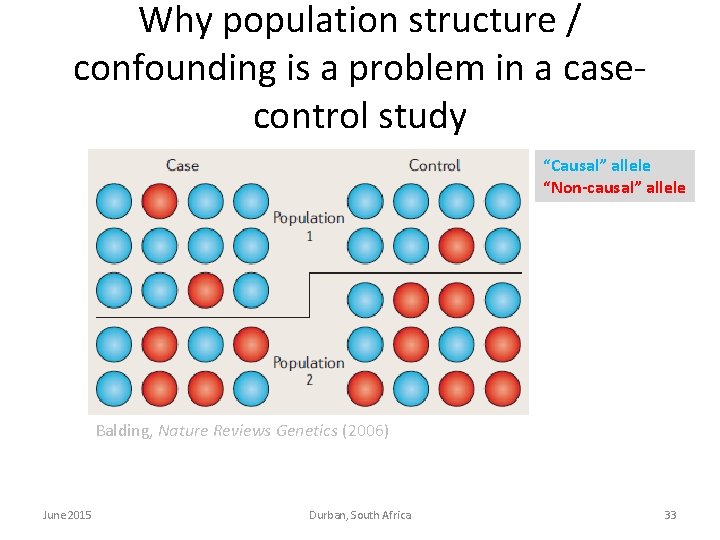
Why population structure / confounding is a problem in a casecontrol study “Causal” allele “Non-causal” allele Balding, Nature Reviews Genetics (2006) June 2015 Durban, South Africa 33
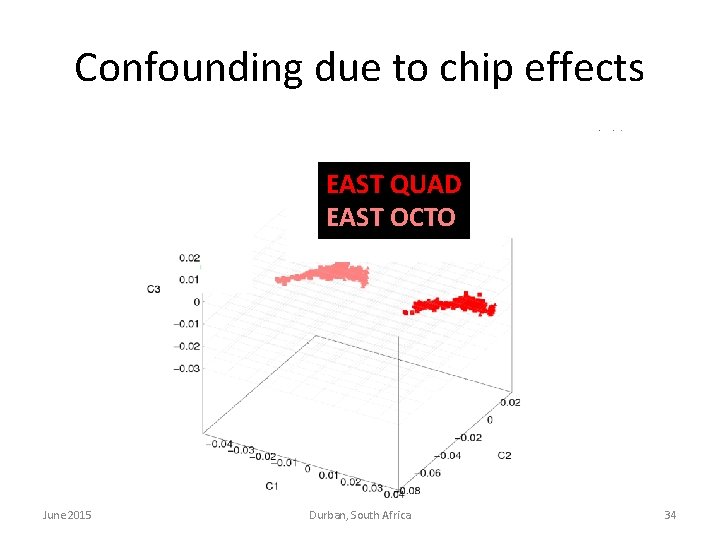
Confounding due to chip effects EAST QUAD EAST OCTO June 2015 Durban, South Africa 34
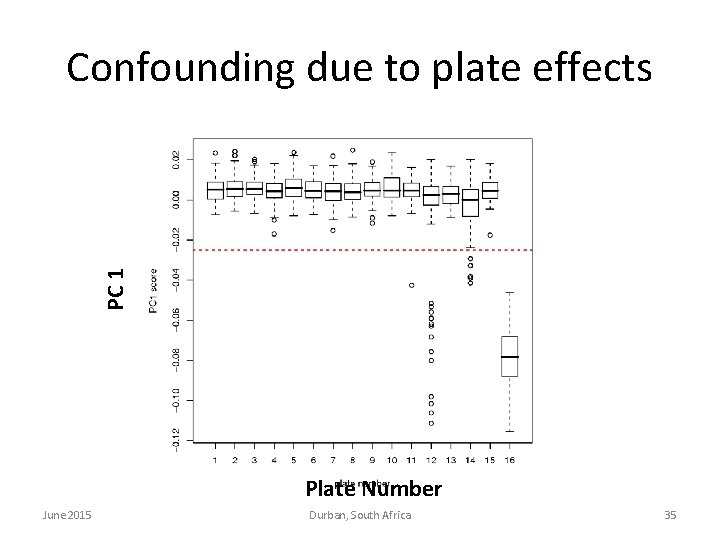
PC 1 Confounding due to plate effects Plate Number June 2015 Durban, South Africa 35
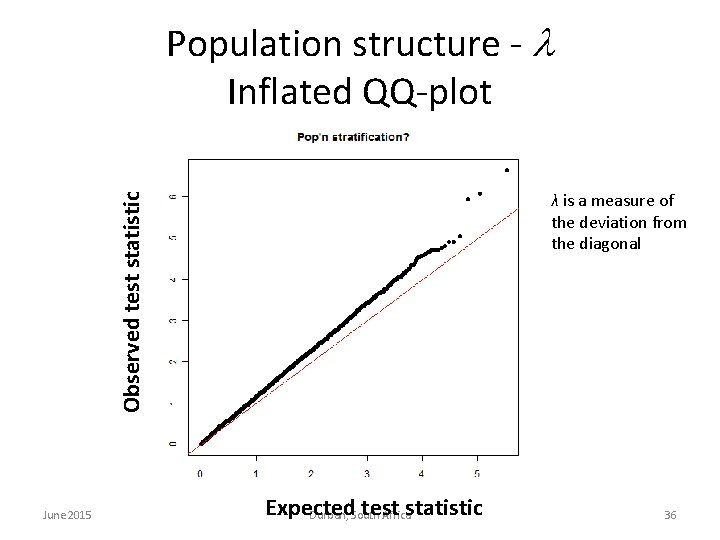
Population structure - Inflated QQ-plot Observed test statistic λ is a measure of the deviation from the diagonal June 2015 Expected test Durban, South Africastatistic 36
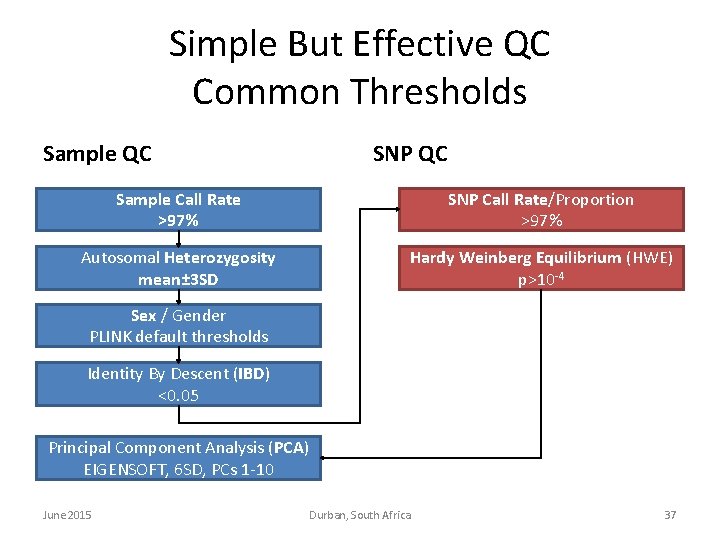
Simple But Effective QC Common Thresholds Sample QC SNP QC Sample Call Rate >97% SNP Call Rate/Proportion >97% Autosomal Heterozygosity mean± 3 SD Hardy Weinberg Equilibrium (HWE) p>10 -4 Sex / Gender PLINK default thresholds Identity By Descent (IBD) <0. 05 Principal Component Analysis (PCA) EIGENSOFT, 6 SD, PCs 1 -10 June 2015 Durban, South Africa 37
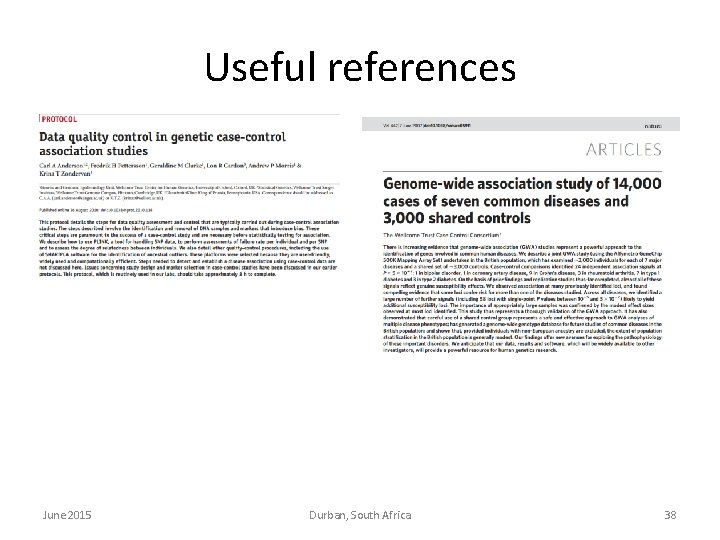
Useful references June 2015 Durban, South Africa 38
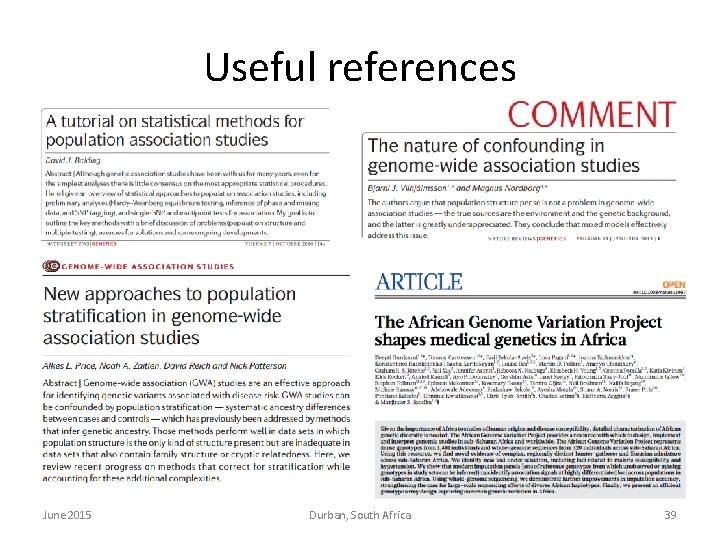
Useful references June 2015 Durban, South Africa 39
Useful software • • PLINK (QC and PCA and file format conversion and many other things) https: //www. cog-genomics. org/plink 2 • • EIGENSOFT (PCA) http: //genetics. med. harvard. edu/reich/Reich_Lab/Software. html • • GEMMA (Association analysis) http: //www. xzlab. org/software. html • • SNPTEST (Association analysis) https: //mathgen. stats. ox. ac. uk/genetics_software/snptest. html • • shellfish : Parallel PCA and data processing for genome-wide SNP data http: //www. stats. ox. ac. uk/~davison/software/shellfish. php • • IMPUTE 2 (imputation) https: //mathgen. stats. ox. ac. uk/impute_v 2. html June 2015 Durban, South Africa 40
June 2015 Durban, South Africa 41