
Comparison of Comparative Genomic Hybridization Technologies Across Microarray
Comparison of Comparative Genomic Hybridization Technologies Across Microarray Platforms The 2007 Microarray Research Group Project Susan Hester April 1, 2007 1
Two goals for this presentation: 1. Present a Comparative Genomic Hybridization Study to the ABRF research community 2. Evaluate commercial CGH platforms for their ability to detect known gains or losses 2
Background • Comparative Genomic Hybridization (CGH) measures DNA copy number differences between a reference genome and a test genome. • Early CGH experiments, the DNA targets were hybridized to metaphase chromosome spreads in FISH assays. • This technology later evolved: DNA targets are hybridized to microarrays containing c. DNA fragments or bacterial artificial chromosomes (BACs). • Commercial microarrays are characterized as whole-genome CGH measures, obtaining copy number differences in DNA across entire genomes. 3
What is CGH and what is it not? • CGH has nothing to do with gene expression. • CGH arrays are structural, not functional—they look for DNA that is missing or duplicated, not DNA that is expressed. • In array CGH, thousands of probes are printed on a microscope slide. These probes are bacterial artificial chromosomes, or BACs, which are sequences of cloned human DNA 120 -180 Kb long that have been mapped to specific locations on specific chromosomes. • To the array is added test DNA and reference or control DNA, each labeled with a different dye. The essence of the experiment is that the two DNA samples compete for hybridization to the BAC probes on the slide, thus the "comparative" aspect of CGH. 4
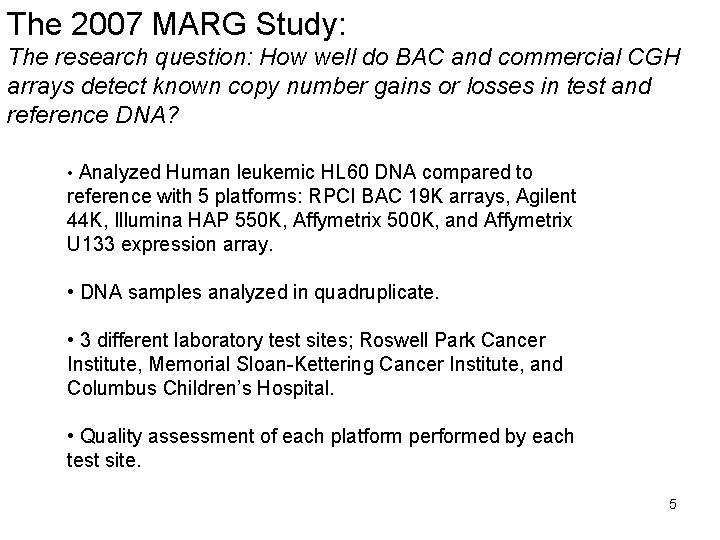
The 2007 MARG Study: The research question: How well do BAC and commercial CGH arrays detect known copy number gains or losses in test and reference DNA? • Analyzed Human leukemic HL 60 DNA compared to reference with 5 platforms: RPCI BAC 19 K arrays, Agilent 44 K, Illumina HAP 550 K, Affymetrix 500 K, and Affymetrix U 133 expression array. • DNA samples analyzed in quadruplicate. • 3 different laboratory test sites; Roswell Park Cancer Institute, Memorial Sloan-Kettering Cancer Institute, and Columbus Children’s Hospital. • Quality assessment of each platform performed by each test site. 5
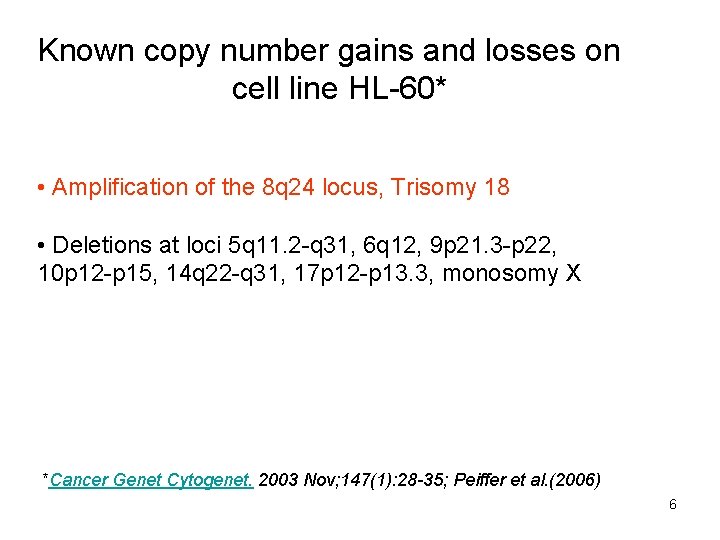
Known copy number gains and losses on cell line HL-60* • Amplification of the 8 q 24 locus, Trisomy 18 • Deletions at loci 5 q 11. 2 -q 31, 6 q 12, 9 p 21. 3 -p 22, 10 p 12 -p 15, 14 q 22 -q 31, 17 p 12 -p 13. 3, monosomy X *Cancer Genet Cytogenet. 2003 Nov; 147(1): 28 -35; Peiffer et al. (2006) 6
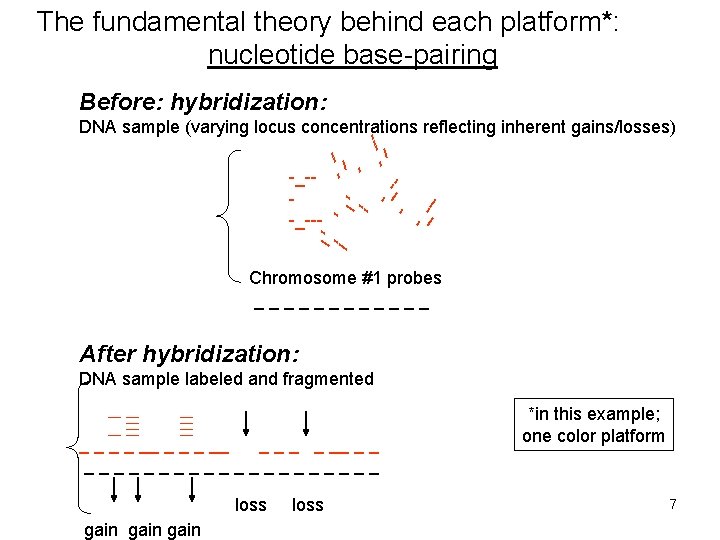
The fundamental theory behind each platform*: nucleotide base-pairing Before: hybridization: -_--_ -_--- --_ --- DNA sample (varying locus concentrations reflecting inherent gains/losses) -_--_ --_-- Chromosome #1 probes ______ After hybridization: DNA sample labeled and fragmented _ _ __ _ _ __________ loss gain loss *in this example; one color platform 7

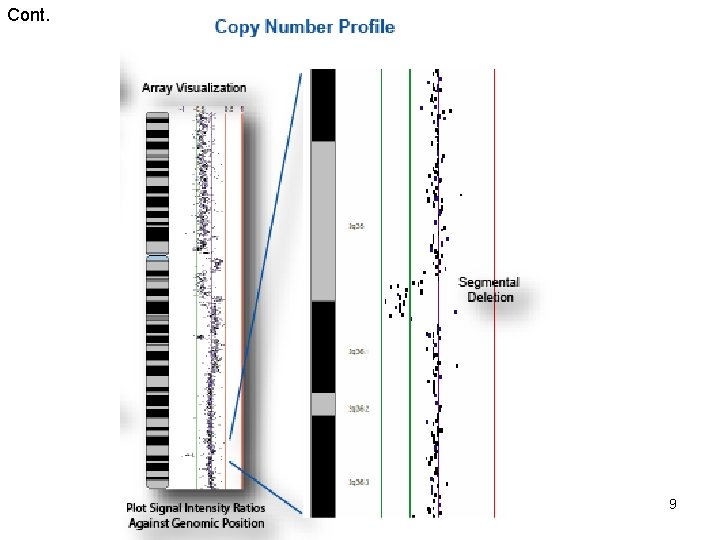
Example of Array CGH Technology* *in this example; 2 -color platform Chari et al, Cancer Informatics, 2006, 2, 48 -58 8
Cont. 9
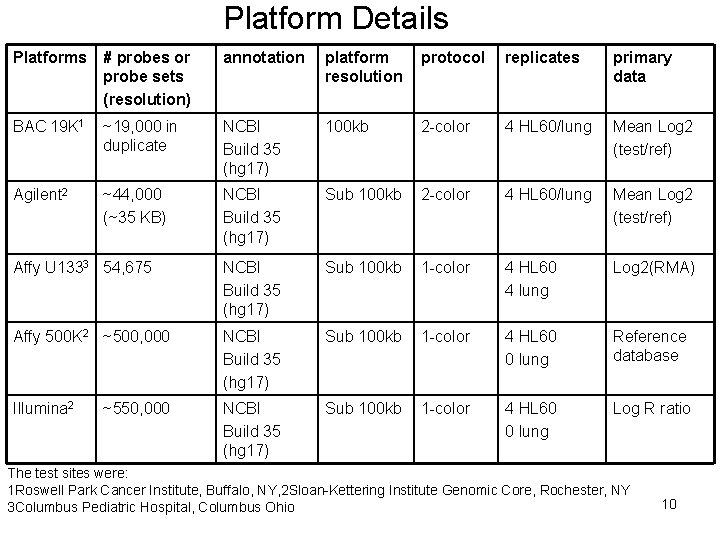
Platform Details Platforms # probes or probe sets (resolution) annotation platform resolution protocol replicates primary data BAC 19 K 1 ~19, 000 in duplicate NCBI Build 35 (hg 17) 100 kb 2 -color 4 HL 60/lung Mean Log 2 (test/ref) Agilent 2 ~44, 000 (~35 KB) NCBI Build 35 (hg 17) Sub 100 kb 2 -color 4 HL 60/lung Mean Log 2 (test/ref) Affy U 1333 54, 675 NCBI Build 35 (hg 17) Sub 100 kb 1 -color 4 HL 60 4 lung Log 2(RMA) Affy 500 K 2 ~500, 000 NCBI Build 35 (hg 17) Sub 100 kb 1 -color 4 HL 60 0 lung Reference database Illumina 2 NCBI Build 35 (hg 17) Sub 100 kb 1 -color 4 HL 60 0 lung Log R ratio ~550, 000 The test sites were: 1 Roswell Park Cancer Institute, Buffalo, NY, 2 Sloan-Kettering Institute Genomic Core, Rochester, NY 3 Columbus Pediatric Hospital, Columbus Ohio 10
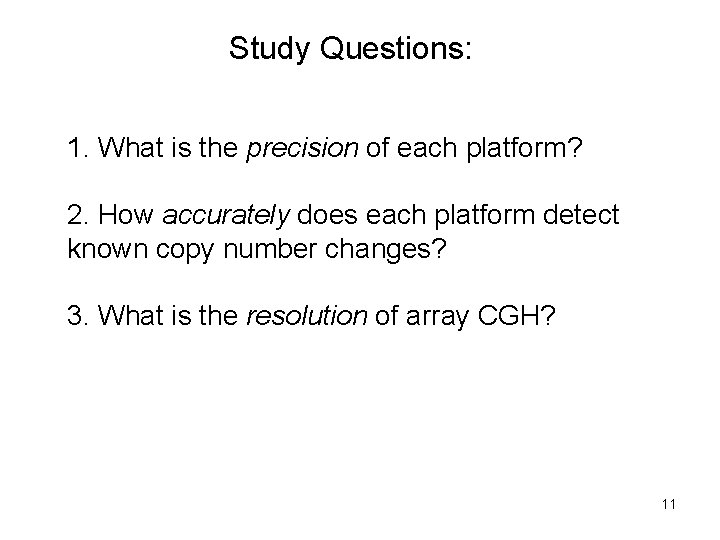
Study Questions: 1. What is the precision of each platform? 2. How accurately does each platform detect known copy number changes? 3. What is the resolution of array CGH? 11
Results: Assessment of precision- coefficient of variation across replicates 12
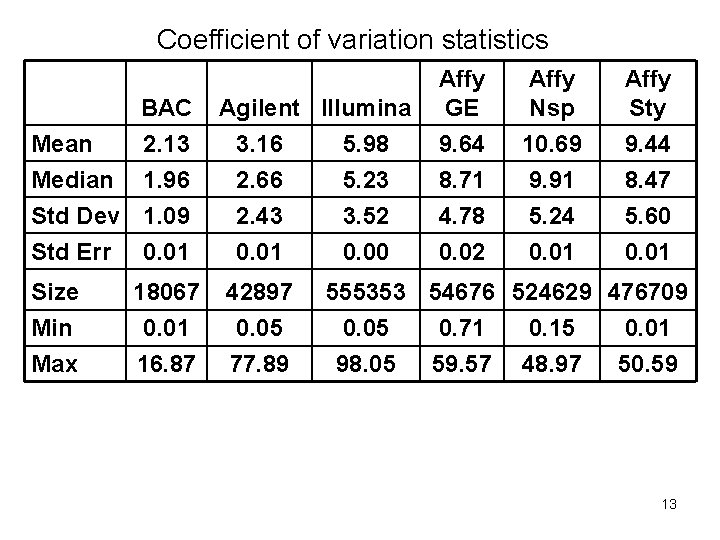
Coefficient of variation statistics Mean Median BAC Agilent Illumina 2. 13 3. 16 5. 98 1. 96 2. 66 5. 23 Std Dev 1. 09 Std Err 0. 01 2. 43 0. 01 Size 18067 42897 Min Max 0. 01 16. 87 0. 05 77. 89 3. 52 0. 00 Affy GE 9. 64 8. 71 Affy Nsp 10. 69 9. 91 Affy Sty 9. 44 8. 47 4. 78 0. 02 5. 24 0. 01 5. 60 0. 01 555353 54676 524629 476709 0. 05 98. 05 0. 71 59. 57 0. 15 48. 97 0. 01 50. 59 13
Platform Visualizations: Chromosome 8 gain Chromosome 17 deletion Chromosome 5 deletion 14
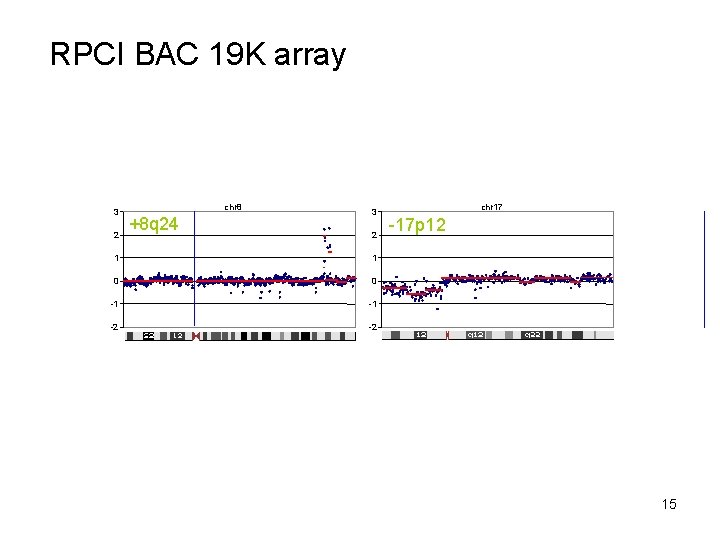
RPCI BAC 19 K array 3 2 chr 8 +8 q 24 3 2 1 1 0 0 -1 -1 -2 -2 chr 17 -17 p 12 15
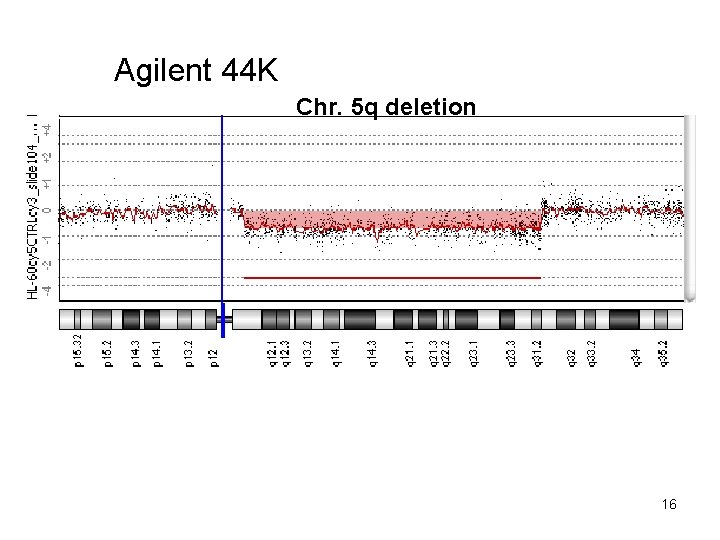
Agilent 44 K Chr. 5 q deletion 16
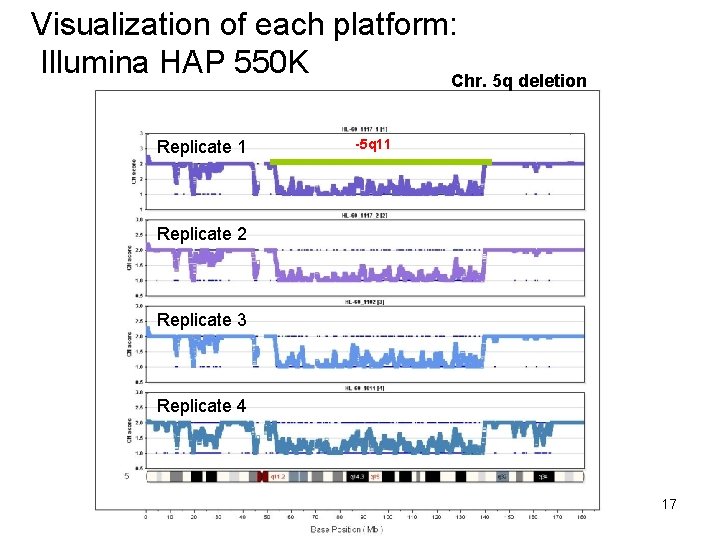
Visualization of each platform: Illumina HAP 550 K Chr. 5 q deletion Replicate 1 -5 q 11 Replicate 2 Replicate 3 Replicate 4 17
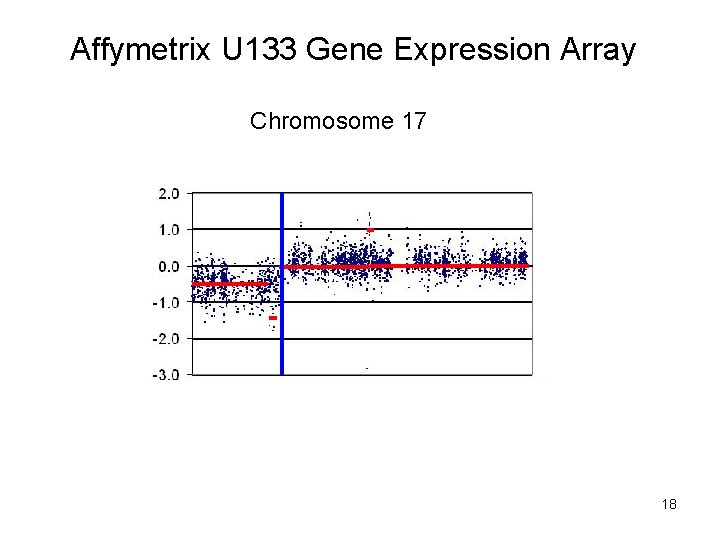
Affymetrix U 133 Gene Expression Array Chromosome 17 18
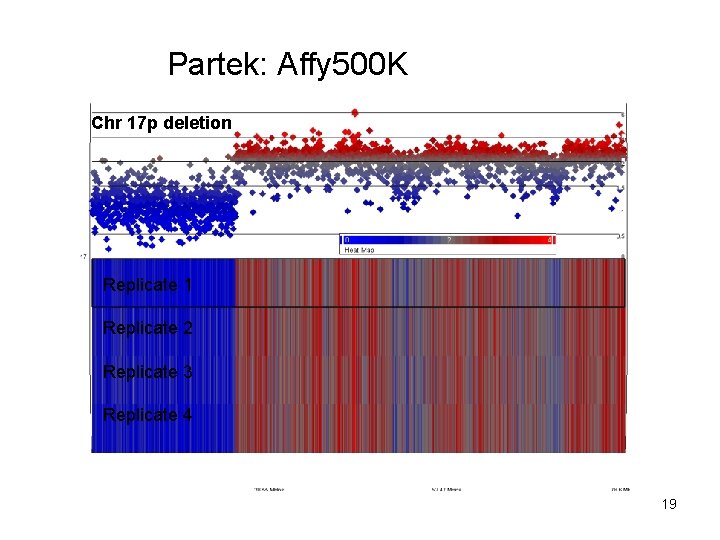
Partek: Affy 500 K Chr 17 p deletion Replicate 1 Replicate 2 Replicate 3 Replicate 4 19
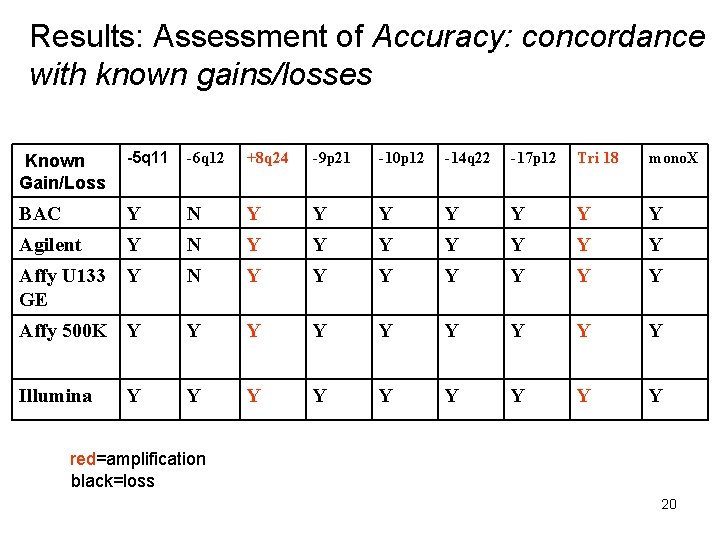
Results: Assessment of Accuracy: concordance with known gains/losses -5 q 11 -6 q 12 +8 q 24 -9 p 21 -10 p 12 -14 q 22 -17 p 12 Tri 18 mono. X BAC Y N Y Y Y Y Agilent Y N Y Y Y Y Affy U 133 GE Y N Y Y Y Y Affy 500 K Y Y Y Y Y Illumina Y Y Y Y Known Gain/Loss Y red=amplification black=loss 20
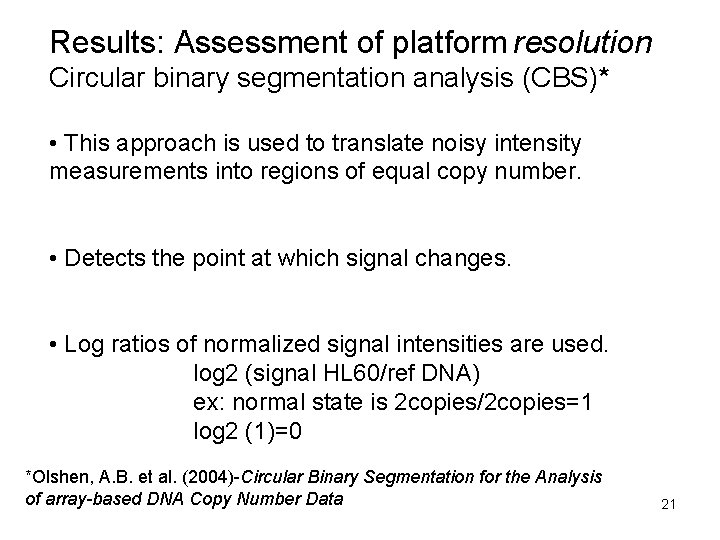
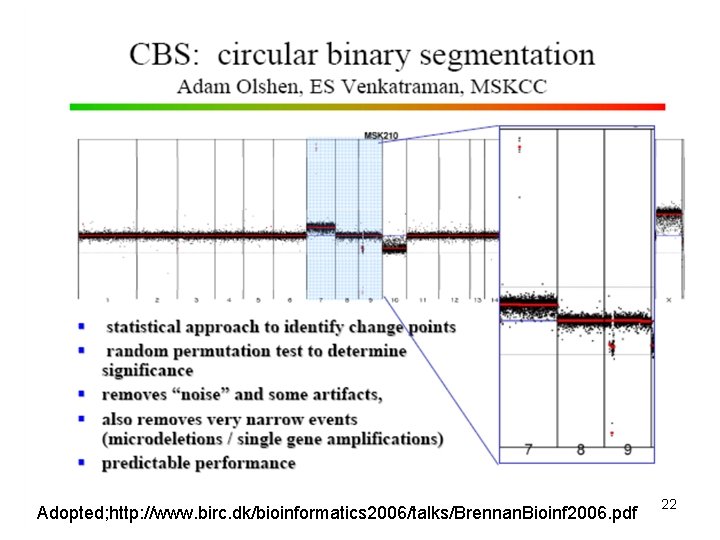
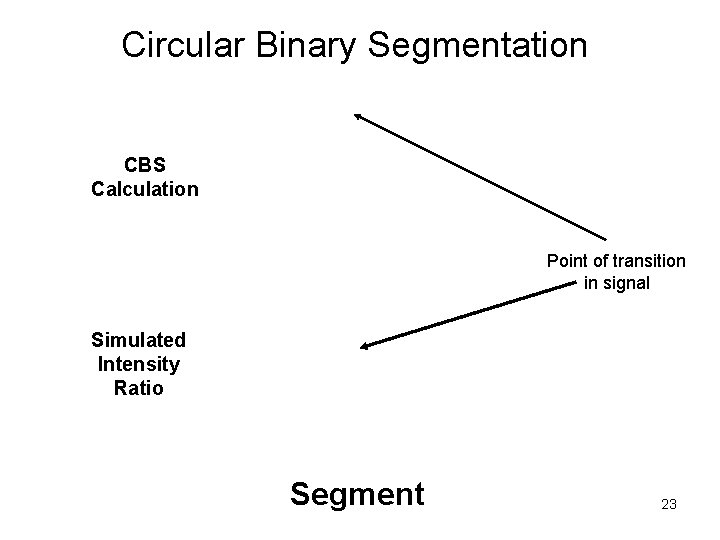
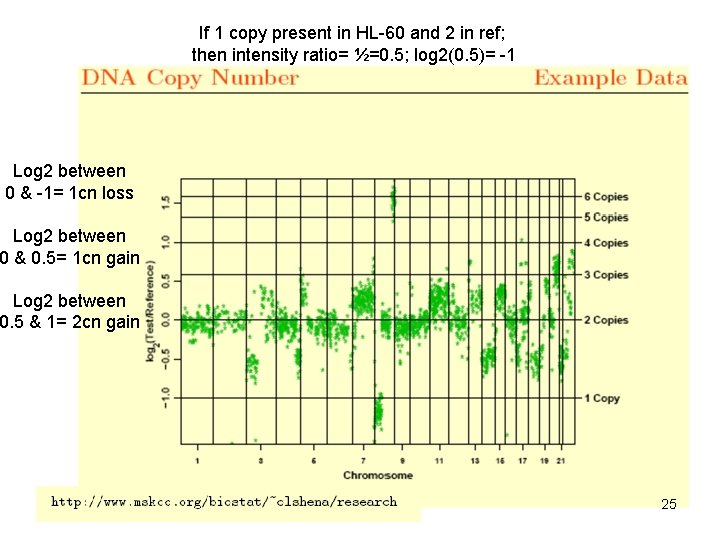
Results: Assessment of platform resolution Circular binary segmentation analysis (CBS)* • This approach is used to translate noisy intensity measurements into regions of equal copy number. • Detects the point at which signal changes. • Log ratios of normalized signal intensities are used. log 2 (signal HL 60/ref DNA) ex: normal state is 2 copies/2 copies=1 log 2 (1)=0 *Olshen, A. B. et al. (2004)-Circular Binary Segmentation for the Analysis of array-based DNA Copy Number Data 21
Adopted; http: //www. birc. dk/bioinformatics 2006/talks/Brennan. Bioinf 2006. pdf 22
Circular Binary Segmentation CBS Calculation Point of transition in signal Simulated Intensity Ratio Segment 23
Assessment of platform resolution on a known deletion or gain: • RPCI BAC 19 K • Agilent 44 K • Illumina HAP 550 • Affymetrix U 133 Gene Expression • Affymetrix 500 K 24
If 1 copy present in HL-60 and 2 in ref; then intensity ratio= ½=0. 5; log 2(0. 5)= -1 Log 2 between 0 & -1= 1 cn loss Log 2 between 0 & 0. 5= 1 cn gain Log 2 between 0. 5 & 1= 2 cn gain 25
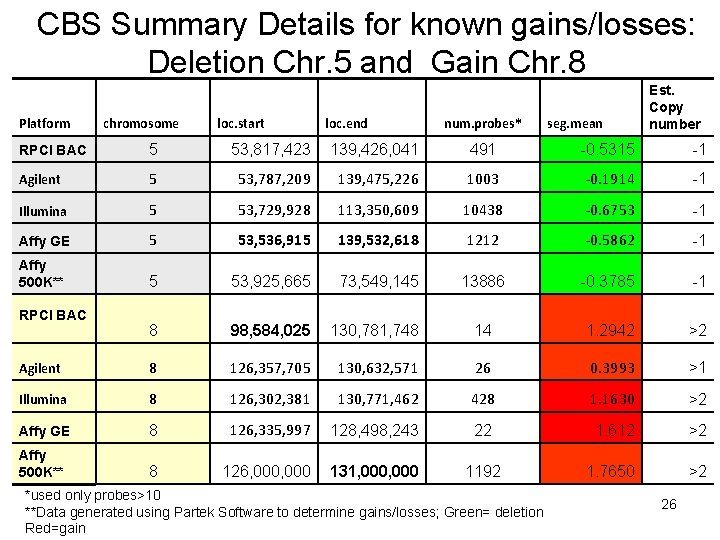
CBS Summary Details for known gains/losses: Deletion Chr. 5 and Gain Chr. 8 Platform chromosome loc. start loc. end num. probes* seg. mean Est. Copy number RPCI BAC 5 53, 817, 423 139, 426, 041 491 -0. 5315 -1 Agilent 5 53, 787, 209 139, 475, 226 1003 -0. 1914 -1 Illumina 5 53, 729, 928 113, 350, 609 10438 -0. 6753 -1 Affy GE 5 53, 536, 915 139, 532, 618 1212 -0. 5862 -1 Affy 500 K** 5 53, 925, 665 73, 549, 145 13886 -0. 3785 -1 8 98, 584, 025 130, 781, 748 14 1. 2942 >2 Agilent 8 126, 357, 705 130, 632, 571 26 0. 3993 >1 Illumina 8 126, 302, 381 130, 771, 462 428 1. 1630 >2 Affy GE 8 126, 335, 997 128, 498, 243 22 1. 612 >2 Affy 500 K** 8 126, 000 131, 000 1192 1. 7650 >2 RPCI BAC *used only probes>10 **Data generated using Partek Software to determine gains/losses; Green= deletion Red=gain 26
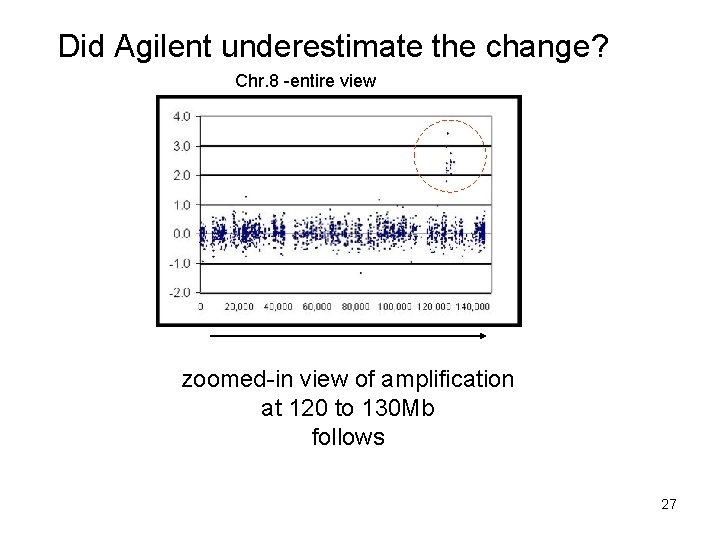
Did Agilent underestimate the change? Chr. 8 -entire view zoomed-in view of amplification at 120 to 130 Mb follows 27
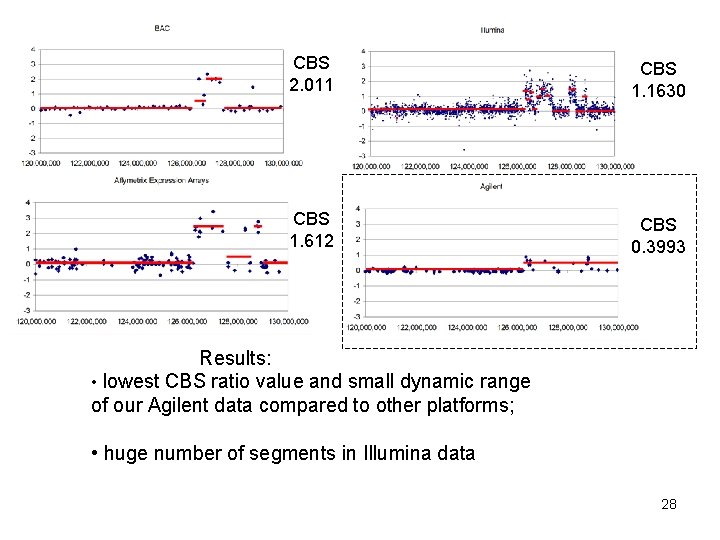
CBS 2. 011 CBS 1. 1630 CBS 1. 612 CBS 0. 3993 Results: • lowest CBS ratio value and small dynamic range of our Agilent data compared to other platforms; • huge number of segments in Illumina data 28
CBS analysis finds 3 novel gains or losses** • BAC& Affy 500 K agree -Chromosome 2 • Illumina, Agilent, Affy GE, BAC and Affy 500 K all agree on Chromosome 16 • Affy 500 K and Affy GE agreement on Chromosome 19 ** Agreement means that 2 of the 5 platforms found the same gain or losses in the same location (start to end location) 29
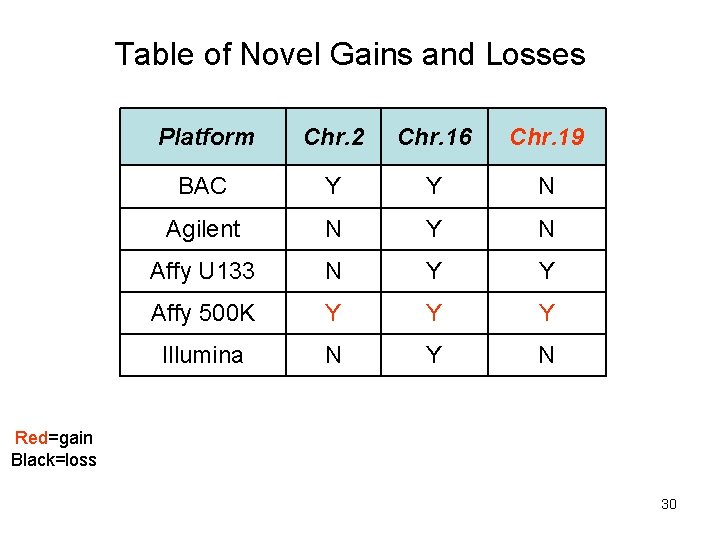
Table of Novel Gains and Losses Platform Chr. 2 Chr. 16 Chr. 19 BAC Y Y N Agilent N Y N Affy U 133 N Y Y Affy 500 K Y Y Y Illumina N Y N Red=gain Black=loss 30
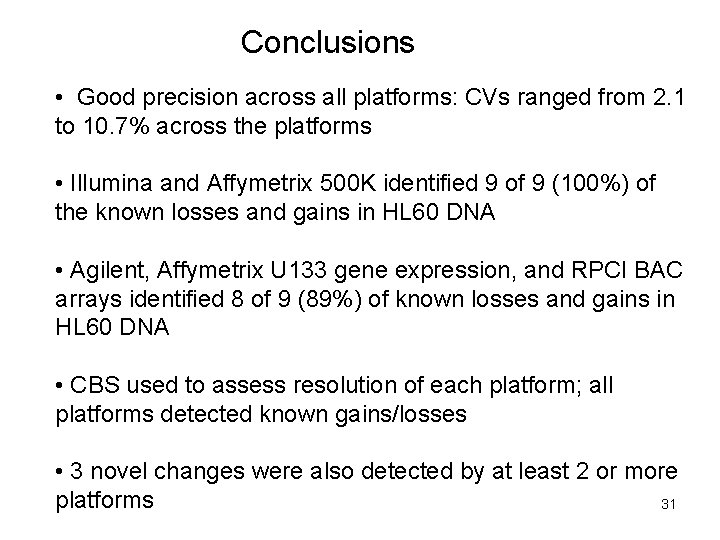
Conclusions • Good precision across all platforms: CVs ranged from 2. 1 to 10. 7% across the platforms • Illumina and Affymetrix 500 K identified 9 of 9 (100%) of the known losses and gains in HL 60 DNA • Agilent, Affymetrix U 133 gene expression, and RPCI BAC arrays identified 8 of 9 (89%) of known losses and gains in HL 60 DNA • CBS used to assess resolution of each platform; all platforms detected known gains/losses • 3 novel changes were also detected by at least 2 or more platforms 31
Acknowledgments The Microarray Research Group (MARG): Susan Hester, Laura Reid, Agnes Viale, Norma Nowak, Herbert Auer, Kevin Knudtson, Bill Ward, Jay Tiesman, Caprice Rosato, Aldo Massimi, Greg Khitrov, and Nancy Denslow Laboratory test sites: Roswell Park Cancer Institute, Memorial Sloan-Kettering Cancer Institute, and Columbus Children’s Hospital Data analysis efforts: US Environmental Protection Agency Roswell Park Cancer Institute Columbus Children’s Hospital Expression Analysis Funding support for this project: The Executive Board of the Association of Biomolecular Resource Facilities 32
MARG poster number is RG 4 -S 33

34
- Slides: 34