
Group Analyses Guillaume Flandin Wellcome Trust Centre for




- Slides: 35
Group Analyses Guillaume Flandin Wellcome Trust Centre for Neuroimaging University College London With many thanks to W. Penny, S. Kiebel, T. Nichols, R. Henson, J. -B. Poline, F. Kherif SPM Course London, October 2016
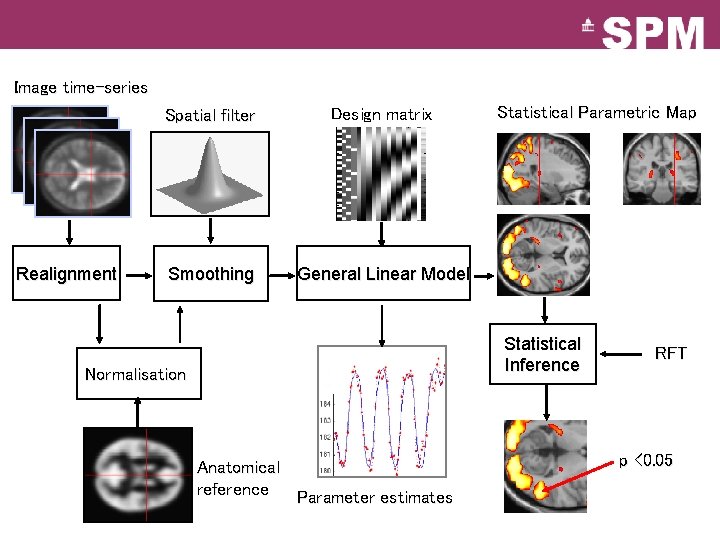
Image time-series Realignment Spatial filter Design matrix Smoothing General Linear Model Statistical Parametric Map Statistical Inference Normalisation Anatomical reference Parameter estimates RFT p <0. 05
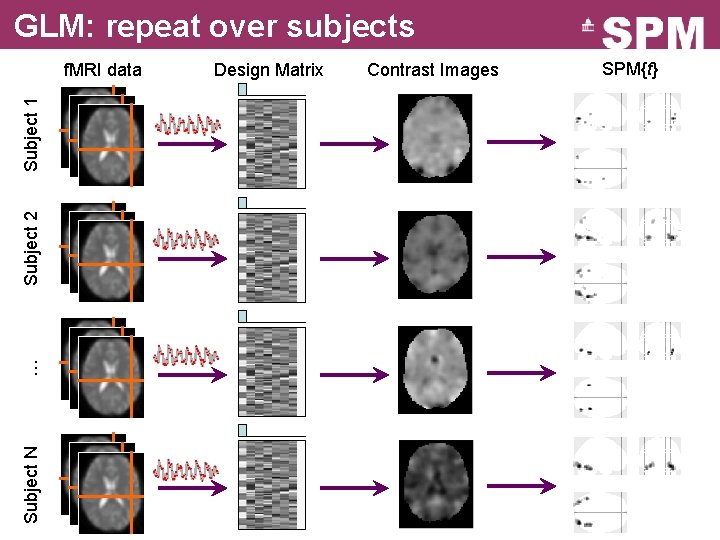
GLM: repeat over subjects Subject N … Subject 2 Subject 1 f. MRI data Design Matrix Contrast Images SPM{t}
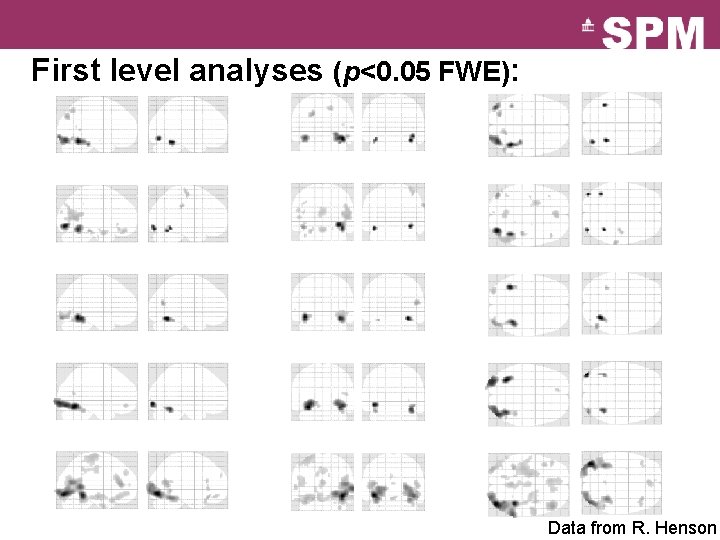
First level analyses (p<0. 05 FWE): Data from R. Henson
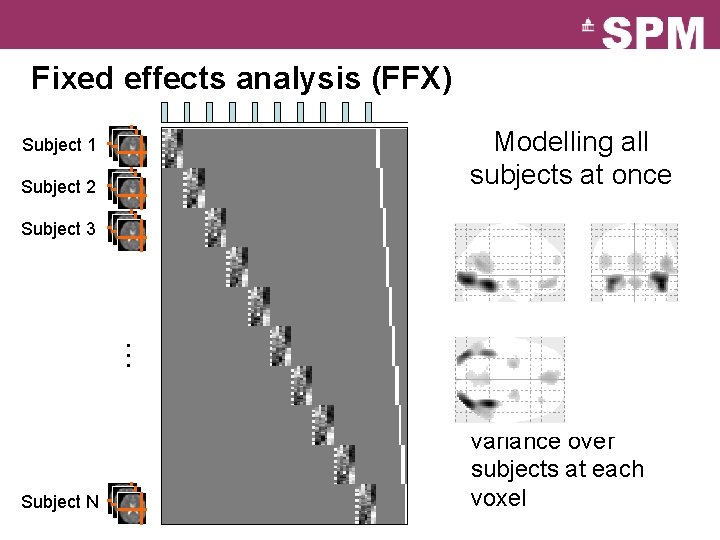
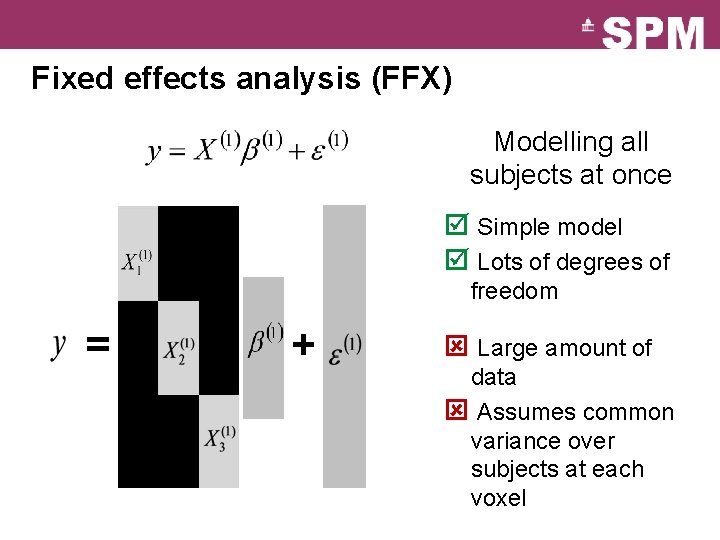
Fixed effects analysis (FFX) Modelling all subjects at once Subject 1 Subject 2 þ Simple model þ Lots of degrees of Subject 3 … freedom Subject N ý Large amount of data ý Assumes common variance over subjects at each voxel
Fixed effects analysis (FFX) Modelling all subjects at once þ Simple model þ Lots of degrees of freedom = + ý Large amount of data ý Assumes common variance over subjects at each voxel
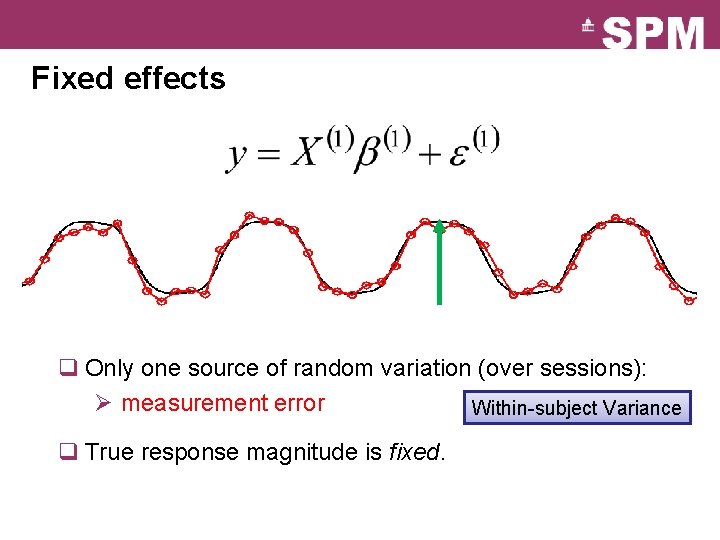
Fixed effects q Only one source of random variation (over sessions): Ø measurement error Within-subject Variance q True response magnitude is fixed.
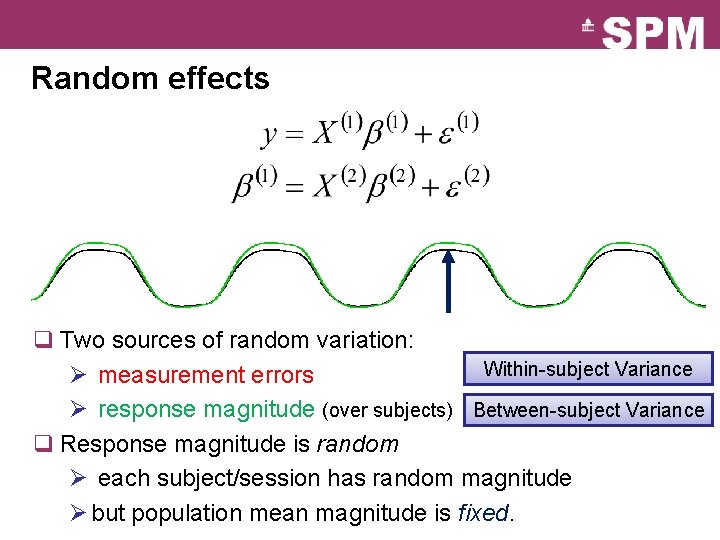
Random effects q Two sources of random variation: Within-subject Variance Ø measurement errors Ø response magnitude (over subjects) Between-subject Variance q Response magnitude is random Ø each subject/session has random magnitude
Random effects q Two sources of random variation: Within-subject Variance Ø measurement errors Ø response magnitude (over subjects) Between-subject Variance q Response magnitude is random Ø each subject/session has random magnitude Ø but population mean magnitude is fixed.
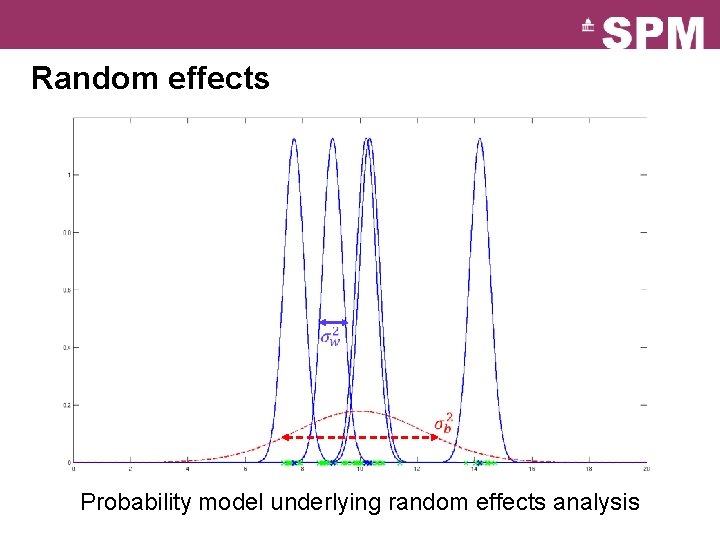
Random effects Probability model underlying random effects analysis
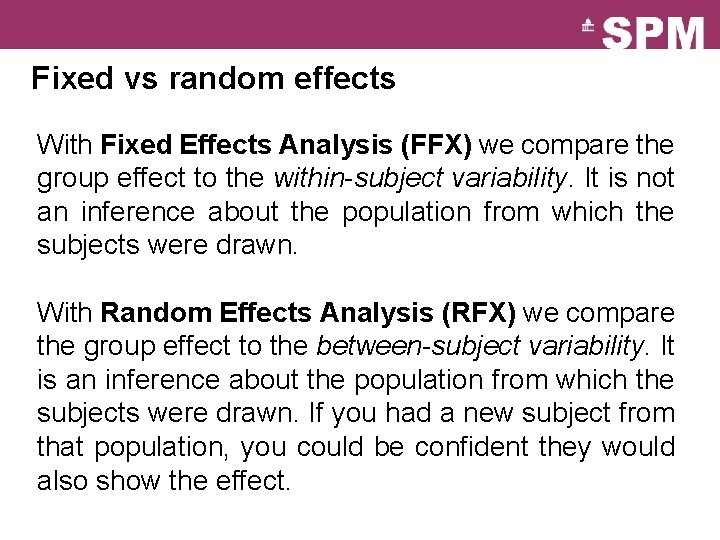
Fixed vs random effects With Fixed Effects Analysis (FFX) we compare the group effect to the within-subject variability. It is not an inference about the population from which the subjects were drawn. With Random Effects Analysis (RFX) we compare the group effect to the between-subject variability. It is an inference about the population from which the subjects were drawn. If you had a new subject from that population, you could be confident they would also show the effect.
Fixed vs random effects q Fixed isn’t “wrong”, just usually isn’t of interest. q Summary: Ø Fixed effects inference: “I can see this effect in this cohort” Ø Random effects inference: “If I were to sample a new cohort from the same population I would get the same result”
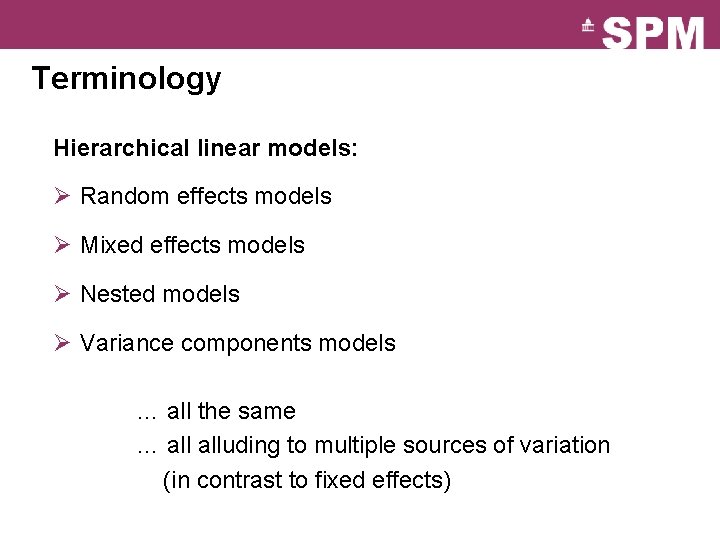
Terminology Hierarchical linear models: Ø Random effects models Ø Mixed effects models Ø Nested models Ø Variance components models … all the same … alluding to multiple sources of variation (in contrast to fixed effects)
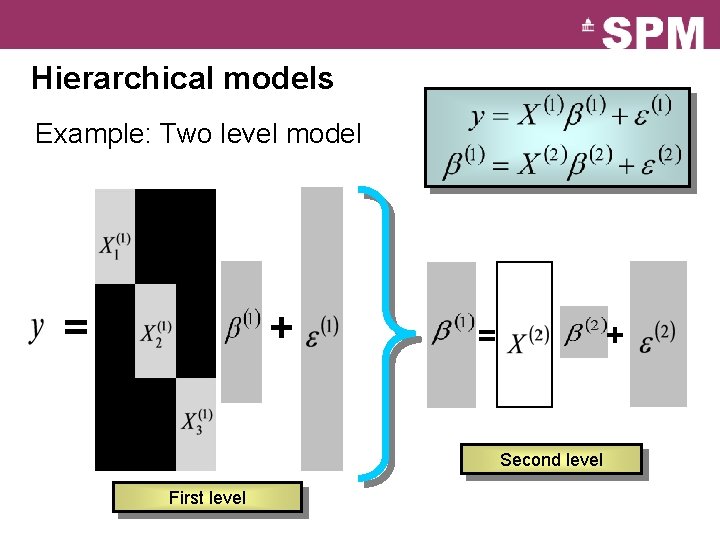
Hierarchical models Example: Two level model = + + = Second level First level
Hierarchical models Ø Restricted Maximum Likelihood (Re. ML) Ø Parametric Empirical Bayes Ø Expectation-Maximisation Algorithm But: Ø Many two level models are just too big to compute. Ø And even if, it takes a long time! spm_mfx. m Ø Any approximation? Mixed-effects and f. MRI studies. Friston et al. , Neuro. Image, 2005.
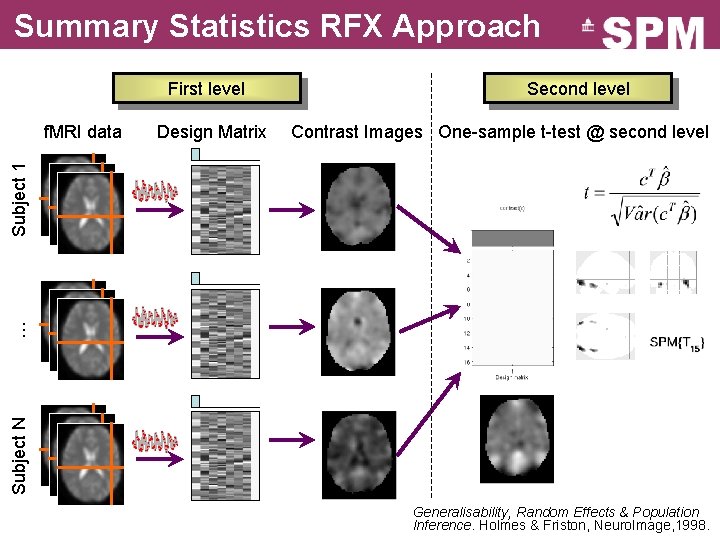
Summary Statistics RFX Approach First level Design Matrix Contrast Images One-sample t-test @ second level Subject N … Subject 1 f. MRI data Second level Generalisability, Random Effects & Population Inference. Holmes & Friston, Neuro. Image, 1998.
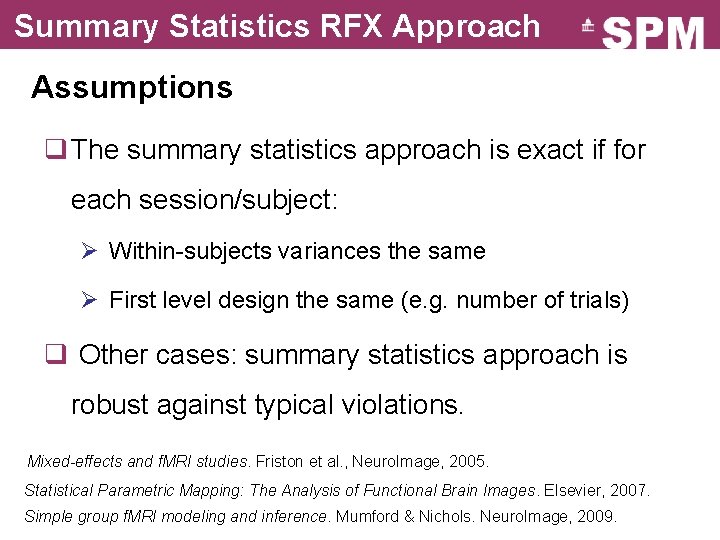
Summary Statistics RFX Approach Assumptions q The summary statistics approach is exact if for each session/subject: Ø Within-subjects variances the same Ø First level design the same (e. g. number of trials) q Other cases: summary statistics approach is robust against typical violations. Mixed-effects and f. MRI studies. Friston et al. , Neuro. Image, 2005. Statistical Parametric Mapping: The Analysis of Functional Brain Images. Elsevier, 2007. Simple group f. MRI modeling and inference. Mumford & Nichols. Neuro. Image, 2009.
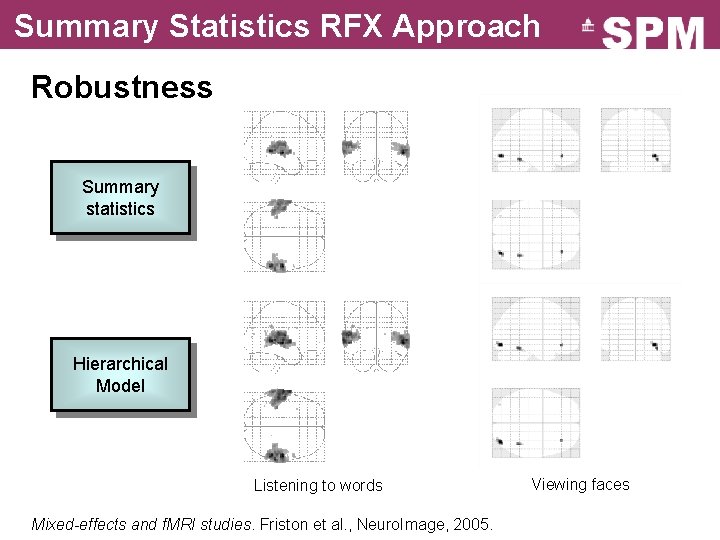
Summary Statistics RFX Approach Robustness Summary statistics Hierarchical Model Listening to words Mixed-effects and f. MRI studies. Friston et al. , Neuro. Image, 2005. Viewing faces
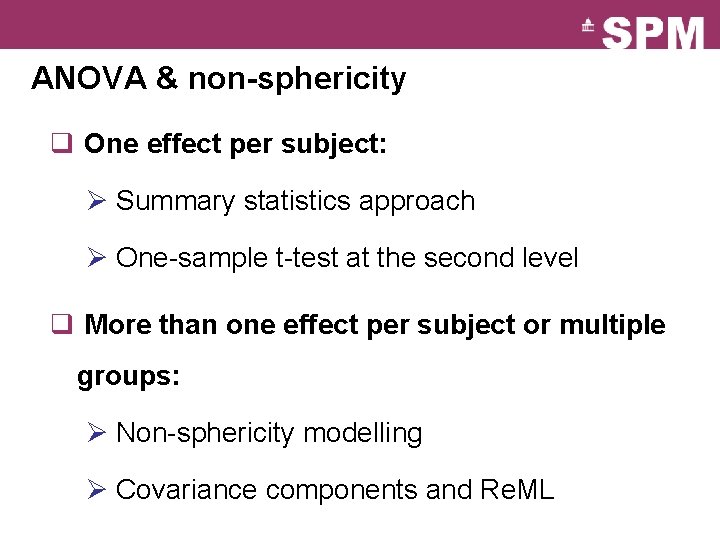
ANOVA & non-sphericity q One effect per subject: Ø Summary statistics approach Ø One-sample t-test at the second level q More than one effect per subject or multiple groups: Ø Non-sphericity modelling Ø Covariance components and Re. ML
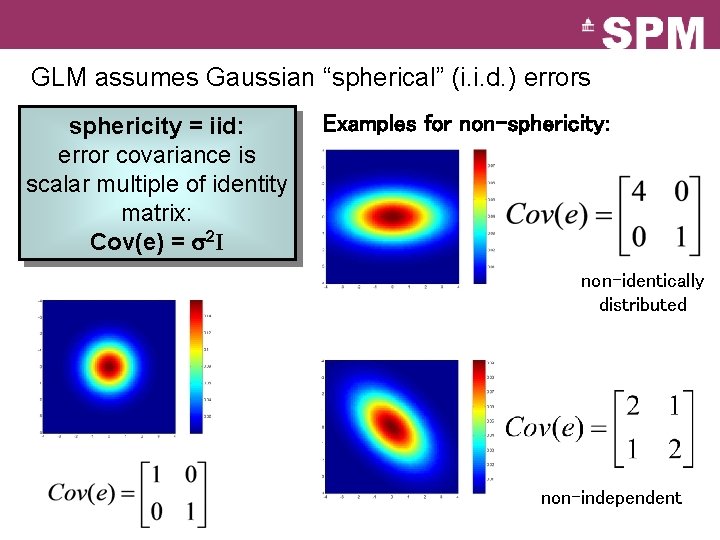
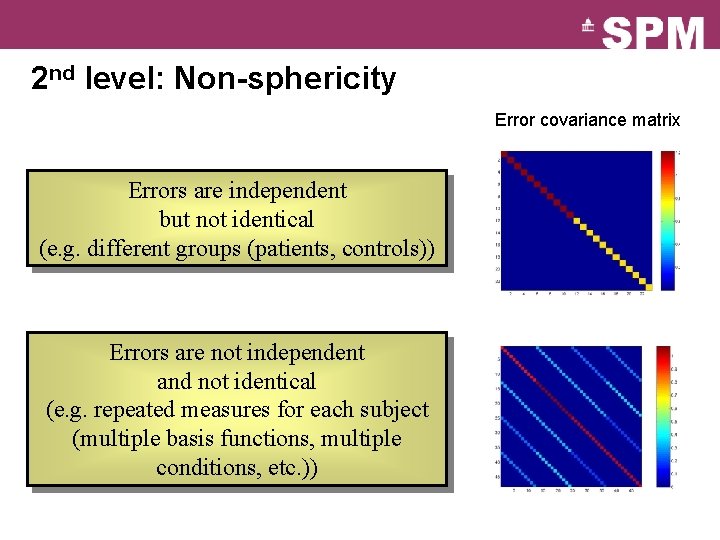
GLM assumes Gaussian “spherical” (i. i. d. ) errors sphericity = iid: error covariance is scalar multiple of identity matrix: Cov(e) = 2 I Examples for non-sphericity: non-identically distributed non-independent
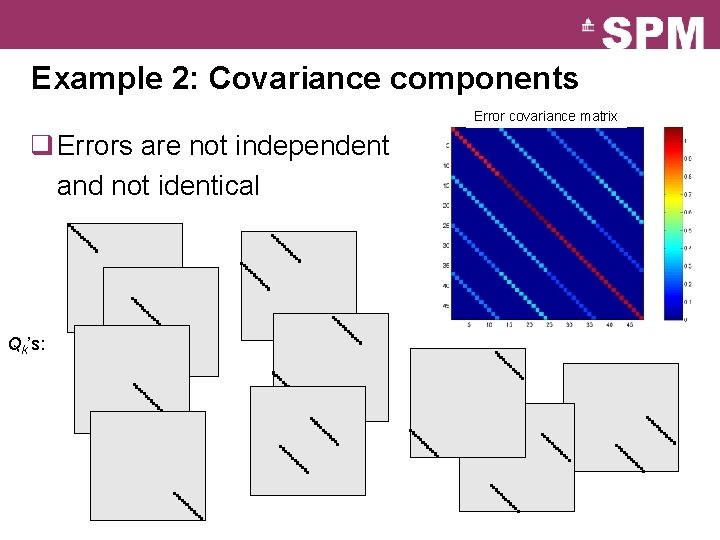
2 nd level: Non-sphericity Error covariance matrix Errors are independent but not identical (e. g. different groups (patients, controls)) Errors are not independent and not identical (e. g. repeated measures for each subject (multiple basis functions, multiple conditions, etc. ))
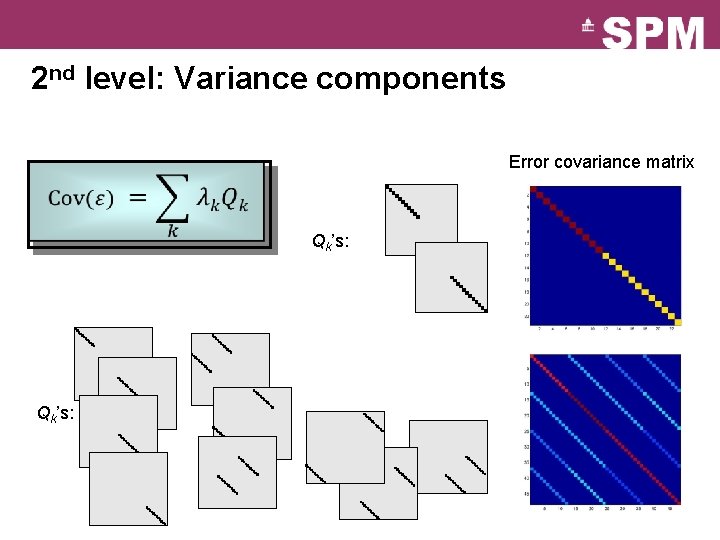
2 nd level: Variance components Error covariance matrix Qk’s:
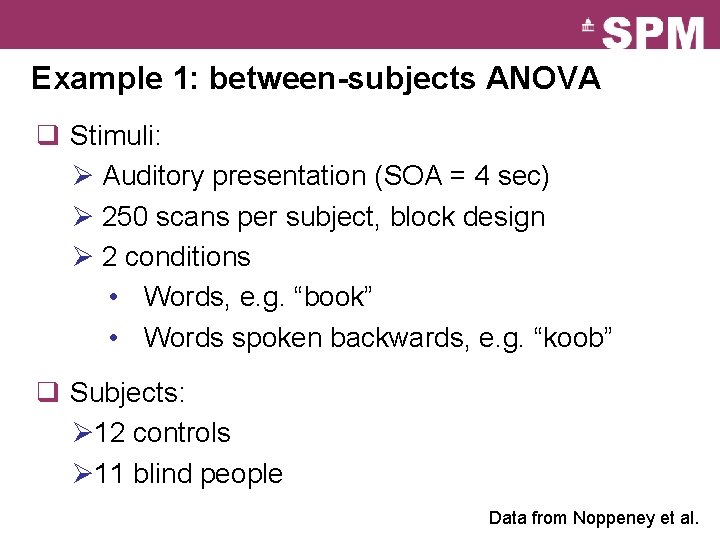
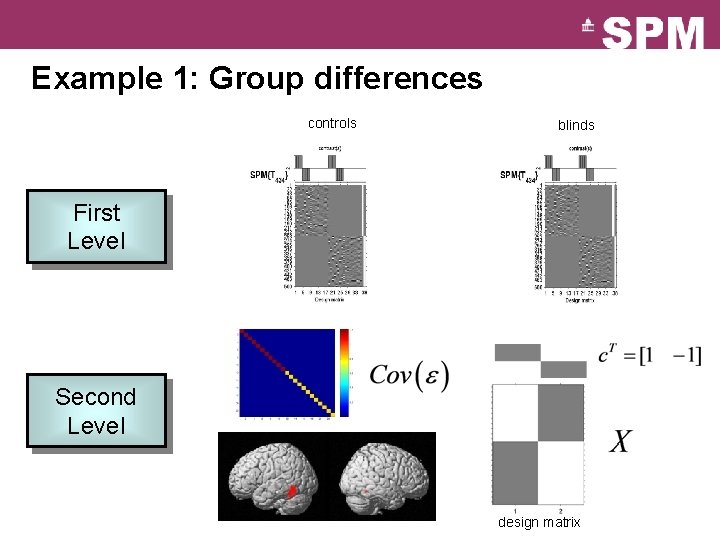
Example 1: between-subjects ANOVA q Stimuli: Ø Auditory presentation (SOA = 4 sec) Ø 250 scans per subject, block design Ø 2 conditions • Words, e. g. “book” • Words spoken backwards, e. g. “koob” q Subjects: Ø 12 controls Ø 11 blind people Data from Noppeney et al.
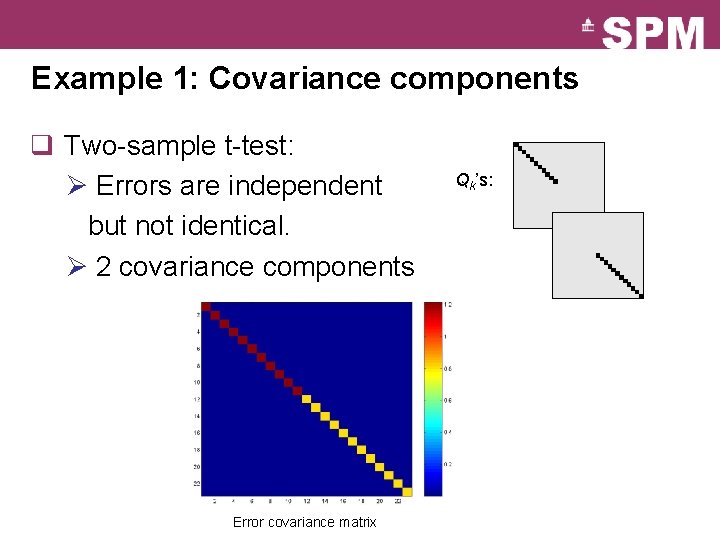
Example 1: Covariance components q Two-sample t-test: Ø Errors are independent but not identical. Ø 2 covariance components Error covariance matrix Qk’s:
Example 1: Group differences controls blinds First Level Second Level design matrix
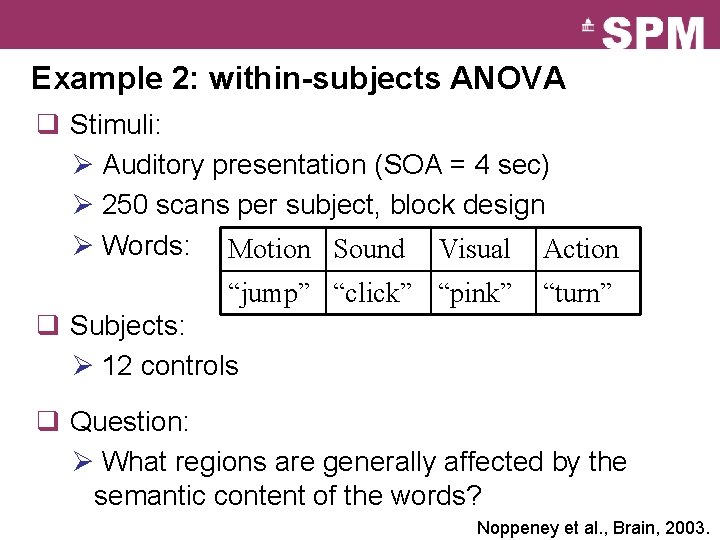
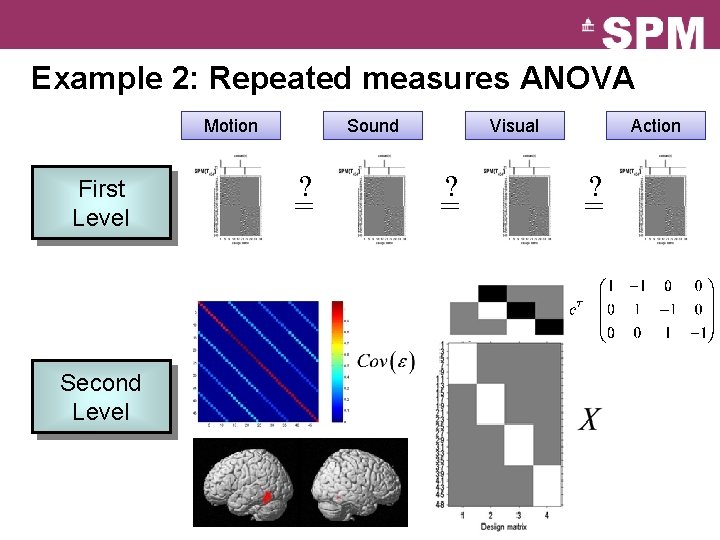
Example 2: within-subjects ANOVA q Stimuli: Ø Auditory presentation (SOA = 4 sec) Ø 250 scans per subject, block design Ø Words: Motion Sound Visual Action “jump” “click” “pink” “turn” q Subjects: Ø 12 controls q Question: Ø What regions are generally affected by the semantic content of the words? Noppeney et al. , Brain, 2003.
Example 2: Covariance components Error covariance matrix q Errors are not independent and not identical Qk’s:
Example 2: Repeated measures ANOVA Motion First Level Second Level Sound ? = Visual ? = Action ? =
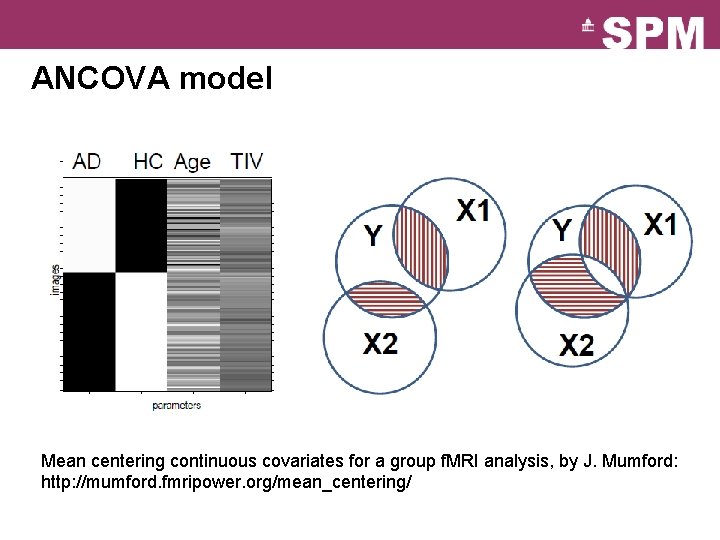
ANCOVA model Mean centering continuous covariates for a group f. MRI analysis, by J. Mumford: http: //mumford. fmripower. org/mean_centering/
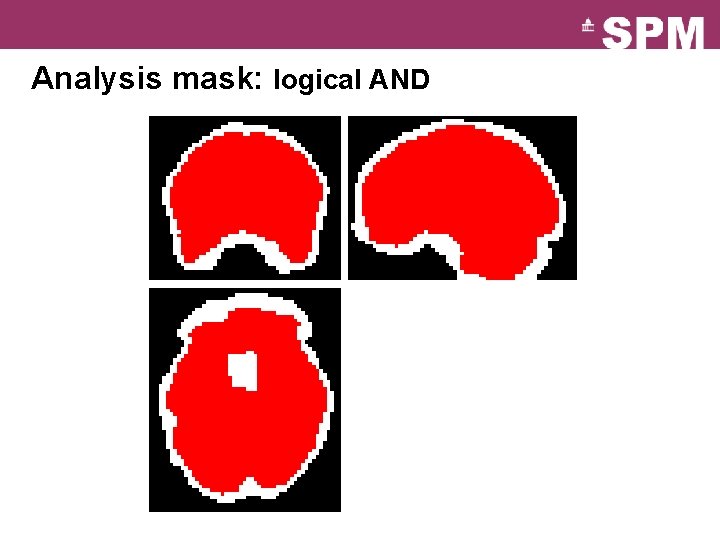
Analysis mask: logical AND 16 12 8 4 0
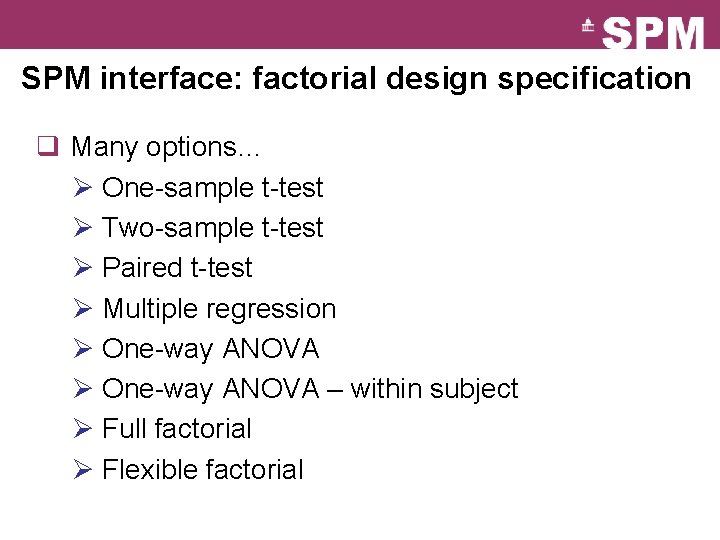
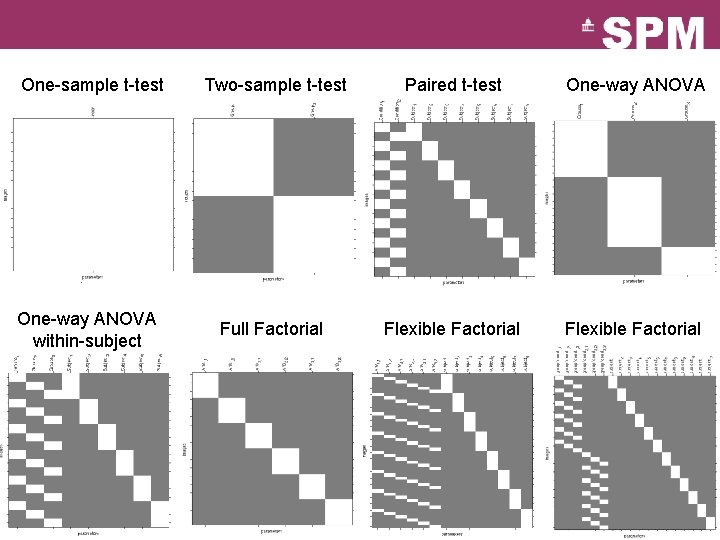
SPM interface: factorial design specification q Many options… Ø One-sample t-test Ø Two-sample t-test Ø Paired t-test Ø Multiple regression Ø One-way ANOVA – within subject Ø Full factorial Ø Flexible factorial
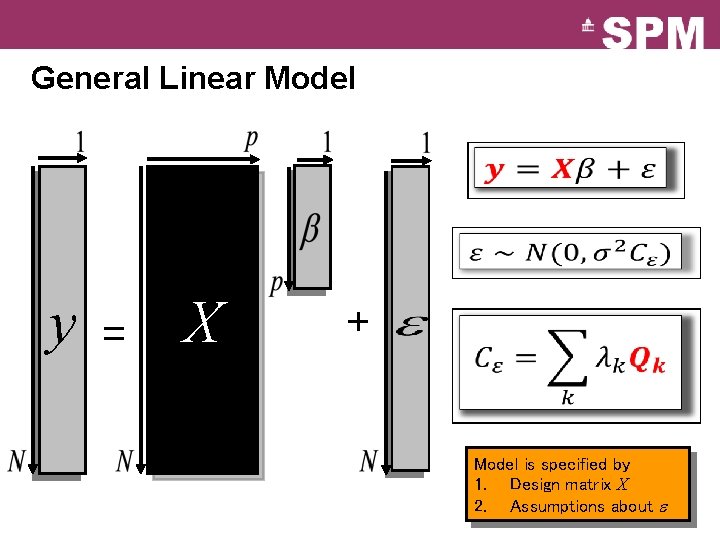
General Linear Model y = X + Model is specified by 1. Design matrix X 2. Assumptions about
One-sample t-test Two-sample t-test Paired t-test One-way ANOVA within-subject Full Factorial Flexible Factorial
Summary q Group Inference usually proceeds with RFX analysis, not FFX. Group effects are compared to between rather than within subject variability. q Hierarchical models provide a gold-standard for RFX analysis but are computationally intensive. q Summary statistics approach is a robust method for RFX group analysis. q Can also use ‘ANOVA’ or ‘ANOVA within subject’ at second level for inference about multiple experimental conditions or multiple groups.
Bibliography: q Statistical Parametric Mapping: The Analysis of Functional Brain Images. Elsevier, 2007. q Generalisability, Random Effects & Population Inference. Holmes & Friston, Neuro. Image, 1998. q Classical and Bayesian inference in neuroimaging: theory. Friston et al. , Neuro. Image, 2002. q Classical and Bayesian inference in neuroimaging: variance component estimation in f. MRI. Friston et al. , Neuro. Image, 2002. q Mixed-effects and f. MRI studies. Friston et al. , Neuro. Image, 2005. q Simple group f. MRI modeling and inference. Mumford & Nichols, Neuro. Image, 2009.