TOGAF 9 Fundamental 5 UML Overview Romi Satria

 SMPN 8 Semarang (1990) SMA")


 2005 Inventory system problems")


 13")


: 1. The degree to which a")

 21")


 • The amount of an investment today compared to the same")

 The present value of benefit less the present value of")

 The Amount of revenue or cost savings results from a")

 The point in time when the costs of the project")
 42")

 • High-level non-IS executive • Shepherds project to")


")


")


 • Defines the behavior of the class • Action that instances/objects can")


 140")


 Actor Type Description Weighting Factor Simple External")


 Factor Number Description Weight T 1 Distributed system 2. 0")
 Factor Number Description Weight E 1 Familiarity with system development")
 = UUCP * TCF")
 Let F 1 = Number of ECF 1 to ECF")


 = 27 = 20*27")

 = 662 = 20*662")
 Pekerjaan Man-Month Budget Total Planning 1 1 5000. 000 10. 000")
 Product Total LMS 10. 000 Teleconference 2. 000 Chatting 4. 000")

- Slides: 159
TOGAF 9 Fundamental: 5. UML Overview Romi Satria Wahono romi@romisatriawahono. net http: //romisatriawahono. net/tfu WA/SMS: +6281586220090
Romi Satria Wahono • • SD Sompok Semarang (1987) SMPN 8 Semarang (1990) SMA Taruna Nusantara Magelang (1993) B. Eng, M. Eng and Ph. D in Software Engineering from Saitama University Japan (1994 -2004) Universiti Teknikal Malaysia Melaka (2014) Research Interests: Software Engineering, Machine Learning Founder Ilmu. Komputer. Com PNS di PDII LIPI (1994 -2007) Founder dan CEO PT Brainmatics Cipta Informatika 2
Course Outline 1. Introduction 2. TOGAF Concepts 3. TOGAF ADM 4. BPMN Overview 5. UML Overview 6. TOGAF Case Study 3
5. UML Overview 5. 1 The Nature of Software Development 5. 2 Identifying Business Value (System Request) 5. 3 Feasibility Analysis 5. 4 Systems Analysis and Design with UML 5. 5 Estimating Project Size with Use Case Points 4
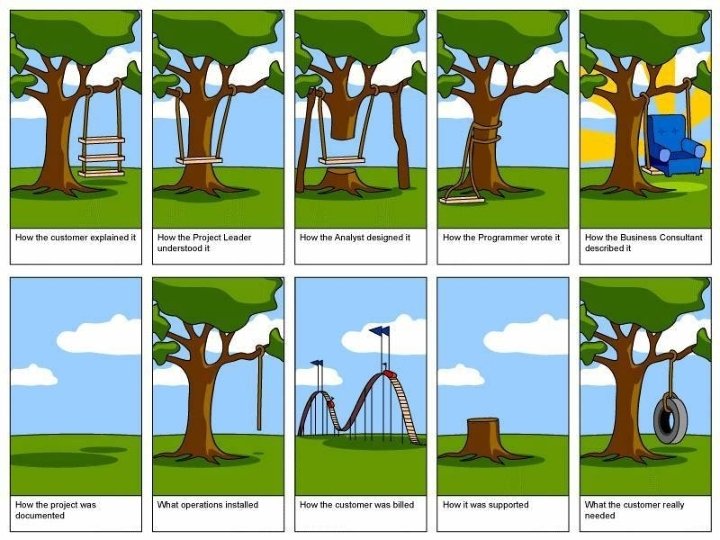
5. 1 The Nature of Software Development 5
Systems Development Projects Fail • More than half of all systems development projects Fail (42% - Standish Group, 53% - General Accounting Office) • Canceled before completion • System is never used once finished • Doesn't provide the expected benefits • Most of the ones that don't fail: • Are delivered late • Are over budget • Don't provide the features promised 6
Recent Significant IT Failures Company Year Outcome Hudson Bay (Canada) 2005 Inventory system problems lead to $33. 3 million loss UK Inland Revenue 2004/5 $3. 45 billion tax-credit overpayment caused by software errors Avis Europe PLC (UK) 2004 Enterprise resource planning (ERP) system cancelled after $54. 5 million spent Ford Motor Co. 2004 Purchasing system abandoned after deployment costing approximately $400 M Hewlett-Packard Co. 2004 ERP system problems contribute to $160 million loss AT&T Wireless 2004 Customer relations management (CRM) system upgrade problems lead to $100 M loss 7
Keunikan dari Software Karakteristik Kompleksitas Visibilitas Produk Software Tingkat kompleksitas dari produk software tinggi, dengan kemungkinan perubahan parameter dan fungsi yang sangat beragam Produk tidak terlihat dengan kasat mata, termasuk bila ada cacat (defect) dari produk 8 Hardware Tingkat kompleksitas produk lain rendah, dengan kemungkinan perubahan parameter dan fungsi tidak beragam Produk terlihat dengan kasat mata, termasuk bila ada cacat (defect) dari produk
Software Errors, Faults, Failures 9
Analisis Kasus • Suatu perusahaan PT ABC memproduksi software yang akan ditanam ke dalam suatu device • Salah satu fungsi yang terdapat pada software adalah akan mematikan device secara otomatis apabila suhu ruangan lebih besar daripada 30 o celcius • Programmer salah menuliskan logika menjadi: … if (suhu > 3) shutdown. Device(); … • Error ini tidak pernah menyebabkan failure pada software, dan perusahaan PT ABC sampai saat ini terkenal sebagai perusahaan yang memproduksi software tanpa bug • Jelaskan mengapa bisa terjadi demikian! 10
Is it Possible?
5. 2 Identifying Business Value (System Request) 13
When Do Projects Begin? • When someone sees an opportunity to create business value from using information technology • Then he or she creates a system request • Feasibility analysis is used to aid in the decision of whether or not to proceed with the project • Project estimation is important activity which aims to estimating the size of software project 14
Elements of a System Request 1. Project Name • The name of project 2. Project sponsor • Primary point of contact for the project 3. Business need • Reason prompting the project 4. Business requirements • Business capabilities the system will need to have 5. Business value • Benefits the organization can expect from the project 6. Special issues • Anything else that should be considered • Budget constraints, deadline, Legal requirements 15
Business Need • Describes why the system should be built • Why the project should be funded • Should be clear and concise • Probably not completely defined 16
Business Requirements • What the system will do • High level explanation to the approval committee • Tell about the features and capabilities • Can be replaced by Use Case Diagram 17
Business Value • Tangible value • A quantifiable value • E. g. : 2 % reduction in operating cost • Intangible value • Intuitive believe why the system will help the company • E. g. : improved customer service, a better competitive position 18
Sofware Quality • Software quality is (IEEE, 1991): 1. The degree to which a system, component, or process meets specified requirements 2. The degree to which a system, component, or process meets customer or user needs or expectations • Software quality measures how well software is designed (quality of design), and how well the software conforms to that design (quality of conformance) (Pressman, 2014) • Quality means conformance to requirements (Crosby, 1979) 19
Software untuk Pesan Taxi 20
Software untuk Pesan Ojek (Go-Jek) 21
22
System Request Elemen Deskripsi Contoh Business Need The business-related reason for initiating the software development project Increase sales Improve market share Improve access to information Improve customer service Decrease product defects Streamline supply acquisition processes Business The business capabilities Provide on. Iine access to information Requirements that software will Capture customer demographic information provide Include product search capabilities Produce management reports Include online user support Business Value The benefits that the software will create for the organization 3% increase in sales % increase in market share 10% operational cost reduction $200, 000 cost savings from decreased supply costs $150, 000 savings from removal of existing system 23
24
System Request—Internet order project Project sponsor: Margaret Mooney, Vice President of Marketing Business Need: This project has been initiated to reach new Internet customers and to better serve existing customers using Internet sales support. Business Requirements: Using the Web, customers should be able to search for products and identify the brick-and-mortar stores that have them in stock. They should be able to put items on hold at a store location or place an order for items that are not carried or not in stock. The functionality that the system should have is listed below: 1. Search through the CD Selections’ inventory of products 2. Identify the retail stores that have the product in stock 3. Put a product on hold at a retail store and schedule a time to pick up the product 4. Place an order for products not currently in stock or not carried by CD Selections 5. Receive confirmation that an order can be placed and when it will be in stock Business Value: We expect that CD Selections will increase sales by reducing lost sales due to out-of-stock or nonstocked items and by reaching out to new customers through its Internet presence. We expect the improved services will reduce customer complaints, primarily because 50 percent of all customer complaints stem from out of stocks or nonstocked items. Also, CD Selections should benefit from improved customer satisfaction and increased brand recognition due to its Internet presence. Conservative estimates of tangible value to the company includes: 1. $750, 000 in sales from new customers 2. $1, 875, 000 in sales from existing customers 3. $50, 000 yearly reduction in customer service calls Special Issues or Constraints: The Marketing Department views this as a strategic system. This Internet system will add value to our current business model, and it also will serve as a proof of concept for future Internet endeavors. For example, in the future, CD Selections may want to sell products directly over the Internet. 25 The system should be in place for the holiday shopping season next year.
Exercise: Membuat System Request 1. Lihat contoh System Request untuk Internet Order Project 2. Pikirkan suatu sistem* yang saat ini dibutuhkan oleh perusahaan atau organisasi anda 3. Buat System Request dari sistem tersebut 26
5. 3 Feasibility Analysis 27
Feasibility Analysis 1. Technical feasibility: Can we build it? 2. Economic feasibility: Should we build it? 3. Organizational feasibility: If we build it, will they come? 28
Feasibility Analysis 1 Technical Feasibility • • Familiarity with application: Less familiarity generates more risk Familiarity with technology: Less familiarity generates more risk Project size: Large projects have more risk Compatibility: The harder it is to integrate the system with the company’s existing technology, the higher the risk will be 2 Economic Feasibility • Return on Investment (ROI) • Break Even Point (BEP) • Intangible Benefit 3 Organizational • Is the software project strategically aligned with the Feasibility business? 29
Technical Feasibility Familiarity with • Knowledge of business domain application • Need to understand improvements • Need to recognize pitfalls and bad ideas Familiarity with • Is technology new to this organization? technology • Is this a brand new technology? • Extension of existing firm technologies Project size Compatibility • Number of people, time, and features • Systems are not built in a vacuum • Needs to integrate with current systems and data 30
Economic Feasibility: Should We Build It? 31
Cost-Benefit Analysis - Cash Flow • Project costs and benefits over several years (3– 5) • Use normal growth rates for sales etc. • Total added to determine • Overall Benefits = Total Benefits – Total Costs • Higher number is better 32
Cost-Benefit Analysis - Cash Flow 33
Cash Flow Plan 34
Present Value (PV) • The amount of an investment today compared to the same amount n years in the future • Taking into account inflation and time PV = Amount (1 + Interest Rate)n 35
Net Present Value 36
Net Present Value (NPV) The present value of benefit less the present value of cost NPV = PV Benefits – PV Costs 37
NPV Calculation 38
Return on Investment (ROI) The Amount of revenue or cost savings results from a given investment ROI =Total Benefits – Total Costs 39
ROI Calculation 40
Break Even Point (BEP) The point in time when the costs of the project equal the value it has delivered BEP = Yearly NPV* – Cumulative NPV Yearly* NPV * Use the yearly NPV amount from the first year in which project has positive cash flow 41
Break Even Point (BEP) 42
Organizational Feasibility • Strategic Alignment • How well does the project match up with the business strategy? • Stakeholder analysis considers • Project champion (Product Owner) • Organizational management • System users • Anybody affected by the change 43
Stakeholder Analysis Considers • Project champion(s) • High-level non-IS executive • Shepherds project to completion • It's good to have more than one • Organizational management • Need this support to sell system to organization • System users • In the loop so end system meets needs 44
Stakeholder Analysis Considers 45
Feasibility Analysis Template Technical Feasibility: Can We Build It? 1. 2. 3. 4. Familiarity with Application: Less familiarity generates more risk Familiarity with Technology: Less familiarity generates more risk Project Size: Large projects have more risk Compatibility: The harder it is to integrate the system with the company’s existing technology, the higher the risk Economic Feasibility: Should We Build It? 1. Return on Investment (ROI) over 3 years 2. Break-even Point (BEP) 3. Total benefit after 3 years Organizational Feasibility: If We Build It, Will They Come? 1. 2. 3. 4. 5. Project champion(s) Senior management Users Other stakeholders Is the project strategically aligned with the business? 46
CD Selection Internet Order Feasibility Analysis Executive Summary Margaret Mooney and Alec Adams created the following feasibility analysis for the CD Selections Internet Order System Project. The System Proposal is attached, along with the detailed feasibility study Technical Feasibility The Internet Order System is feasible technically, although there is some risk. CD Selections’ risk regarding familiarity with the application is high • • The Marketing Department has little experience with Internet-based marketing and sales The IT Department has strong knowledge of the company’s existing order systems; however, it has not worked with Web-enabled order systems CD Selections’ risk regarding familiarity with the technology is medium • • • The IT Department has relied on external consultants and an Information Service Provider to develop its existing Web environment The IT Department has learned about Web technology by maintaining the corporate site Development tools and products for commercial Web application development are available in the marketplace, although the IT department has little experience with them The project size is considered medium risk • • • The project team likely will include less than ten people Business user involvement will be required The project timeframe cannot exceed a year because of the Christmas holiday season implementation deadline, and it should be much shorter The compatibility with CD Selections’ existing technical infrastructure should be good • • • The current Order System is a client-server system built using open standards. An interface with the Web should be possible Retail stores already place and maintain orders electronically 47 An Internet infrastructure already is in place at retail stores and at the corporate headquarters
Economic Feasibility A cost–benefit analysis was performed; see attached spreadsheet for details. A conservative approach shows that the Internet Order System has a good chance of adding to the bottom line of the company significantly. • Return on Investment (ROI) over 3 years: 229 percent • Break-even point (BEP): after 1. 7 years • Total benefit after three years: $3. 5 million (adjusted for present value) Intangible Costs and Benefits • Improved customer satisfaction • Greater brand recognition Organizational Feasibility • From an organizational perspective, this project has low risk. The objective of the system, which is to increase sales, is aligned well with the senior management’s goal of increasing sales for the company. The move to the Internet also aligns with Marketing’s goal to become more savvy in Internet marketing and sales. • The project has a project champion, Margaret Mooney, Vice President of Marketing. Margaret is well positioned to sponsor this project and to educate the rest of the senior management team when necessary. To date, much of senior management is aware of and supports the initiative. • The users of the system, Internet consumers, are expected to appreciate the benefits of CD Selections’ Web presence. And, management in the retail stores should be willing to accept 48 the system, given the possibility of increased sales at the store level.
2003 Increased sales from new customers 0 Increased sales from existing customers 0 Reduction in customer complaint calls 0 Total Benefits: 0 PV of All Benefits: 0 Labor: Analysis, Design and Implementation 162, 000 Consultant Fees 50, 000 Office Space and Equipment 7, 000 Software and Hardware 35, 000 Total Development Costs: 254, 000 Labor: Webmaster 85, 000 Labor: Network Technician 60, 000 Labor: Computer Operations 50, 000 Labor: Business Manager 60, 000 Labor: Assistant Manager 45, 000 Labor: 3 Staff 90, 000 Software upgrades and licenses 4, 000 Hardware upgrades 5, 000 User training 2, 000 Communications charges 20, 000 Marketing expenses 25, 000 Total Operational Costs: 446, 000 Total Costs: 700, 000 PV of Costs: 679, 612 PV of all Costs: 679, 612 Total Project Costs Less Benefits: (700, 000) Yearly NPV: (679, 612) Cumulative NPV: (679, 612) Return on Investment (ROI): 229. 16% Break-even Point (BEP): 1. 32 years 49 2004 2005 Total 750, 000 1, 875, 000 50, 000 2, 675, 000 2, 521, 444 0 0 0 87, 550 61, 800 51, 500 61, 800 46, 350 92, 700 1, 000 3, 000 1, 000 20, 000 25, 000 452, 700 426, 713 1, 106, 325 2, 222, 300 2, 094, 731 1, 415, 119 (3, 509, 878/1, 531, 638) 772, 500 1, 931, 250 50, 000 2, 753, 750 2, 520, 071 5, 041, 515 0 0 0 90, 177 63, 654 53, 045 63, 654 47, 741 95, 481 1, 000 3, 000 1, 000 20, 000 25, 000 464, 751 425, 313 1, 531, 638 2, 288, 999 2, 094, 758 3, 509, 878 5, 041, 515 1, 531, 638 3, 509, 878 (BEP in Year 2 = [2, 094, 731 – 1, 415, 119] / 2, 094, 731 = 0. 32)
Exercise: Membuat Feasibility Analysis 1. Lihat contoh Feasibility Analysis untuk Internet Order Project 2. Perhatikan kembali System Request yang sebelumnya sudah kita buat 3. Buat Feasibility Analysis dari system yang akan kita buat tersebut 50
5. 4 Systems Analysis and Design with UML 51
System Analysis and Design with UML 1. System Analysis 1. Business Process Identification § 2. Use Case Diagram Business Process Modeling § 3. Activity Diagram or Business Process Modeling Notation (BPMN) Business Process Realization § Sequence Diagram (Buat untuk setiap use case dengan menggunakan pola Boundary-Control-Entity) 2. System Design 1. Program Design 1. 2. 3. Class Diagram (Gabungkan Boundary-Control-Entity Class dan susun story dari sistem yang dibangun) Package Diagram (Gabungan class yang sesuai, boleh menggunakan pola B-C-E) Deployment Diagram (arsitektur software dari sistem yang dibangun) User Interface Design (Buat UI design dari Boundary Class) Entity-Relationship Model (Buat ER diagram dari Entity Class)
5. 4. 1 Business Process Identification: Use Case Diagram 53
Use Case Diagrams • Summarized into a single picture • All of the use cases for the part of the system being modeled • Use case represents the discrete activities performed by the user • Use Case Diagram tells what the system will do • Good for communicating with users
Use Case Diagram Syntax • Actor • person or system that derives benefit from and is external to the subject • Use Case • Represents a major piece of system functionality • Association Relationship • Include Relationship • Extend Relationship • Generalization Relationship <<includes>> <<extends>>
Use Case • A major piece of system functionality Use Case • Can extend other Use Cases • Placed inside system boundary • Labeled with descriptive verb - noun phrase
System Boundary • Includes the name Boundary of the system inside or on top • Represents the scope of the system • Actors are outside the scope of the system
Actor • A person or another system that interacts with the current system • A role, not a specific user • Provides input, receives output, or both actor Actor/Role
Association Relationship • Links actor and the Use Case • Shows two-way communication • If one-way, arrows are used • * is for "multiplicity of the Association" * *
Extends Relationship • Extends Use Case to include Optional behavior • Arrow points from the extension Use Case to the base Use Case extend Make Payment Arrangement extend Make Appointment
Include Relationship • Include one Use Case from within another • Arrow points from base Use Case to the included Use Case include Make New Patient Appointment include Create New Patient
Generalization Relationship • A specialized Use Case to a more generalized Use Case • Arrow points from specialized to general Use Case Make Old Appointment Make Appointment
Use Case Diagram for Appointment System
Use Case Diagram with Specialized Actor
Extend and Include Relationships
Studi Kasus: ATM System 66
ATM System
ATM System Layar Kotak Uang Kotak Kartu Kotak Kuitansi
Masukkan PIN: Kotak Uang Kotak Kartu Kotak Kuitansi
Menu Utama 1. Melihat Saldo 2. Mentransfer Uang 3. Mengambil Uang 4. Logout Kotak Uang Kotak Kartu Kotak Kuitansi
Menu Melihat Saldo 1. Saldo anda adalah …. Kotak Uang Kotak Kartu Kotak Kuitansi
Menu Mentransfer Uang 1. No Account Penerima: Kotak Uang Kotak Kartu Kotak Kuitansi
Menu Mentransfer Uang 1. Jumlah uang yang dikirim: Kotak Uang Kotak Kartu Kotak Kuitansi
Menu Mentransfer Uang 1. Uang berhasil terkirim Kotak Uang Kotak Kartu Kotak Kuitansi
Menu Mengambil Uang 1. Jumlah uang yang diambil: Kotak Uang Kotak Kartu Kotak Kuitansi
Menu Mengambil Uang berhasil diambil Kotak Uang Kotak Kartu Kotak Kuitansi
Use Case Diagram
Use Case Diagram (Alternatif)
5. 4. 2 Business Process Modeling 79
System Analysis and Design with UML 1. System Analysis 1. Business Process Identification § 2. Use Case Diagram Business Process Modeling § 3. Activity Diagram or Business Process Modeling Notation (BPMN) Business Process Realization § Sequence Diagram (Buat untuk setiap use case dengan menggunakan pola Boundary-Control-Entity) 2. System Design 1. Program Design 1. 2. 3. Class Diagram (Gabungkan Boundary-Control-Entity Class dan susun story dari sistem yang dibangun) Package Diagram (Gabungan class yang sesuai, boleh menggunakan pola B-C-E) Deployment Diagram (arsitektur software dari sistem yang dibangun) User Interface Design (Buat UI design dari Boundary Class) Entity-Relationship Model (Buat ER diagram dari Entity Class)
Business Process Modeling: Activity Diagram 81
BPM With Activity Diagrams • A number of activities support a business process across several departments • Activity diagrams model the behavior in a business process 82
Syntax for an Activity Diagram 83
Activity Diagram Example 84
Creating Activity Diagrams 1. Set the context or scope of the activity being modeled 2. Identify the activities and control/object flows between activities 3. Identify any decisions made 4. Look for opportunities for parallelism 5. Draw the diagram 85
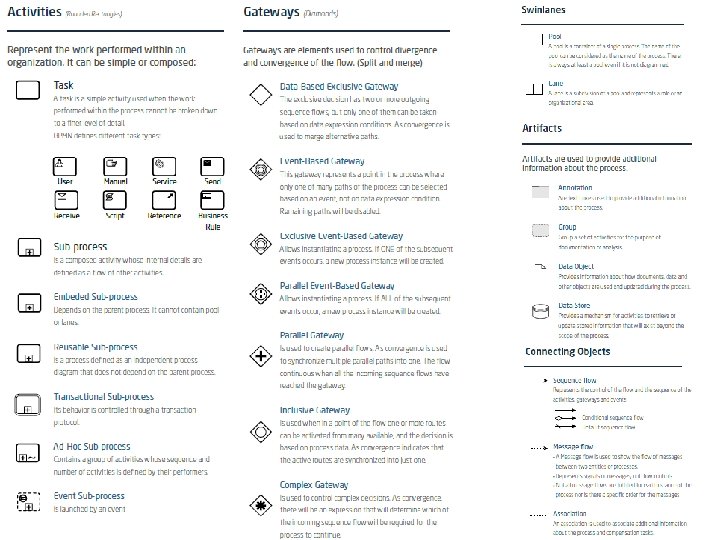
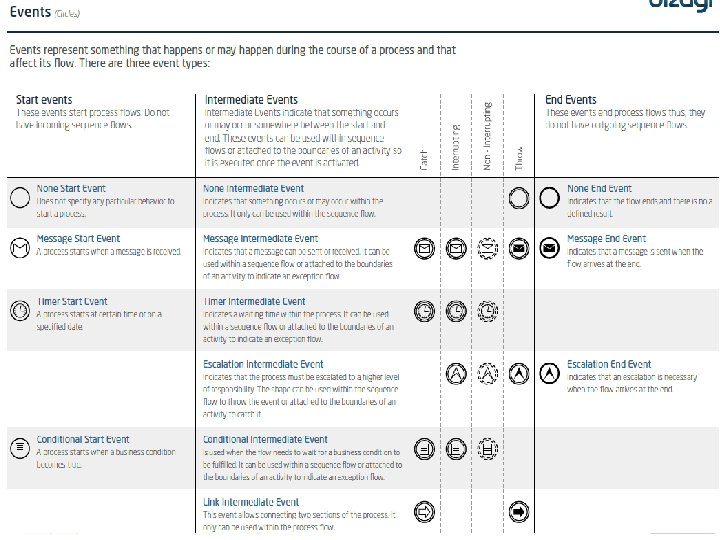
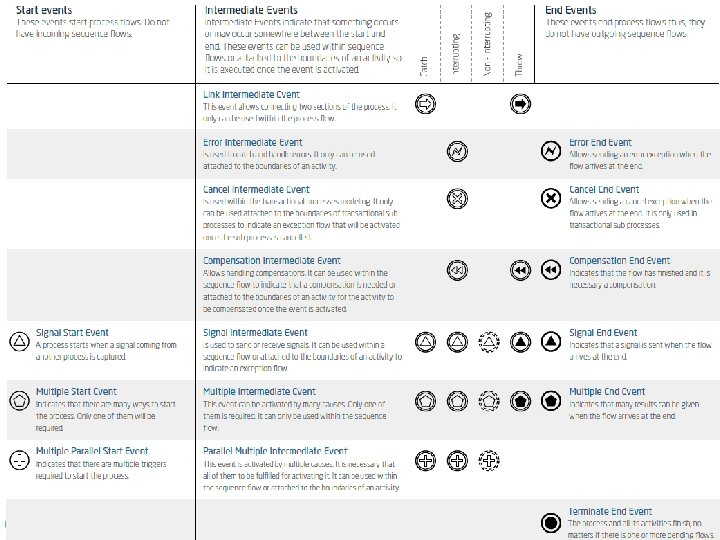
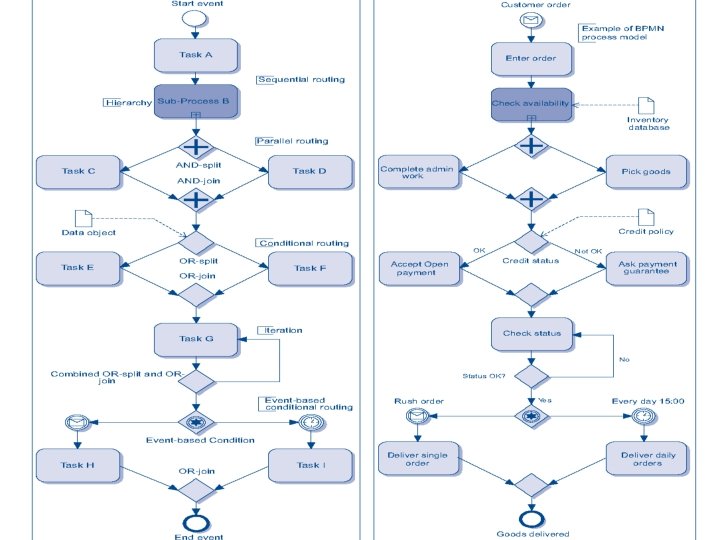
Business Process Modeling: BPMN 86
Credit Application
Purchase Request
Shipment Process of a Hardware Retailer
The Pizza Collaboration
Order Fulfillment and Procurement
Studi Kasus: ATM System 96
Activity Diagram: Memasukkan Kartu
Activity Diagram: Memasukkan PIN
Activity Diagram: Mengecek Saldo
Activity Diagram: Mentransfer Uang
Activity Diagram: Mengambil Uang
Activity Diagram: Melakukan Logout
5. 4. 3 Business Process Realization: Sequence Diagram 103
System Analysis and Design with UML 1. System Analysis 1. Business Process Identification § 2. Use Case Diagram Business Process Modeling § 3. Activity Diagram or Business Process Modeling Notation (BPMN) Business Process Realization § Sequence Diagram (Buat untuk setiap use case dengan menggunakan pola Boundary-Control-Entity) 2. System Design 1. Program Design 1. 2. 3. Class Diagram (Gabungkan Boundary-Control-Entity Class dan susun story dari sistem yang dibangun) Package Diagram (Gabungan class yang sesuai, boleh menggunakan pola B-C-E) Deployment Diagram (arsitektur software dari sistem yang dibangun) User Interface Design (Buat UI design dari Boundary Class) Entity-Relationship Model (Buat ER diagram dari Entity Class)
Sequence Diagrams • Illustrate the objects that participate in a use case • Show the messages that pass between objects for a particular use-case over time
Sequence Diagram Syntax AN ACTOR AN OBJECT an. Object: a. Class A LIFELINE A FOCUS OF CONTROL A MESSAGE OBJECT DESTRUCTION a. Message() x
Sequence Diagram 1. Susun Sequence Diagram untuk setiap Use Case yang dibuat 2. Mulai dari menarik Actor yang ada di Use Case Diagram, lanjutkan dengan membuat sequence detail dari berjalannya Use Catatan: Objek dari Lifeline di Sequence Diagram akan menjadi kandidat Class
Jenis Class 1. Boundary Class: 1. Class yang berinteraksi dengan aktor langsung (user interface) 2. Form, input, UI ini masuk di sini 2. Control Class: 1. Class yang berhubungan dengan pemrosesan, penghitungan, kalkulasi, komputasi, query, dst 3. Entity Class: 1. Class yang berhubungan dengan data, penyimpanan data/file
Studi Kasus: ATM System 109
Sequence Diagram: Memasukkan Kartu
Sequence Diagram: Memasukkan PIN
Sequence Diagram: Mengecek Saldo
Sequence Diagram: Mentransfer Uang
Sequence Diagram: Mengambil Uang
Sequence Diagram: Melakukan Logout
5. 4. 4 Class Diagram 116
System Analysis and Design with UML 1. System Analysis 1. Business Process Identification § 2. Use Case Diagram Business Process Modeling § 3. Activity Diagram or Business Process Modeling Notation (BPMN) Business Process Realization § Sequence Diagram (Buat untuk setiap use case dengan menggunakan pola Boundary-Control-Entity) 2. System Design 1. Program Design 1. 2. 3. Class Diagram (Gabungkan Boundary-Control-Entity Class dan susun story dari sistem yang dibangun) Package Diagram (Gabungan class yang sesuai, boleh menggunakan pola B-C-E) Deployment Diagram (arsitektur software dari sistem yang dibangun) User Interface Design (Buat UI design dari Boundary Class) Entity-Relationship Model (Buat ER diagram dari Entity Class)
Class Diagram Elements 1. 2. 3. 4. Classes Attributes Operations Relationships 118
Classes • Templates for creating instances or objects • All objects of a class have same structure and behavior, but contain different attributes 1. Concrete: used to create actual objects 2. Abstract: extended to create other classes 119
Attributes • Units of information relevant to the description of the class • Only attributes important to the task should be included • Attributes should be primitive types (integers, strings, doubles, date, time, Boolean, etc. ) 120
Operations (Methods) • Defines the behavior of the class • Action that instances/objects can take • Focus on relevant problem-specific operations (at this point) 121
Relationships • Generalization • • “Is-A” relationship Enables inheritance of attributes & oper's Subclasses and superclasses Principle of substitutability • Subclass be substituted for superclass • Aggregation • “Has-A” relationship • Relates parts to wholes • Uses decomposition • Association • • Relationships that don't fit “Is-A” or “Has-A” Often a weaker form of “Has-A” Miscellaneous relationships between classes Example: • Patient schedules an appointment • So the appointment has a patient • This is weak 122
Example Class Diagram 123
More on Attributes • Derived attributes • /age, for example can be calculated from birth date and current date • Visibility of attributes • +Public: not hidden from any object • #Protected: hidden from all but immediate subclasses • –Private: hidden from all other classes • Default is private 124
More on Operations • Constructor: creates object • Query: see class state • Update: change attribute values • Operations can also be public, protected, or private • Default for operations is public 125
More on Relationships • A primary purpose of class diagrams is to show relationships, or associations, between classes • Class can be related to itself (role) • Use a "+" sign to show it's a role and not the name of a relationship 126
Relationship Multiplicity Exactly one 1 Boss Employee 0. . * Child Boss 1. . * Employee 0. . 1 Spouse Specified range Employee 2. . 4 Vacation Disjoint ranges Employee 1. . 3, 5 Zero or more One or more Zero or one Dept 127 Committee
Class 128
Class with Attribute and Method 129
Class Association 130
Multiplicity 131
Inheritance 132
Interface 133
Class Diagram: Internet Order Project 134
Class Diagram: Sistem ATM 135
5. 4. 5 Deployment Diagram 136
System Analysis and Design with UML 1. System Analysis 1. Business Process Identification § 2. Use Case Diagram Business Process Modeling § 3. Activity Diagram or Business Process Modeling Notation (BPMN) Business Process Realization § Sequence Diagram (Buat untuk setiap use case dengan menggunakan pola Boundary-Control-Entity) 2. System Design 1. Program Design 1. 2. 3. Class Diagram (Gabungkan Boundary-Control-Entity Class dan susun story dari sistem yang dibangun) Package Diagram (Gabungan class yang sesuai, boleh menggunakan pola B-C-E) Deployment Diagram (arsitektur software dari sistem yang dibangun) User Interface Design (Buat UI design dari Boundary Class) Entity-Relationship Model (Buat ER diagram dari Entity Class)
Deployment Diagram • Servers Node • Mainframes, Minis, Micros Artifact • Clients • Input/Output HW used by users • Terminals, PCs, special purpose HW • Network • HW and SW to connect clients to servers • Nodes • • Node with Deployment Artifact Any piece of hardware in the model A computational resource Labeled by its name Stereotype to label the type of node • Artifacts • Piece of the information system, such as software or a database table • Node with Deployed Artifact • Shows artifact placed on a physical node • Good for showing distribution data or software • Communication paths • Links between nodes of the network 138 Communication Path
Diagram Examples 139
Deployment Diagram (3 Tier) 140
5. 4. 6 Data Model 141
System Analysis and Design with UML 1. System Analysis 1. Business Process Identification § 2. Use Case Diagram Business Process Modeling § 3. Activity Diagram or Business Process Modeling Notation (BPMN) Business Process Realization § Sequence Diagram (Buat untuk setiap use case dengan menggunakan pola Boundary-Control-Entity) 2. System Design 1. Program Design 1. 2. 3. Class Diagram (Gabungkan Boundary-Control-Entity Class dan susun story dari sistem yang dibangun) Package Diagram (Gabungan class yang sesuai, boleh menggunakan pola B-C-E) Deployment Diagram (arsitektur software dari sistem yang dibangun) User Interface Design (Buat UI design dari Boundary Class) Entity-Relationship Model (Buat ER diagram dari Entity Class)
Data Model
5. 5 Estimating Project Size with Use Case Points 144
Use Case Points Unadjusted Actor Weighting (UAW) Actor Type Description Weighting Factor Simple External System with well-defined API 1 Average External System using a protocolbased interface, e. g. , HTTP, TCT/IP, SQL 2 Complex Human 3 Unadjusted Use Case Weighting (UUCW) Use-Case Type Description Weighting Factor Simple 1 -3 transactions 5 Average 4 -7 transactions 10 Complex More than 7 transactions 15 Unadjusted Use Case Points (UUCP) = UAW + UUCW 145
Sistem ATM – Use Case Diagram Human = 3 Transaction = ? 146
Sequence Diagram - Mentransfer Uang Transaction = 3 147
Technical Complexity Factors (TCF) Factor Number Description Weight T 1 Distributed system 2. 0 T 2 Response time or throughput performance objectives 1. 0 T 3 End-user online efficiency 1. 0 T 4 Complex internal processing 1. 0 T 5 Reusability of code 1. 0 T 6 Easy to install 0. 5 T 7 Ease of use 0. 5 T 8 Portability 2. 0 T 9 Ease of change 1. 0 TCF = 0. 6 + (0. 01 * TFactor) 148
Environmental Complexity Factors (ECF) Factor Number Description Weight E 1 Familiarity with system development process in use 1. 5 E 2 Application experience 0. 5 E 3 Object-oriented experience 1. 0 E 4 Lead analyst capability 0. 5 E 5 Motivation 1. 0 E 6 Requirements stability 2. 0 E 7 Part time staff -1. 0 E 8 Difficulty of programming language -1. 0 ECF = 1. 4 + (-0. 03 * EFactor) 149
Computing Use Case Points • Adjusted Use Case Points (UCP) = UUCP * TCF * ECF • Effort in Person Hours = UCP * PHM 150
Person Hour Multiplier (PHM) Let F 1 = Number of ECF 1 to ECF 6 that are < 3 Let F 2 = Number of ECF 7 and ECF 8 that are > 3 If F 1 + F 2 <= 2 PHM = 20 Else if F 1 + F 2 = 3 or 4 PHM = 28 Else Scrap the project 151
Use Case Points in Sparx EA 152
153
Example: Sistem ATM UCP PHM PH PM PM TIME (M) = 27 = 20*27 = 540/8/22 = 540/10/25 = 540 = 3. 06 = 2. 16 = 3. 0 * PM 1/3 = 3. 0 * 3. 06 1/3 = 3. 0 * 2. 16 1/3 = 4. 36 = 3. 8 154
Example: Schedule Fase PM M Cost 1 Planning 1 1 10 2 Analysis 2 2 40 3 Design 2 1 20 4 Implementation 6 3 90 5 160 jt 155
Example: Sistem ERP UCP PHM PH PM PM TIME (M) = 662 = 20*662 = 13240/8/22 = 13240/10/26 = 13240 = 75 = 50 = 3. 0 * PM 1/3 = 3. 0 * 75 1/3 = 3. 0 * 50 1/3 = 12. 65 = 11. 05 156
Budget (Custom Software) Pekerjaan Man-Month Budget Total Planning 1 1 5000. 000 10. 000 Analysis 2 1 10. 000 20. 000 Design 2 1 4000. 000 32. 000 Implementation 4 2 3000. 000 24. 000 Training 2 1 4000. 000 8000. 000 94. 000
Budget (Generic Software) Product Total LMS 10. 000 Teleconference 2. 000 Chatting 4. 000 e. Library 20. 000
References 1. Rachel Harrison, Study Guide TOGAF® 9 Foundation 2 nd Edition, The Open Group, 2011 2. Rachel Harrison, Study Guide TOGAF® 9 Certified 2 nd Edition, The Open Group, 2011 3. Open Group Standard, TOGAF® Version 9. 1 (G 116), The Open Group, 2011 4. Open Group Standard, TOGAF® Version 9. 1 – A Pocket Guide (G 117), The Open Group, 2011 5. Daniel Minoli, Enterprise Architecture A to Z: Frameworks, Business Process Modeling, SOA, and Infrastructure Technology, Taylor & Francis, 2008 6. Jon Holt and Simon Perry, Modelling Enterprise Architectures, The Institution of Engineering and Technology, 2010 7. Alan Dennis et al, Systems Analysis and Design with UML 4 th Edition, John Wiley and Sons, 2013 159