GIS at PSRC GIS data collection travel demand


- Slides: 42
GIS at PSRC GIS data collection & travel demand modeling ESRM 250 February 4, 2010
GIS at PSRC Presentation Overview • How I got into GIS • PSRC Background • Geodatabase • Traffic Counts • Vehicle Speeds • Representation 2
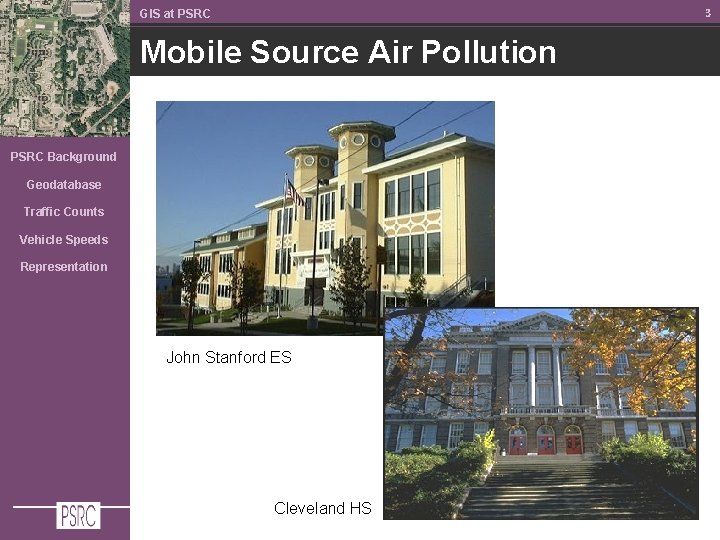
3 GIS at PSRC Mobile Source Air Pollution PSRC Background Geodatabase Traffic Counts Vehicle Speeds Representation John Stanford ES Cleveland HS
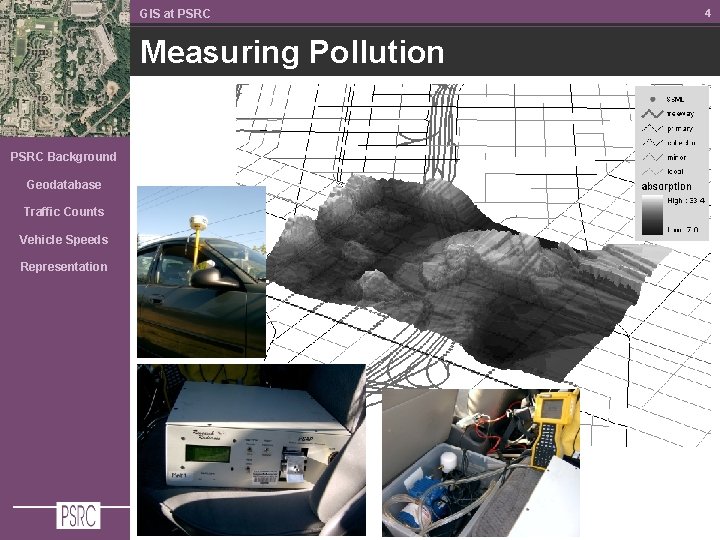
GIS at PSRC Measuring Pollution PSRC Background Geodatabase Traffic Counts Vehicle Speeds Representation 4
Background
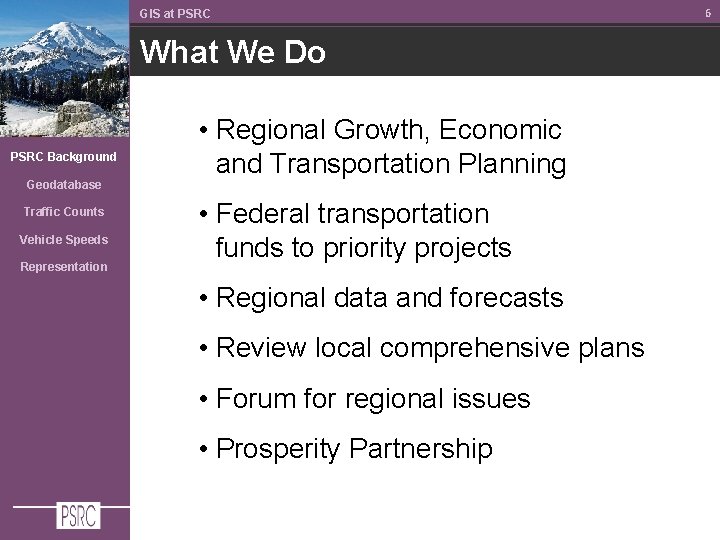
GIS at PSRC What We Do PSRC Background Geodatabase Traffic Counts Vehicle Speeds Representation • Regional Growth, Economic and Transportation Planning • Federal transportation funds to priority projects • Regional data and forecasts • Review local comprehensive plans • Forum for regional issues • Prosperity Partnership 6
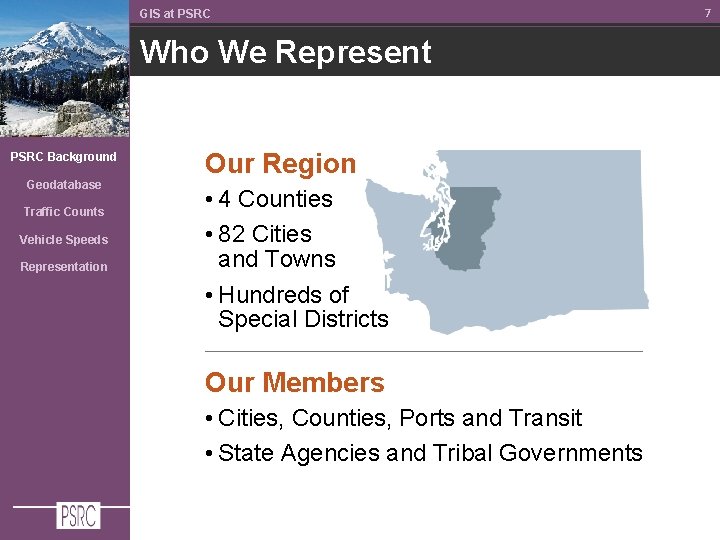
GIS at PSRC Who We Represent PSRC Background Geodatabase Traffic Counts Vehicle Speeds Representation Our Region • 4 Counties • 82 Cities and Towns • Hundreds of Special Districts Our Members • Cities, Counties, Ports and Transit • State Agencies and Tribal Governments 7
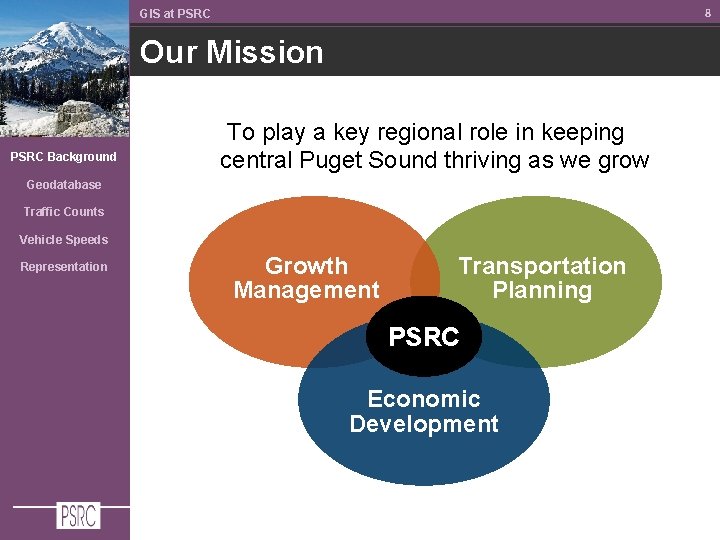
8 GIS at PSRC Our Mission PSRC Background To play a key regional role in keeping central Puget Sound thriving as we grow Geodatabase Traffic Counts Vehicle Speeds Representation Growth Management Transportation Planning PSRC Economic Development
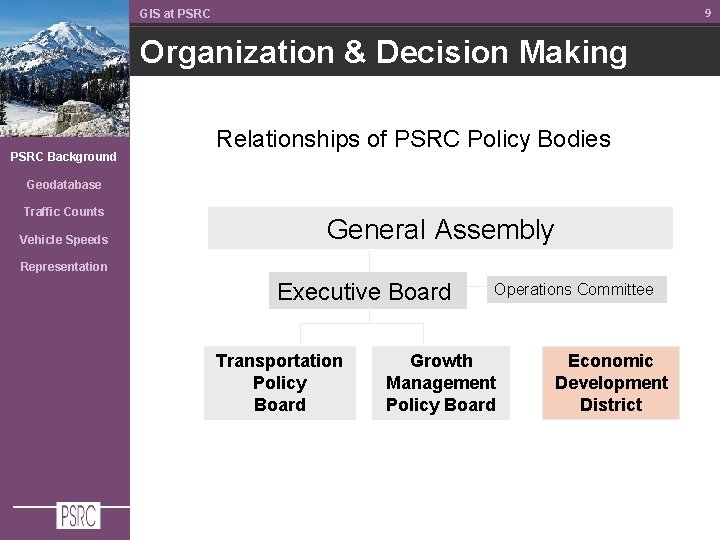
9 GIS at PSRC Organization & Decision Making PSRC Background Relationships of PSRC Policy Bodies Geodatabase Traffic Counts Vehicle Speeds General Assembly Representation Executive Board Transportation Policy Board Operations Committee Growth Management Policy Board Economic Development District
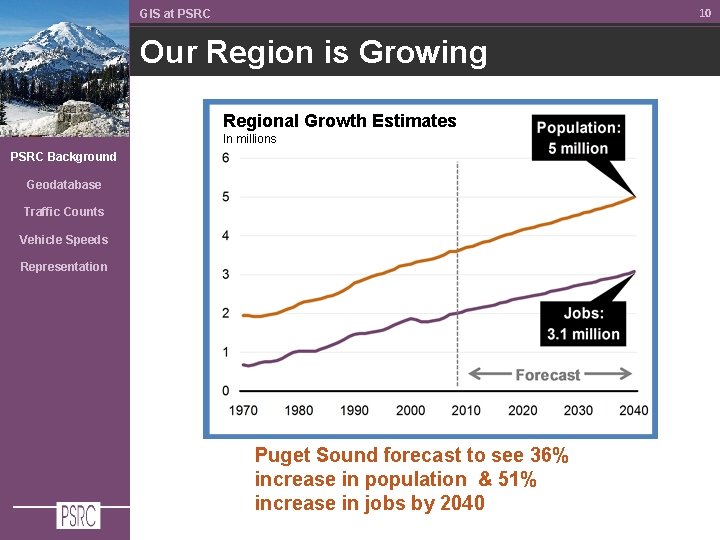
10 GIS at PSRC Our Region is Growing Regional Growth Estimates In millions PSRC Background Geodatabase Traffic Counts Vehicle Speeds Representation Puget Sound forecast to see 36% increase in population & 51% increase in jobs by 2040
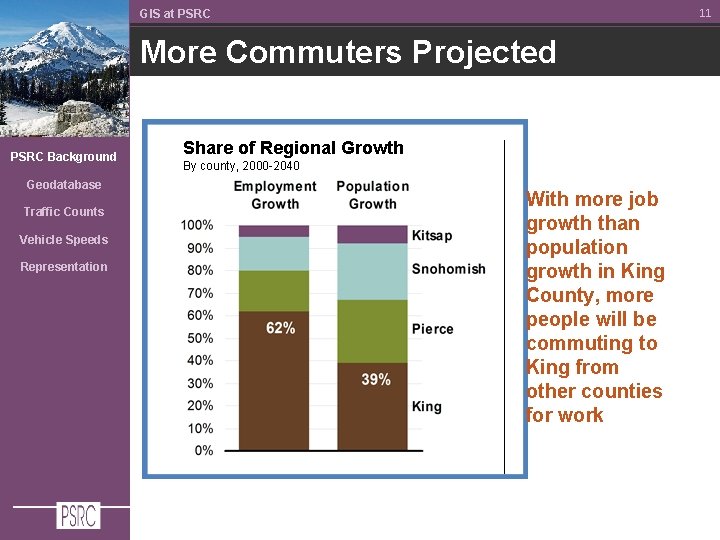
11 GIS at PSRC More Commuters Projected PSRC Background Geodatabase Traffic Counts Vehicle Speeds Representation Share of Regional Growth By county, 2000 -2040 With more job growth than population growth in King County, more people will be commuting to King from other counties for work
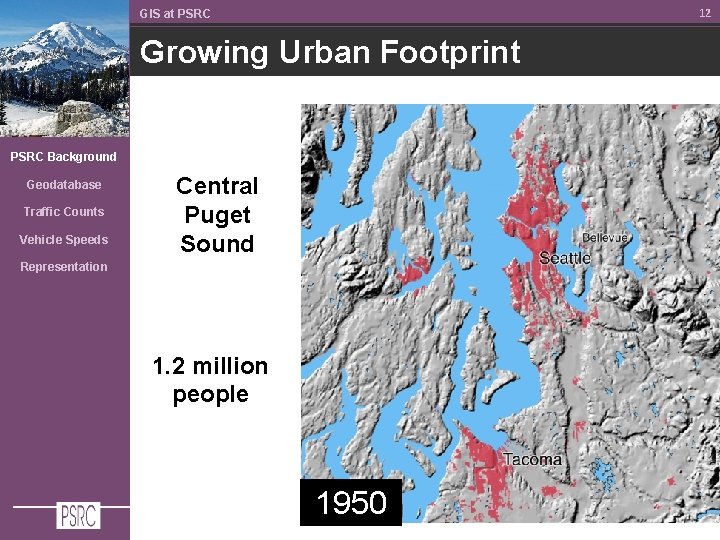
12 GIS at PSRC Growing Urban Footprint PSRC Background Geodatabase Traffic Counts Vehicle Speeds Central Puget Sound Representation 1. 2 million people 1950
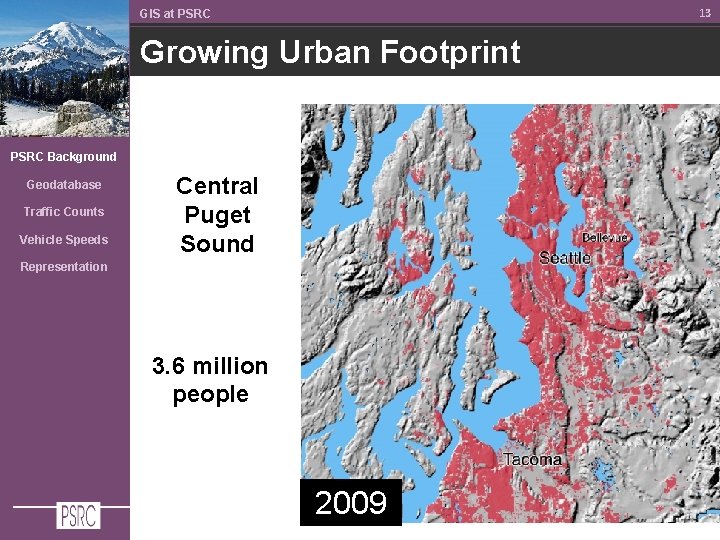
13 GIS at PSRC Growing Urban Footprint PSRC Background Geodatabase Traffic Counts Vehicle Speeds Central Puget Sound Representation 3. 6 million people 2009
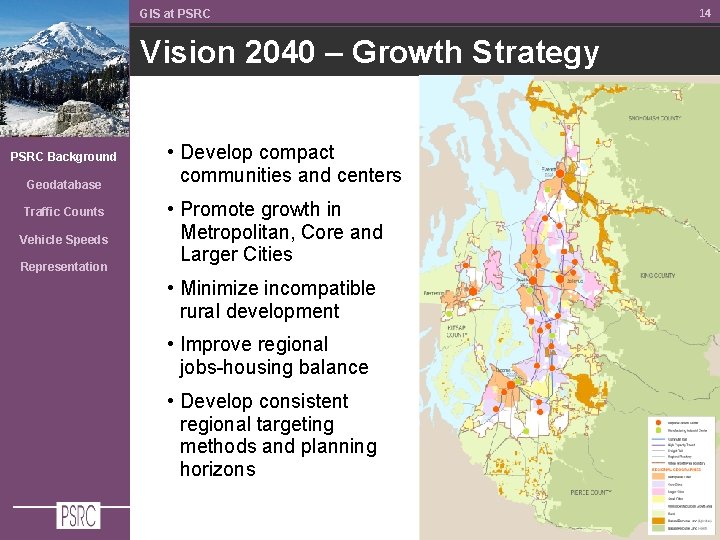
GIS at PSRC Vision 2040 – Growth Strategy PSRC Background Geodatabase Traffic Counts Vehicle Speeds Representation • Develop compact communities and centers • Promote growth in Metropolitan, Core and Larger Cities • Minimize incompatible rural development • Improve regional jobs-housing balance • Develop consistent regional targeting methods and planning horizons 14
15 GIS at PSRC Funding Program PSRC Background Geodatabase Traffic Counts Federal funds flow from the Highway Trust Fund to each state by formulas Vehicle Speeds Representation PSRC distributes $160 million annually to projects in the region’s long-range transportation plan
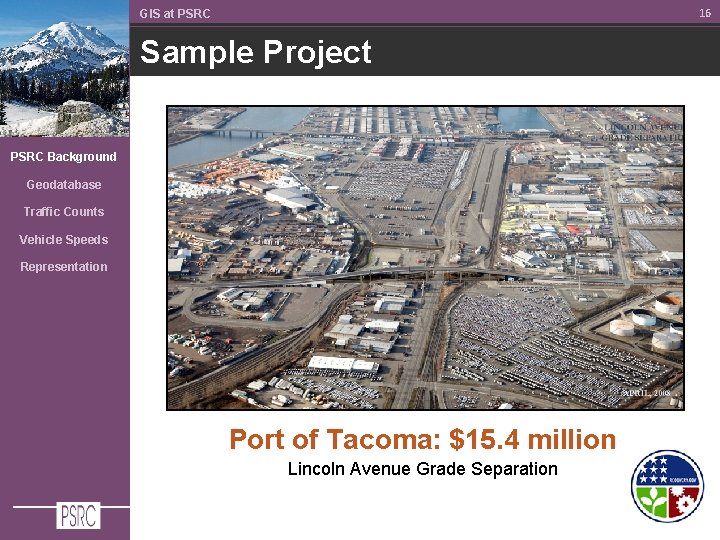
16 GIS at PSRC Sample Project PSRC Background Geodatabase Traffic Counts Vehicle Speeds Representation Port of Tacoma: $15. 4 million Lincoln Avenue Grade Separation
Geodatabase
GIS at PSRC Geodatabase Development PSRC Background Geodatabase Traffic Counts Vehicle Speeds • Attempt to anticipate future travel demand other model needs (activity based, additional network detail network flexibility, etc). Representation • Data structure on which to support PSRC planning and geospatial analysis business needs • Implement planned transportation projects as spatial features 18
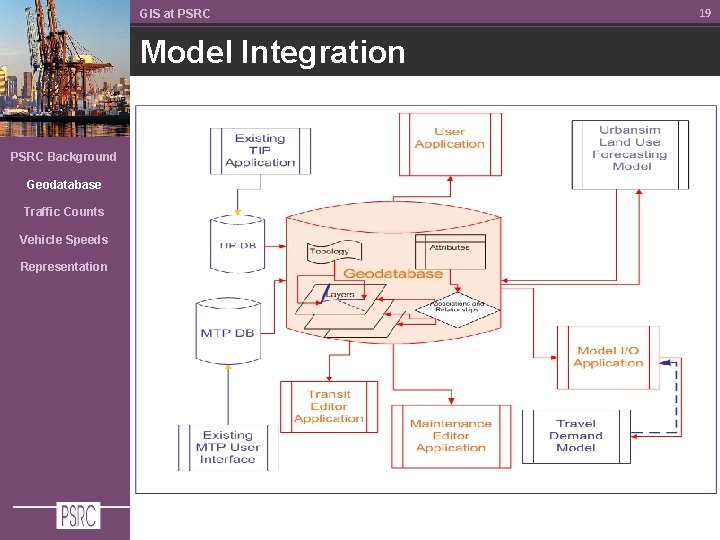
GIS at PSRC Model Integration PSRC Background Geodatabase Traffic Counts Vehicle Speeds Representation 19
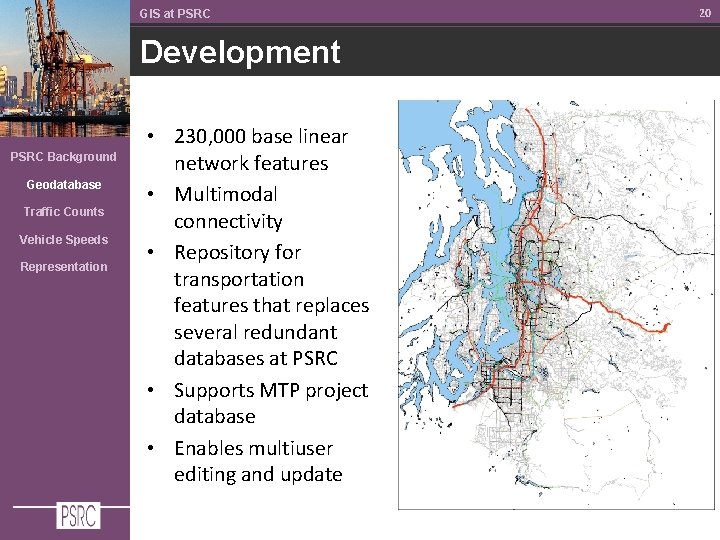
GIS at PSRC Development PSRC Background Geodatabase Traffic Counts Vehicle Speeds Representation • 230, 000 base linear network features • Multimodal connectivity • Repository for transportation features that replaces several redundant databases at PSRC • Supports MTP project database • Enables multiuser editing and update 20
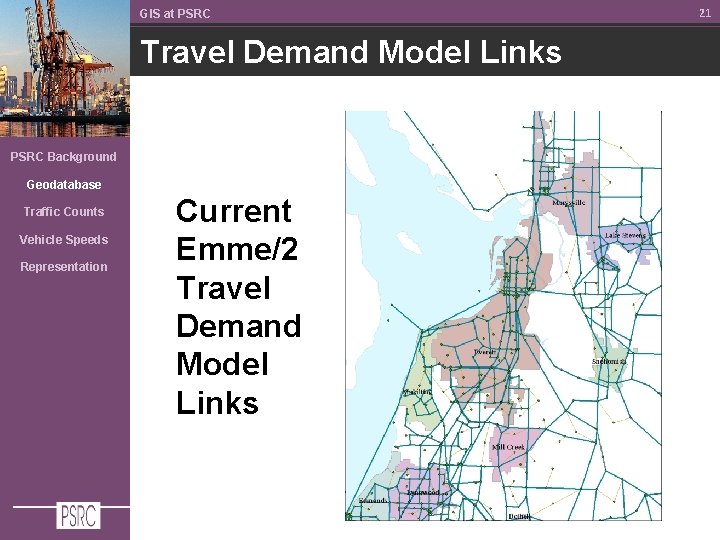
GIS at PSRC Travel Demand Model Links PSRC Background Geodatabase Traffic Counts Vehicle Speeds Representation Current Emme/2 Travel Demand Model Links 21
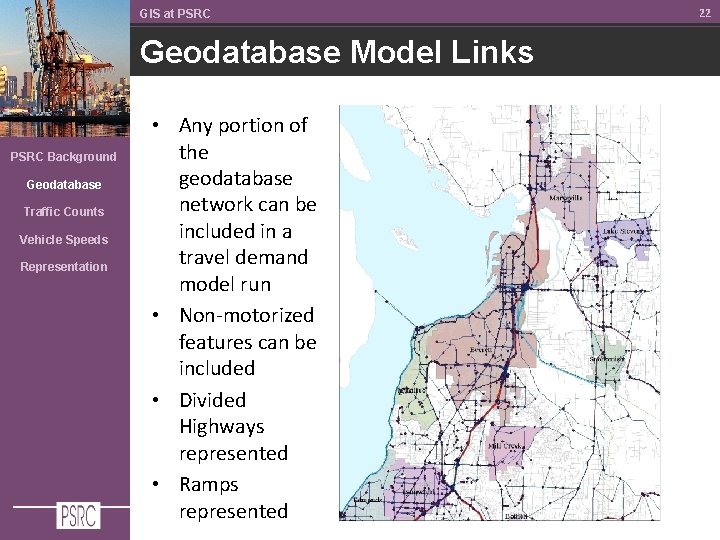
GIS at PSRC Geodatabase Model Links PSRC Background Geodatabase Traffic Counts Vehicle Speeds Representation • Any portion of the geodatabase network can be included in a travel demand model run • Non-motorized features can be included • Divided Highways represented • Ramps represented 22
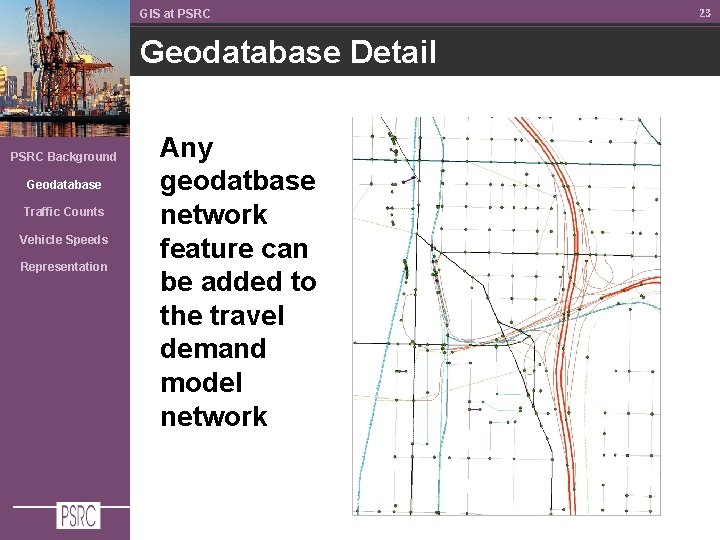
GIS at PSRC Geodatabase Detail PSRC Background Geodatabase Traffic Counts Vehicle Speeds Representation Any geodatbase network feature can be added to the travel demand model network 23
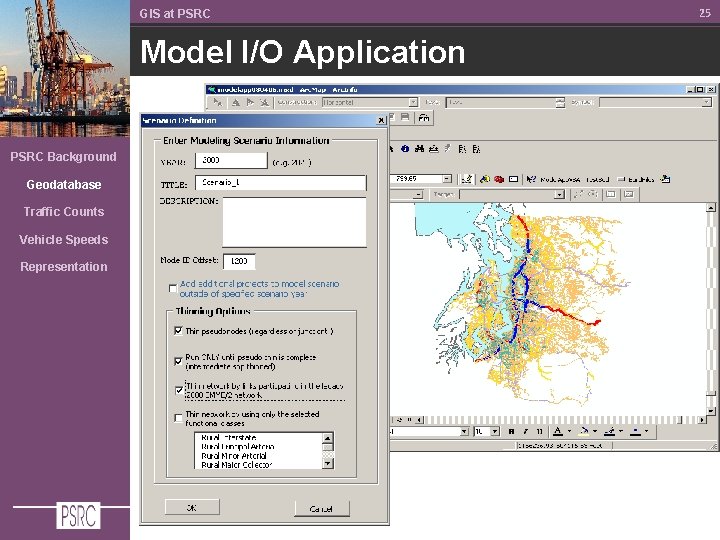
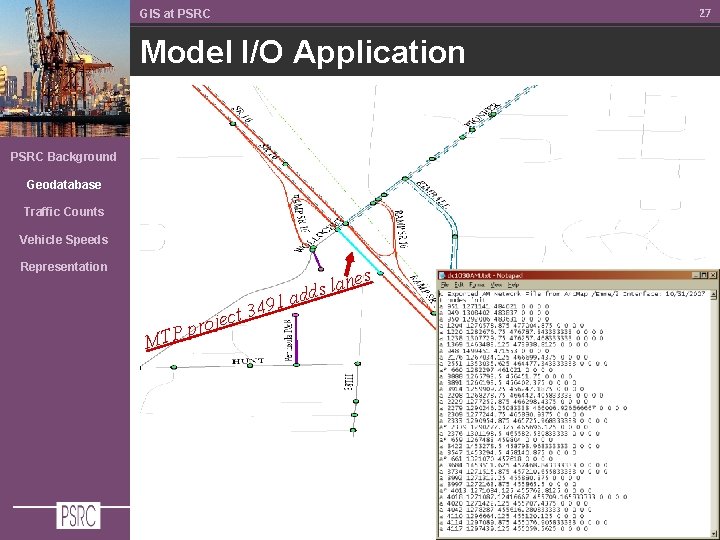
GIS at PSRC Integration Model I/O Application PSRC Background Geodatabase • ‘Tailors’ the model network, enables choice of links Traffic Counts Vehicle Speeds Representation • Generalizes and streamlines model network • Enables ‘Scenarios’ of MTP projects for Transportation 2040 alternative modeling 24
GIS at PSRC Model I/O Application PSRC Background Geodatabase Traffic Counts Vehicle Speeds Representation 25
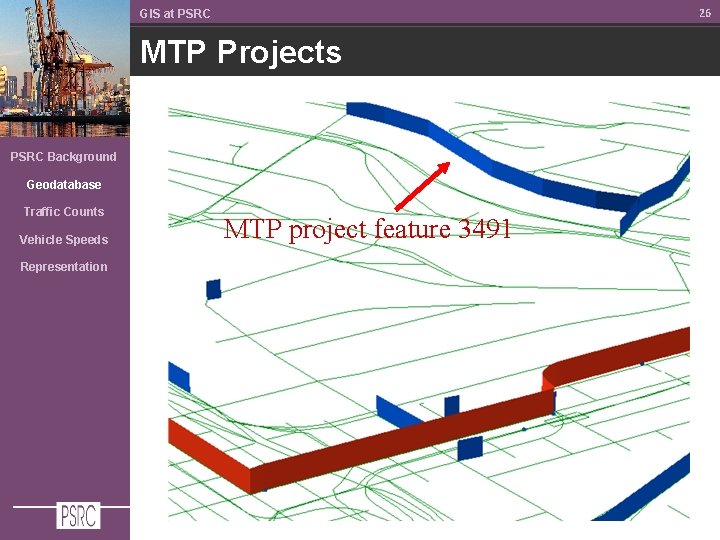
26 GIS at PSRC MTP Projects PSRC Background Geodatabase Traffic Counts Vehicle Speeds Representation MTP project feature 3491
27 GIS at PSRC Model I/O Application PSRC Background Geodatabase Traffic Counts Vehicle Speeds Representation es n a l dds pr P T M o 1 a 9 4 3 ject
Traffic Counts
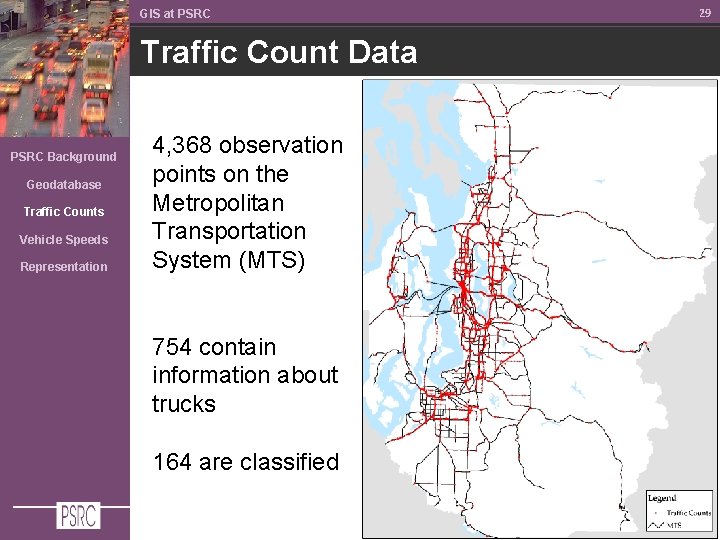
GIS at PSRC Traffic Count Data PSRC Background Geodatabase Traffic Counts Vehicle Speeds Representation 4, 368 observation points on the Metropolitan Transportation System (MTS) 754 contain information about trucks 164 are classified 29
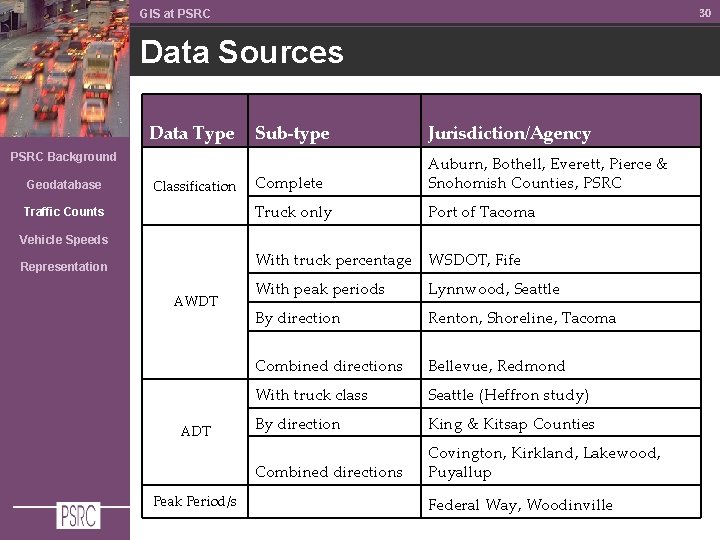
30 GIS at PSRC Data Sources Data Type Sub-type Jurisdiction/Agency Complete Auburn, Bothell, Everett, Pierce & Snohomish Counties, PSRC Truck only Port of Tacoma PSRC Background Geodatabase Classification Traffic Counts Vehicle Speeds With truck percentage WSDOT, Fife Representation AWDT ADT Peak Period/s With peak periods Lynnwood, Seattle By direction Renton, Shoreline, Tacoma Combined directions Bellevue, Redmond With truck class Seattle (Heffron study) By direction King & Kitsap Counties Combined directions Covington, Kirkland, Lakewood, Puyallup Federal Way, Woodinville
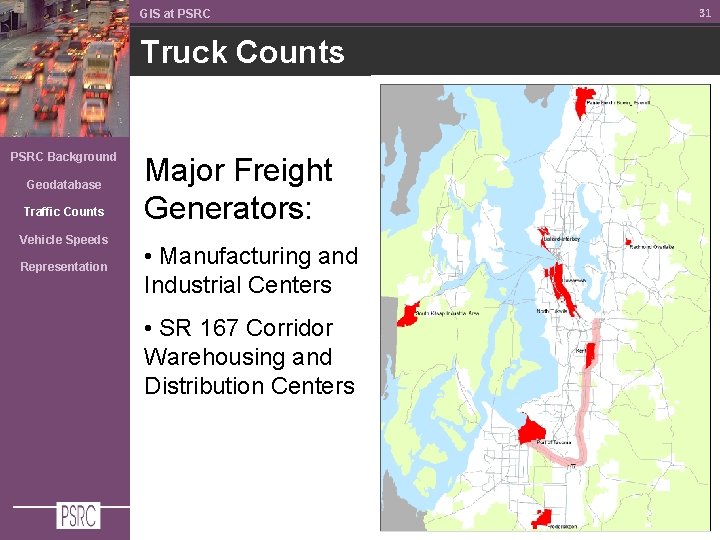
GIS at PSRC Truck Counts PSRC Background Geodatabase Traffic Counts Vehicle Speeds Representation Major Freight Generators: • Manufacturing and Industrial Centers • SR 167 Corridor Warehousing and Distribution Centers 31
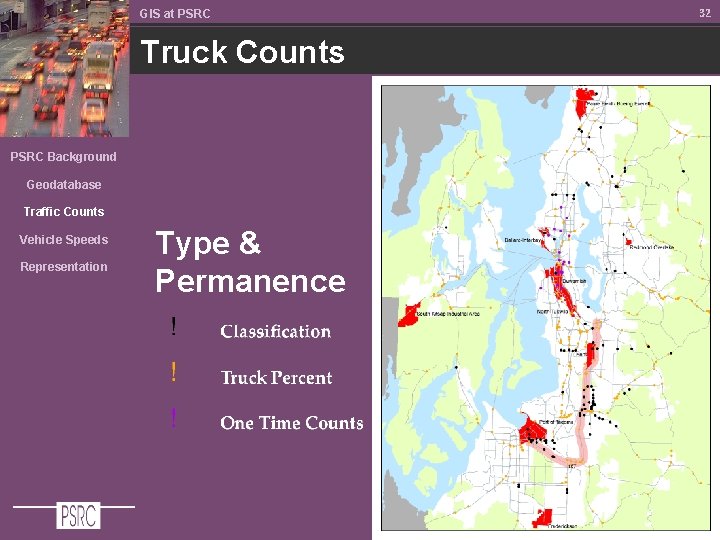
GIS at PSRC Truck Counts PSRC Background Geodatabase Traffic Counts Vehicle Speeds Representation Type & Permanence 32
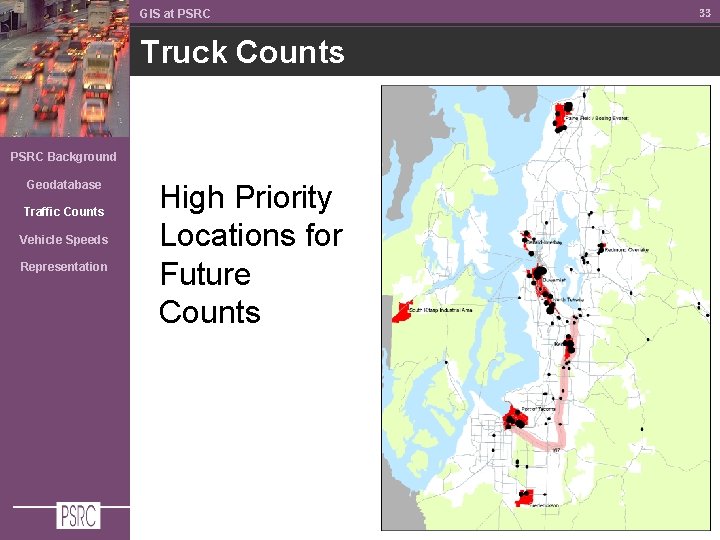
GIS at PSRC Truck Counts PSRC Background Geodatabase Traffic Counts Vehicle Speeds Representation High Priority Locations for Future Counts 33
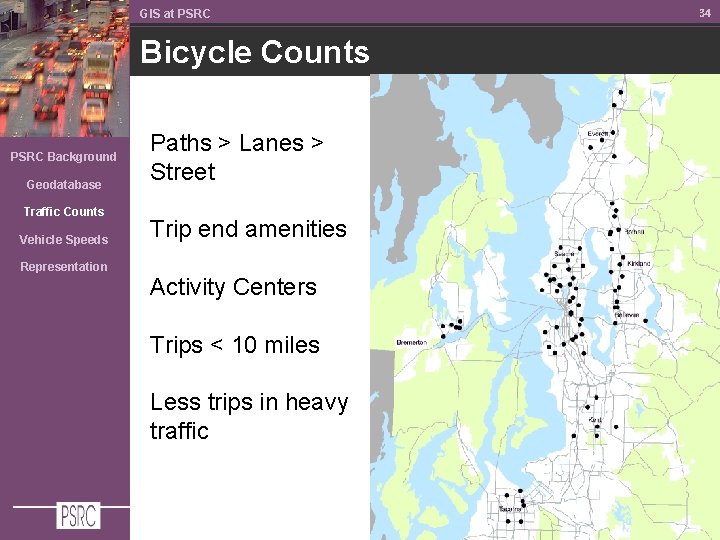
GIS at PSRC Bicycle Counts PSRC Background Geodatabase Traffic Counts Vehicle Speeds Representation Paths > Lanes > Street Trip end amenities Activity Centers Trips < 10 miles Less trips in heavy traffic 34
Vehicle Speeds
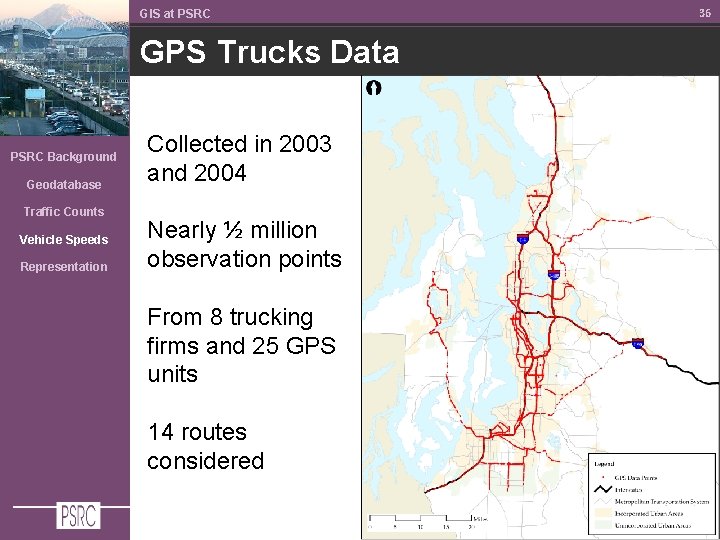
GIS at PSRC GPS Trucks Data PSRC Background Geodatabase Traffic Counts Vehicle Speeds Representation Collected in 2003 and 2004 Nearly ½ million observation points From 8 trucking firms and 25 GPS units 14 routes considered 36
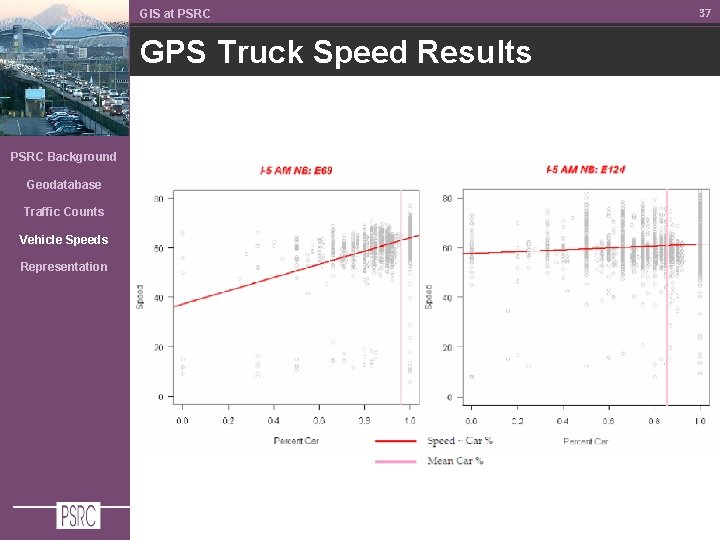
GIS at PSRC GPS Truck Speed Results PSRC Background Geodatabase Traffic Counts Vehicle Speeds Representation 37
Representation
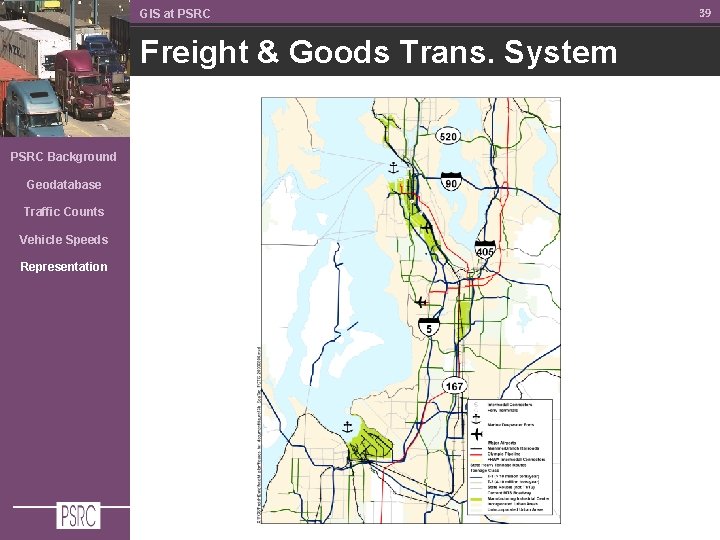
GIS at PSRC Freight & Goods Trans. System PSRC Background Geodatabase Traffic Counts Vehicle Speeds Representation 39
GIS at PSRC Military Goods System PSRC Background Geodatabase Traffic Counts Vehicle Speeds Representation 40
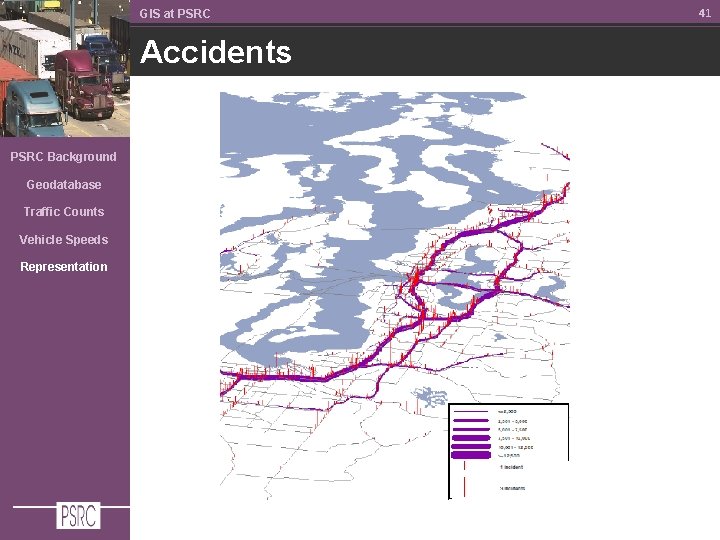
GIS at PSRC Accidents PSRC Background Geodatabase Traffic Counts Vehicle Speeds Representation 41
Questions? Alon Bassok abassok@psrc. org 206. 464. 7091