THE NATURE OF DATACENTER MEASUREMENTS ANALYSIS Srikanth Kandula

- Slides: 42
THE NATURE OF DATACENTER: MEASUREMENTS & ANALYSIS Srikanth Kandula, Sudipta Sengupta, Albert Greenberg, Parveen Patel, Ronnie Chaiken Microsoft Research IMC November, 2009 Abhishek Ray raya@cs. ucr. edu
Outline Introduction Data & Methodology Application Traffic Characteristics Tomography Conclusion
Introduction Analysis and mining of data sets Processing around some petabytes of data This paper has tried to describe characteristics of traffic Detailed view of traffic Congestion conditions and patterns
Contribution Measurement Instrumentation Measures traffic at data centers rather than switches Traffic characteristics Flow, congestion and rate of change of traffic mix. Tomography Inference Accuracy Performs Ø Clusters =1500 servers Ø Rack = 20 2 months
Data & Methodology ISPs SNMP Counters Sampled Flow Deep packet Inspection Data Center Measurements at Servers, Storage and network Linkage of network traffic with application level logs
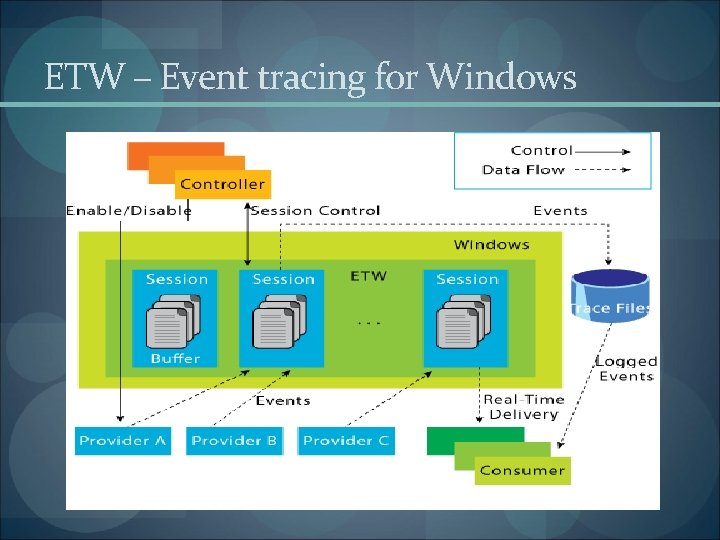
Socket level events at each servers ETW – Event Tracing for Windows One per application read or write Aggregates over several packets http: //msdn. microsoft. com/en-us/magazine/cc 163437. aspx#S 1
ETW – Event tracing for Windows
Application Workload SQL Programming language like Scope 3 phases of different types Extract Partition Aggregate Combine Short interactive programs to long running programs
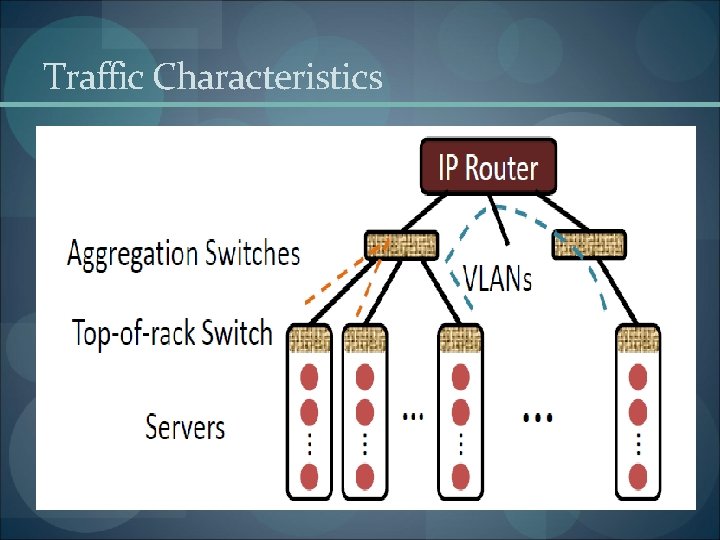
Traffic Characteristics
Patterns
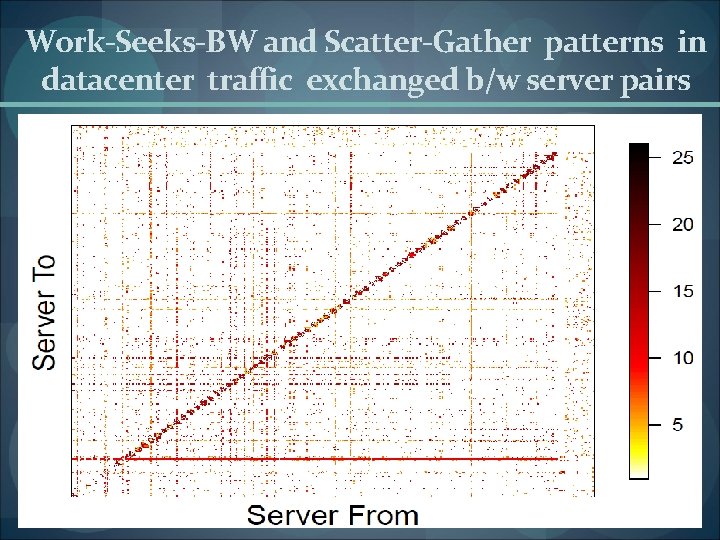
Work-Seeks-BW and Scatter-Gather patterns in datacenter traffic exchanged b/w server pairs
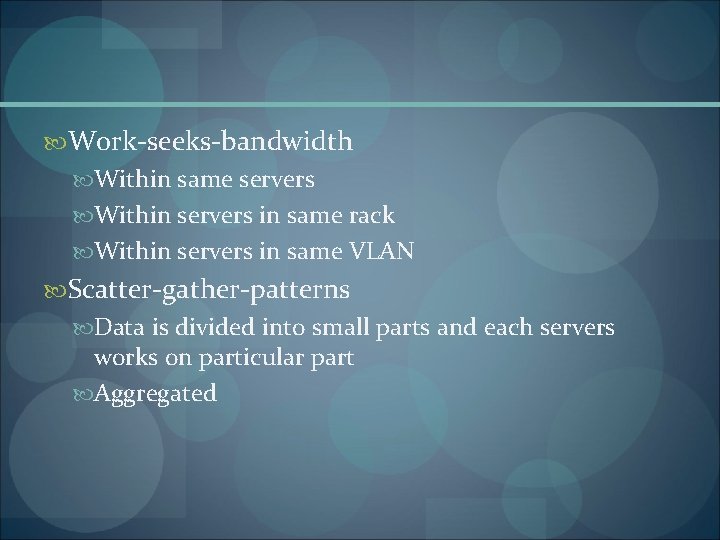
Work-seeks-bandwidth Within same servers Within servers in same rack Within servers in same VLAN Scatter-gather-patterns Data is divided into small parts and each servers works on particular part Aggregated
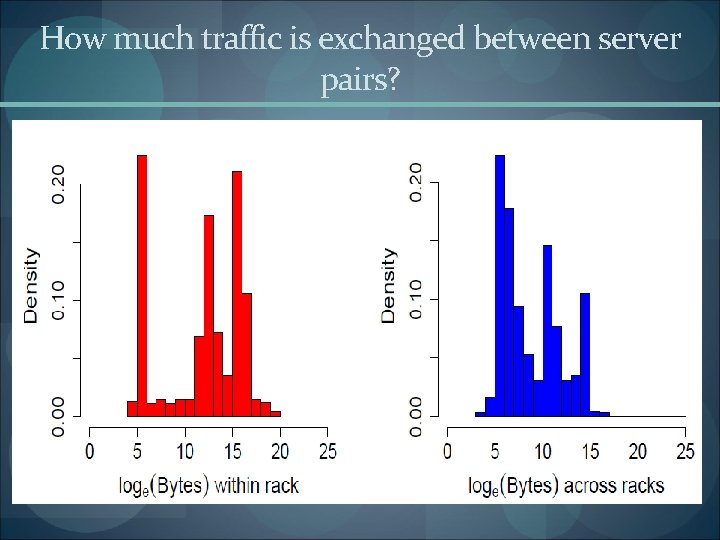
How much traffic is exchanged between server pairs?
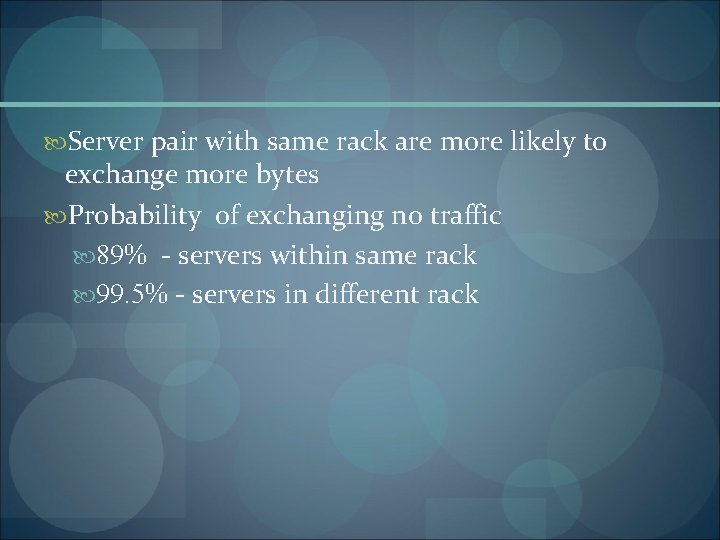
Server pair with same rack are more likely to exchange more bytes Probability of exchanging no traffic 89% - servers within same rack 99. 5% - servers in different rack
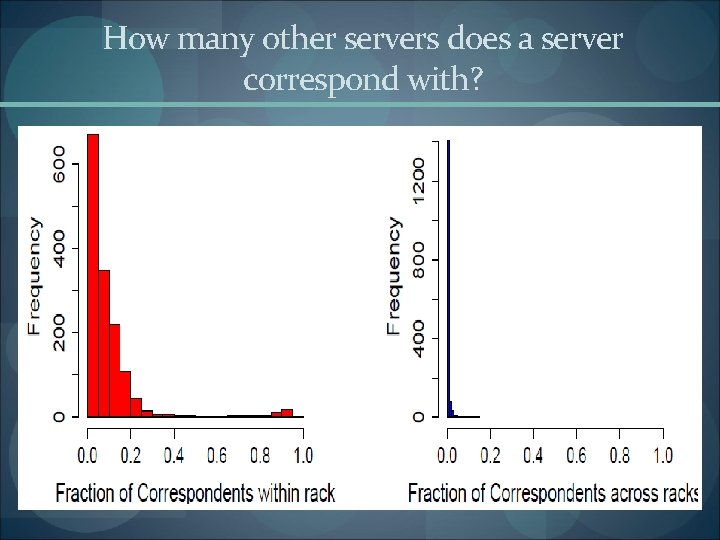
How many other servers does a server correspond with?
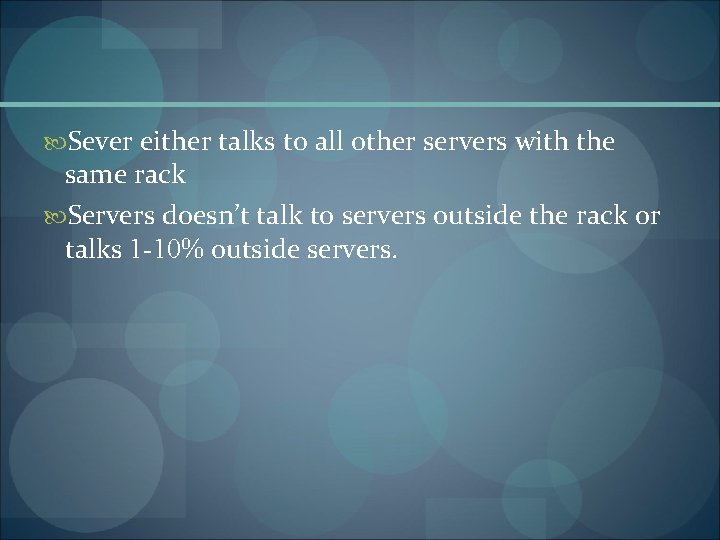
Sever either talks to all other servers with the same rack Servers doesn’t talk to servers outside the rack or talks 1 -10% outside servers.
Congestion within the Datacenter
N/W at as high an utilization as possible without adversely affecting throughput Low network utilization indicate Application by nature demands more of other resources such as CPU and disk than the network Applications can be re-written to make better use of available network bandwidth
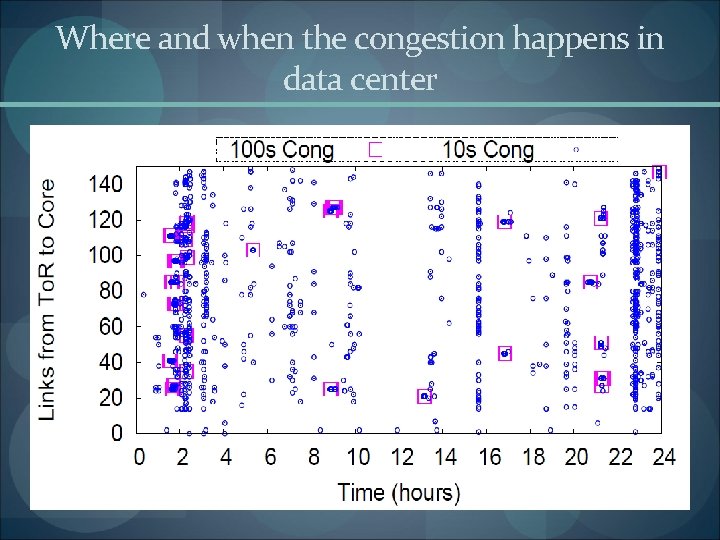
Where and when the congestion happens in data center
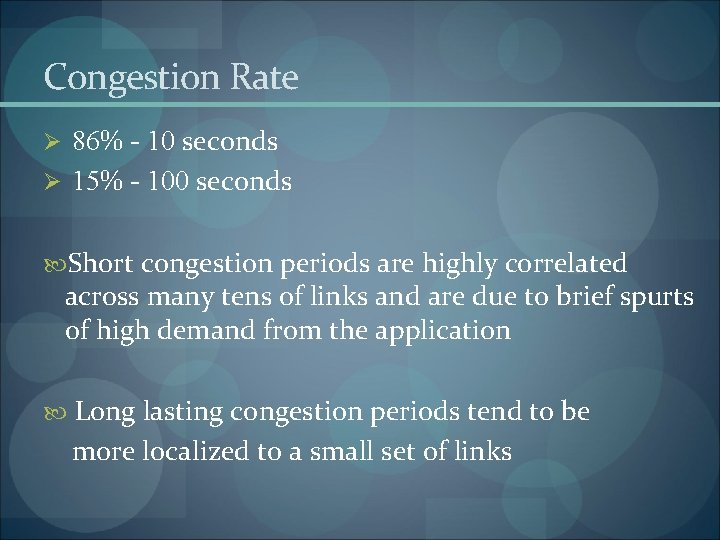
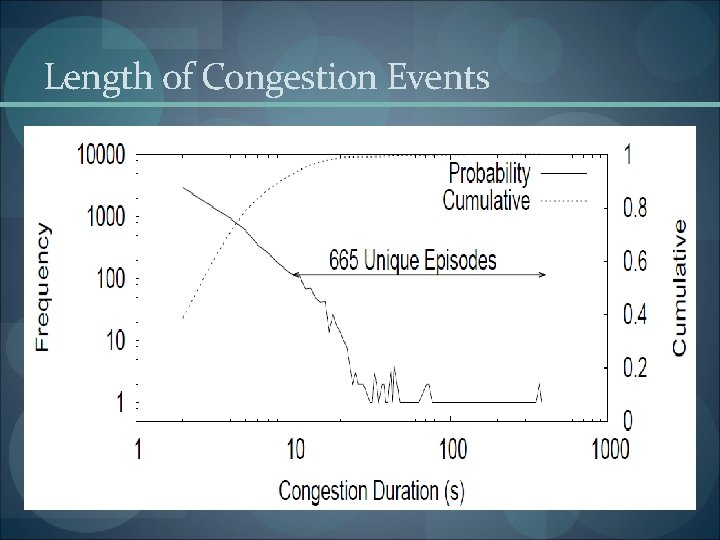
Congestion Rate Ø 86% - 10 seconds Ø 15% - 100 seconds Short congestion periods are highly correlated across many tens of links and are due to brief spurts of high demand from the application Long lasting congestion periods tend to be more localized to a small set of links
Length of Congestion Events
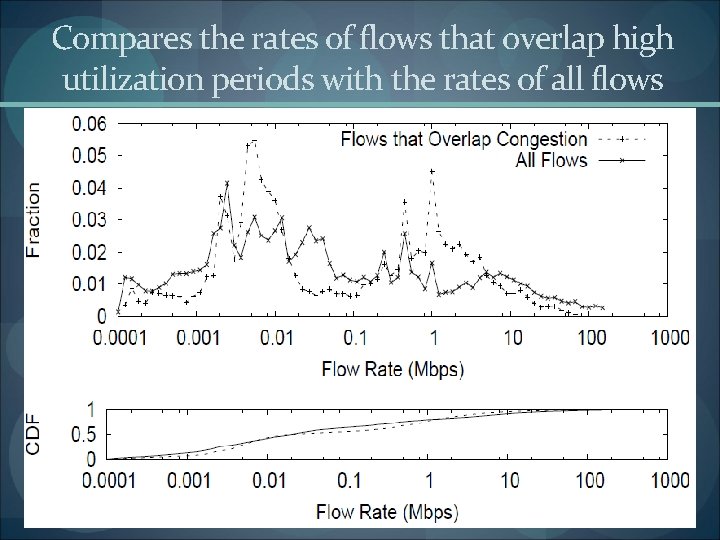
Compares the rates of flows that overlap high utilization periods with the rates of all flows
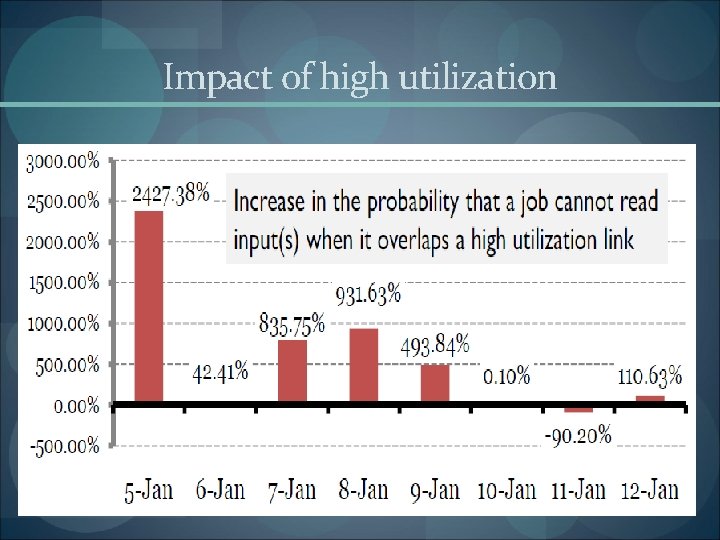
Impact of high utilization
Read failure - Job is killed Congestion To attribute network traffic to the applications that generate it, they merge the network event logs with logs at the application-level that describe which job and phase were active at that time
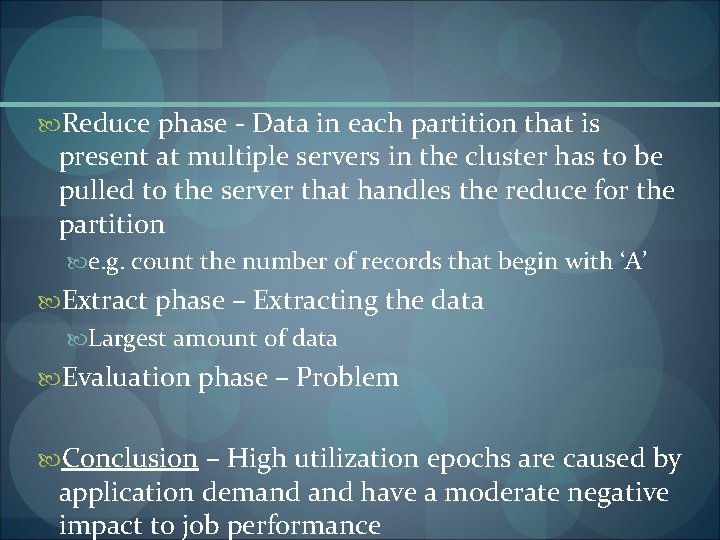
Reduce phase - Data in each partition that is present at multiple servers in the cluster has to be pulled to the server that handles the reduce for the partition e. g. count the number of records that begin with ‘A’ Extract phase – Extracting the data Largest amount of data Evaluation phase – Problem Conclusion – High utilization epochs are caused by application demand have a moderate negative impact to job performance
Flow Characteristics
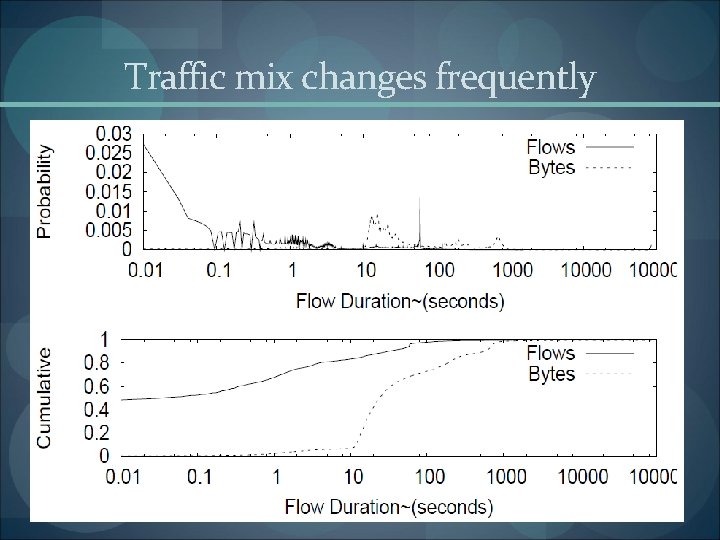
Traffic mix changes frequently
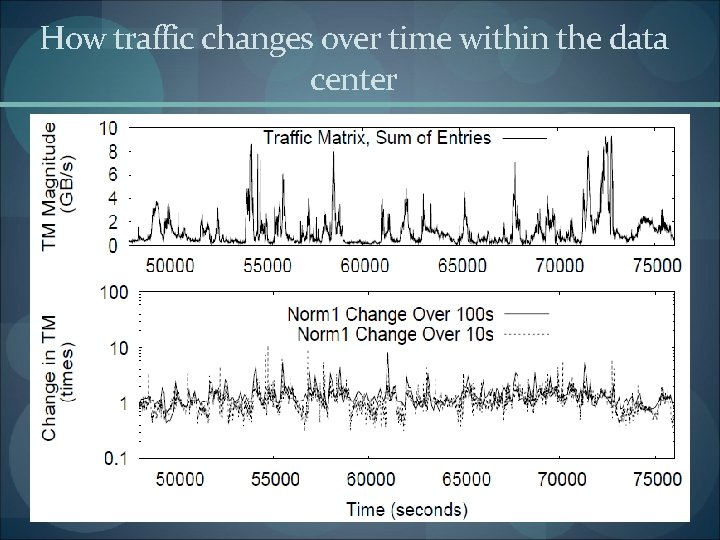
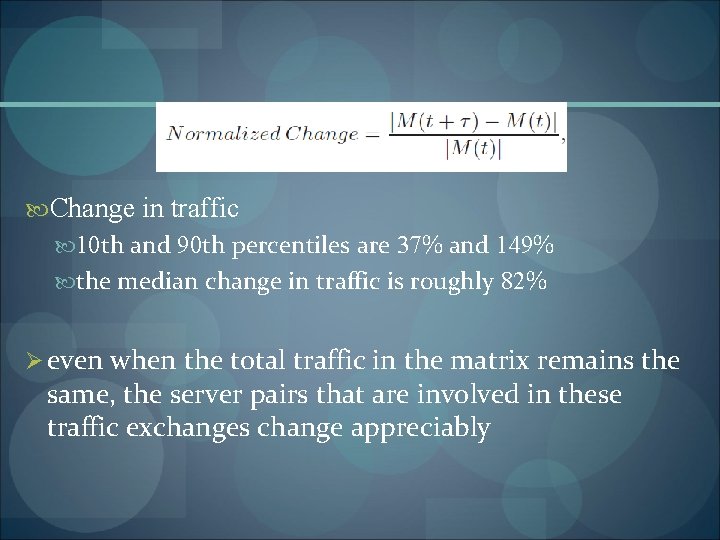
How traffic changes over time within the data center
Change in traffic 10 th and 90 th percentiles are 37% and 149% the median change in traffic is roughly 82% Ø even when the total traffic in the matrix remains the same, the server pairs that are involved in these traffic exchanges change appreciably
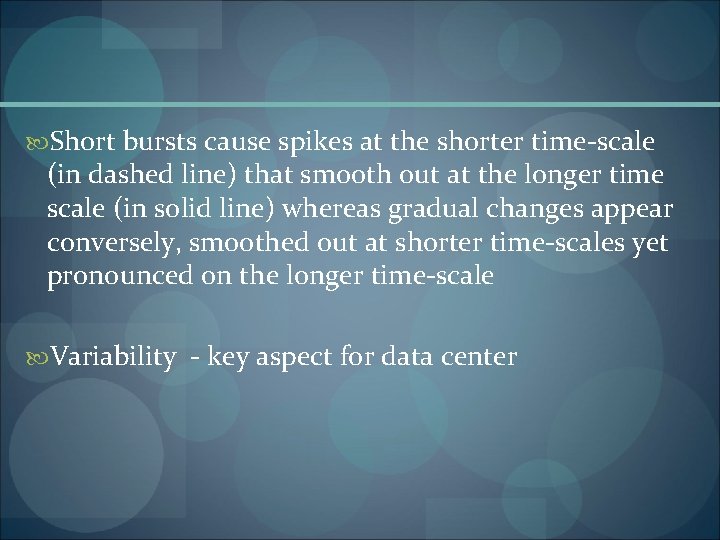
Short bursts cause spikes at the shorter time-scale (in dashed line) that smooth out at the longer time scale (in solid line) whereas gradual changes appear conversely, smoothed out at shorter time-scales yet pronounced on the longer time-scale Variability - key aspect for data center
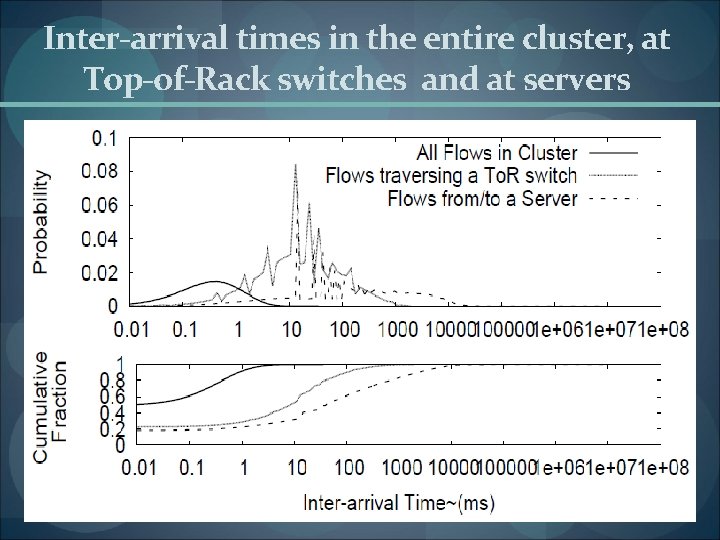
Inter-arrival times in the entire cluster, at Top-of-Rack switches and at servers
Inter-arrivals at both servers and top-of-rack switches have spaced apart by roughly 15 ms This is likely due to the stop-and-go behavior of the application that rate-limits the creation of new flows Ø Median arrival rate of all flows in the cluster is 105 flows per second or 100 flows in every millisecond
Tomography N/W tomography methods to infer traffic matrices If the methods used in ISP n/w is applicable to datacenters, it would help to unravel the nature of traffic Why? Data flow volume is quadratic n(n - 1) – no. of links measurements are fewer Assumptions - Gravity model - Amount of traffic a node (origin) would send to another node (destination) is proportional to the traffic volume received by the destination Scalability
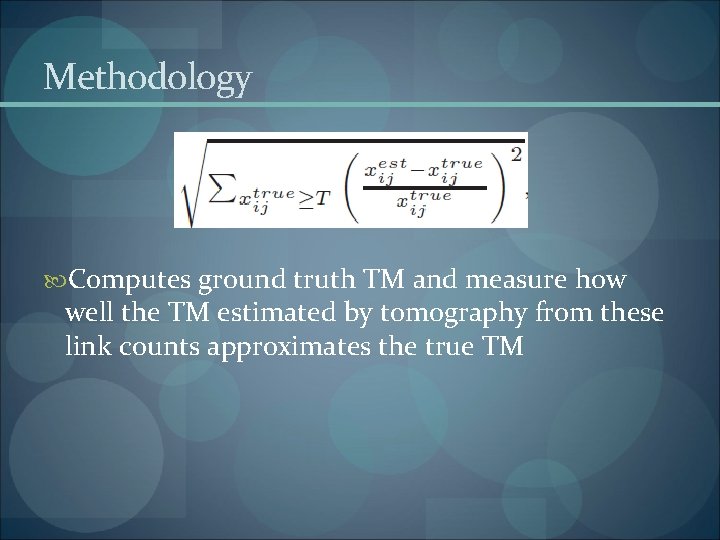
Methodology Computes ground truth TM and measure how well the TM estimated by tomography from these link counts approximates the true TM
Tomogravity and Spare Maximization
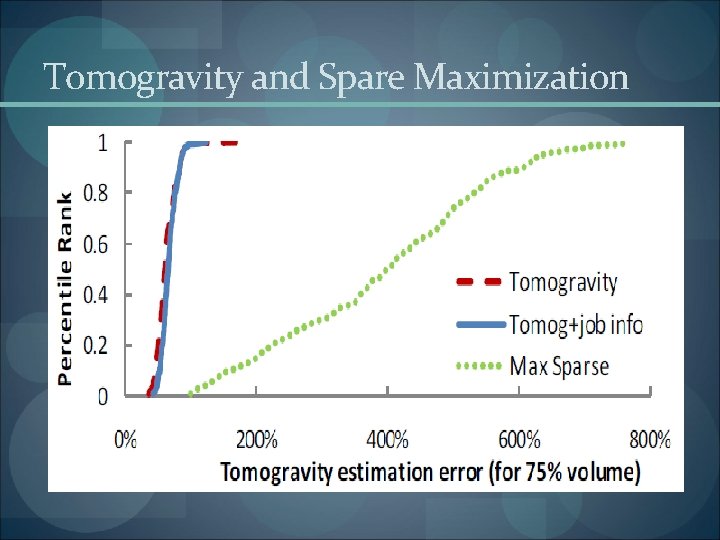
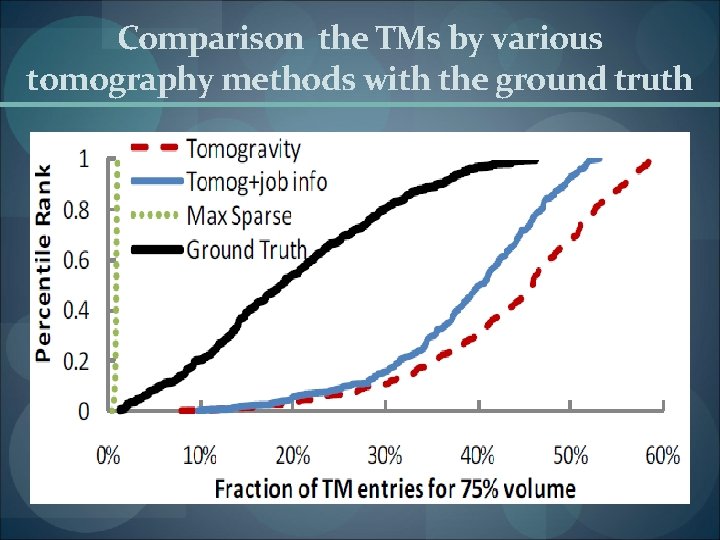
Tomogravity - Communication likely to be B/W nodes with same job rather than all nodes, whereas gravity model, not being aware of these job-clusters, introduces traffic across clusters, resulting in many non-zero TM entries Spare maximization – Error rate starts from several hundreds
Comparison the TMs by various tomography methods with the ground truth
Ground TMs are sparser than tomogravity estimated TMs, and denser than sparsity maximized estimated TMs
Conclusion Capture both Macroscopic patterns – which servers talk to which others, when and for what reasons Microscopic characteristics – flow durations, interarrival times Tighter coupling between network, computing, and storage in datacenter applications Congestion and negative application impact do occur, demanding improvement - better understanding of traffic and mechanisms that steer demand
My Take More data should be examined over a period of 1 year instead of 2 months I would certainly like to see some mining of data and application running at datacenters of companies like Google, Yahoo etc
Related Work T. Benson, A. Anand, A. Akella, and. M. Zhang: Understanding Datacenter Traffic Characteristics, In SIGCOMMWREN workshop, 2009. A. Greenberg, N. Jain, S. Kandula, C. Kim, P. Lahiri, D. Maltz, P. Patel, and S. Sengupta: VL 2: A Scalable and Flexible Data Center Network, In ACM SIGCOMM, 2009.
Thank You