
Datacenter Basics Fred Chong 290 N Green Computing
Datacenter Basics Fred Chong 290 N Green Computing
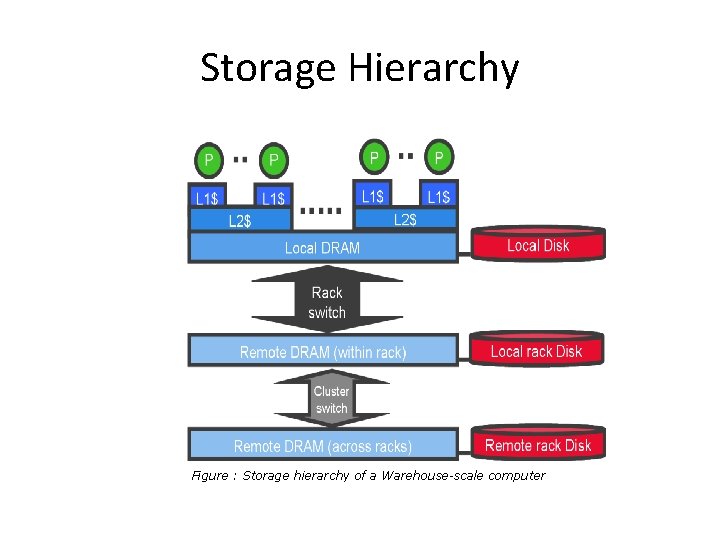
Storage Hierarchy Figure : Storage hierarchy of a Warehouse-scale computer
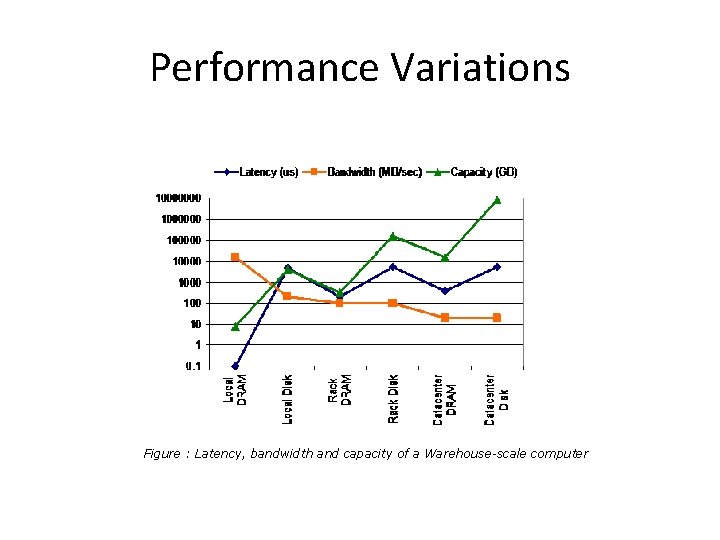
Performance Variations Figure : Latency, bandwidth and capacity of a Warehouse-scale computer
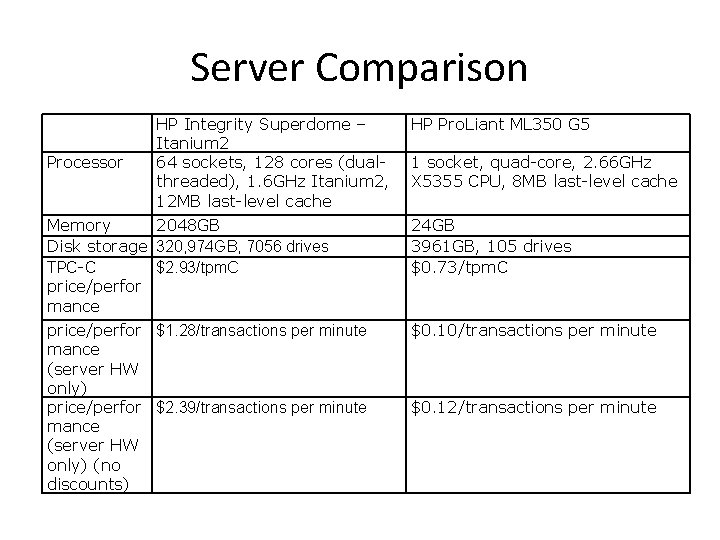
Server Comparison Processor HP Integrity Superdome – Itanium 2 64 sockets, 128 cores (dualthreaded), 1. 6 GHz Itanium 2, 12 MB last-level cache HP Pro. Liant ML 350 G 5 1 socket, quad-core, 2. 66 GHz X 5355 CPU, 8 MB last-level cache Memory 2048 GB Disk storage 320, 974 GB, 7056 drives $2. 93/tpm. C TPC-C price/perfor mance 24 GB 3961 GB, 105 drives $0. 73/tpm. C price/perfor $1. 28/transactions per minute mance (server HW only) price/perfor $2. 39/transactions per minute mance (server HW only) (no discounts) $0. 10/transactions per minute $0. 12/transactions per minute
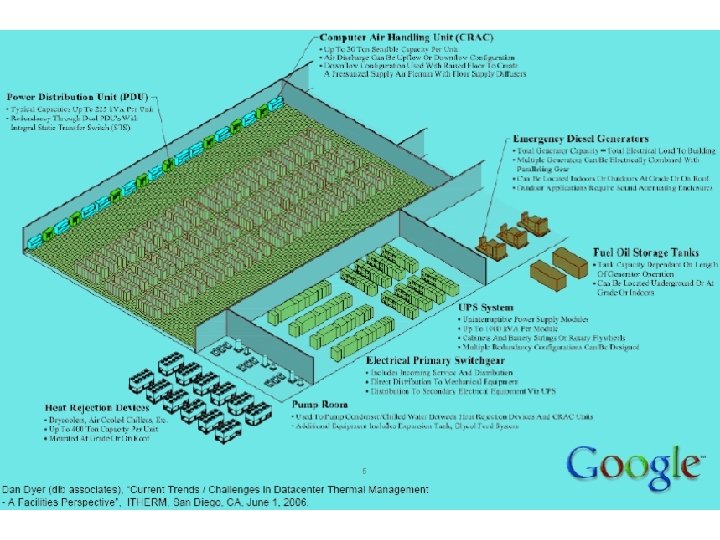
Cost proportional to Power • Cost proportional to power delivered • Typically $10 -20/W • Power delivery – 60 -400 k. V transmission lines – 10 -20 k. V medium voltage – 110 -480 V low voltage
UPS • • Uninterruptible Power Supply Batteries or flywheel AC-DC-AC conversion Conditions the power feed – Removes spikes or sags – Removes harmonic distortions • Housed in a separate UPS room • Sizes range from hundreds of k. W to 2 MW
PDUs • Power Distribution Units • Breaker panels – Input 200 -480 V – Output many 110 V or 220 V – 75 -225 k. W in 20 -30 A circuits (max 6 k. W) • Redundancy from two independent power sources
Paralleling • Multiple generators or UPSs – Feed a shared bus • N+1 (one failure) • N+2 (one maintenance, one failure) • 2 N (redundant pairs)
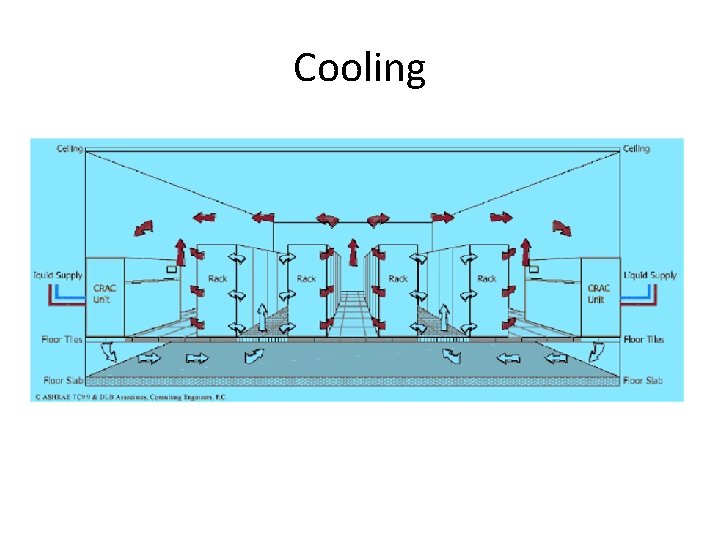
Cooling
Cooling Steps • • 12 -14 C coolant 16 -20 C air at CRAC (Computer Room AC) 18 -22 C at server intake Then back to chiller
“Free Cooling” • Pre-coolant before chiller • Water-based cooling towers use evaporation – Works in moderate climate – freezes if too cold • Glycol-based radiator outside the building – Works in cold climates
Cooling is Critical • Datacenter would fail in minutes without cooling – Cooling backed up by generators and UPSs • Adds > 40% critical electrical load
Airflow • 100 cfm (cubic feet per minute) per server • 10 servers would require 1000 cfm from perforated tiles • Typically no more than 150 -200 W / sq ft power density • Recirculation from one server’s hot air into the intake of a neighbor – Some avoid with overhead ducts
Variations • In-rack cooling – Water cooled coils next on the server – Cost of plumbing – Damage from leaks (earthquake zones!) • Container-based datacenters – Shipping container 8’ x 8. 5’ x 40’ – Similar to in-rack cooling but for the whole container – Higher power densities
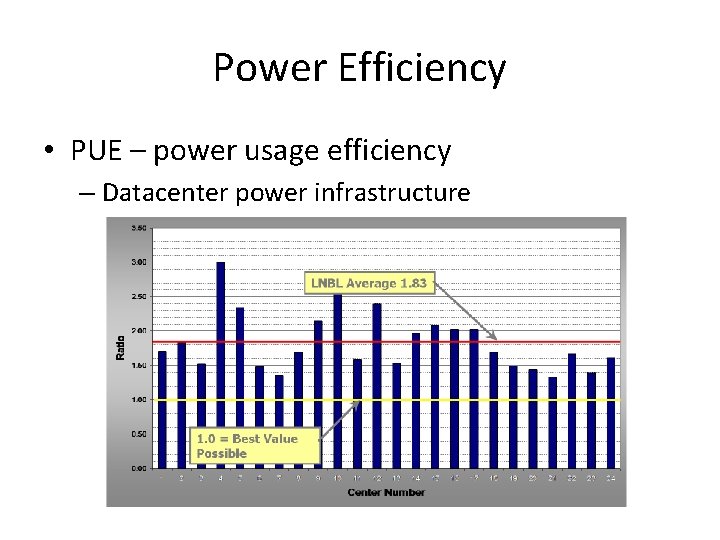
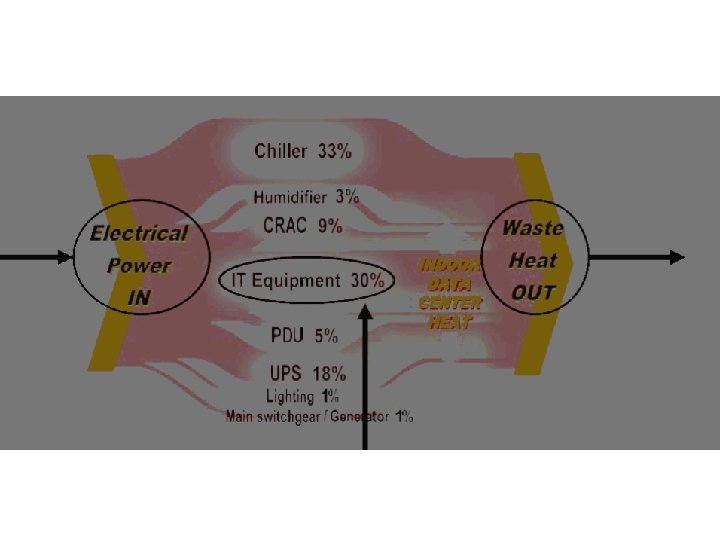
Power Efficiency • PUE – power usage efficiency – Datacenter power infrastructure
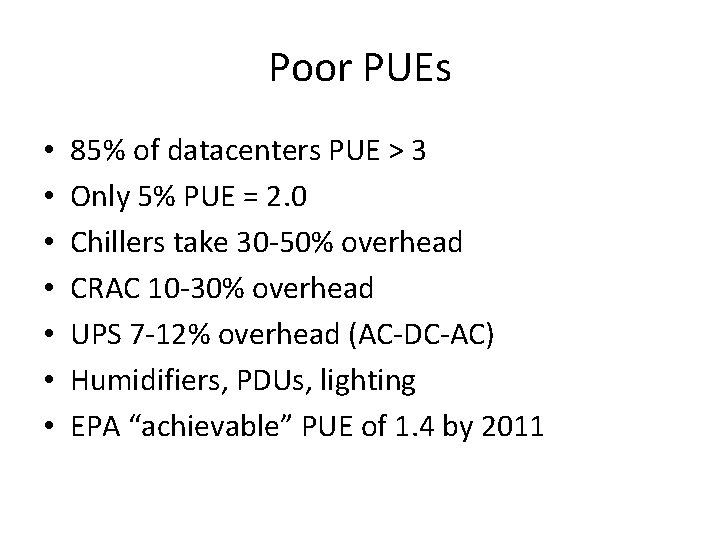
Poor PUEs • • 85% of datacenters PUE > 3 Only 5% PUE = 2. 0 Chillers take 30 -50% overhead CRAC 10 -30% overhead UPS 7 -12% overhead (AC-DC-AC) Humidifiers, PDUs, lighting EPA “achievable” PUE of 1. 4 by 2011
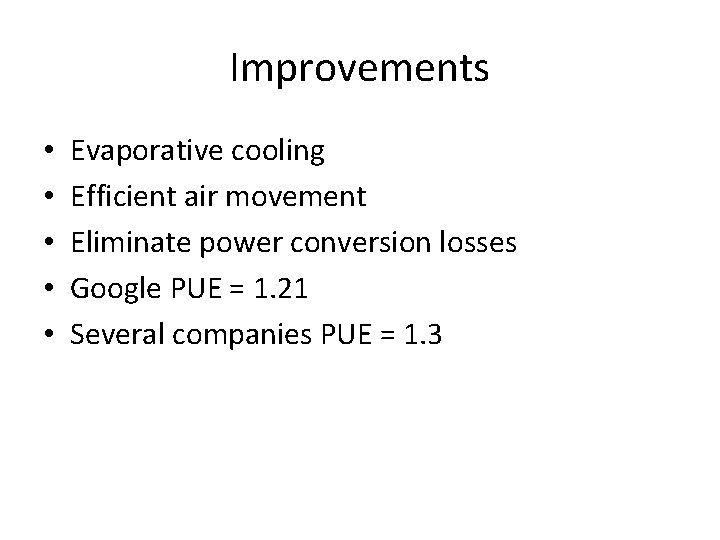
Improvements • • • Evaporative cooling Efficient air movement Eliminate power conversion losses Google PUE = 1. 21 Several companies PUE = 1. 3
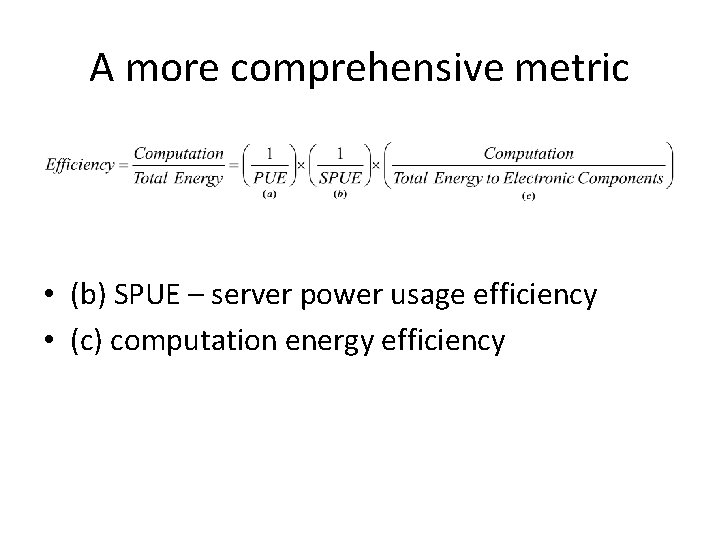
A more comprehensive metric • (b) SPUE – server power usage efficiency • (c) computation energy efficiency
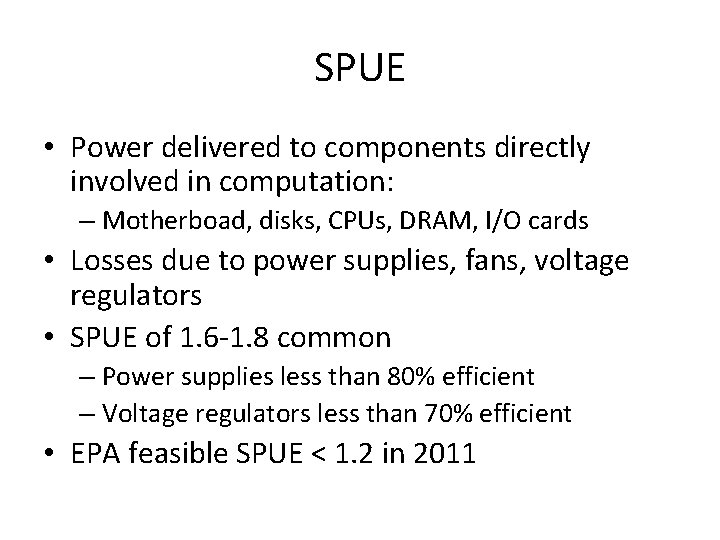
SPUE • Power delivered to components directly involved in computation: – Motherboad, disks, CPUs, DRAM, I/O cards • Losses due to power supplies, fans, voltage regulators • SPUE of 1. 6 -1. 8 common – Power supplies less than 80% efficient – Voltage regulators less than 70% efficient • EPA feasible SPUE < 1. 2 in 2011
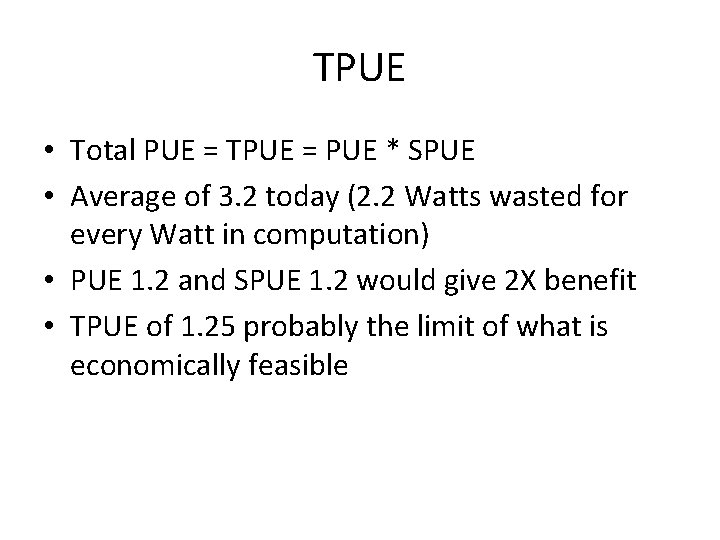
TPUE • Total PUE = TPUE = PUE * SPUE • Average of 3. 2 today (2. 2 Watts wasted for every Watt in computation) • PUE 1. 2 and SPUE 1. 2 would give 2 X benefit • TPUE of 1. 25 probably the limit of what is economically feasible
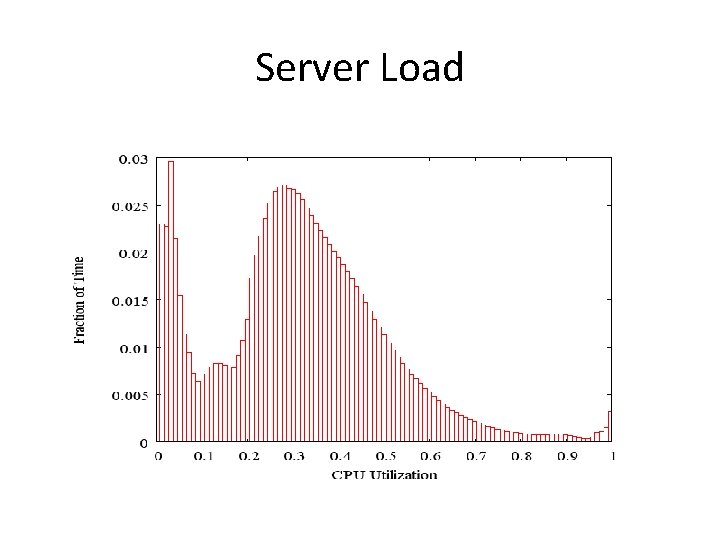
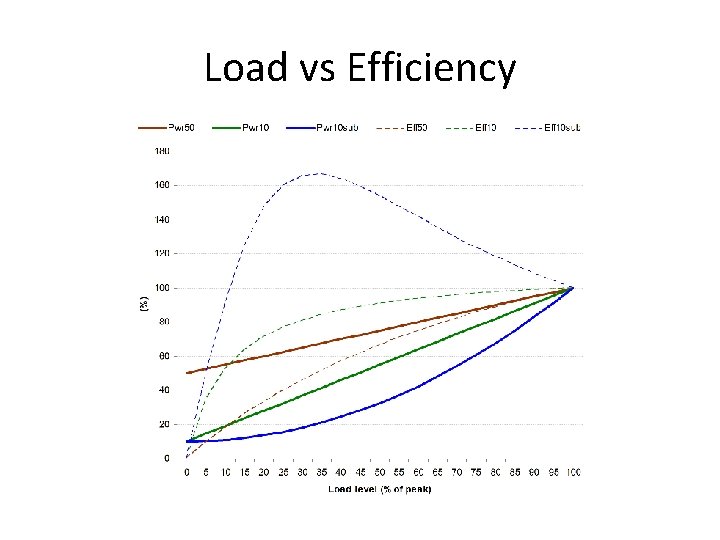
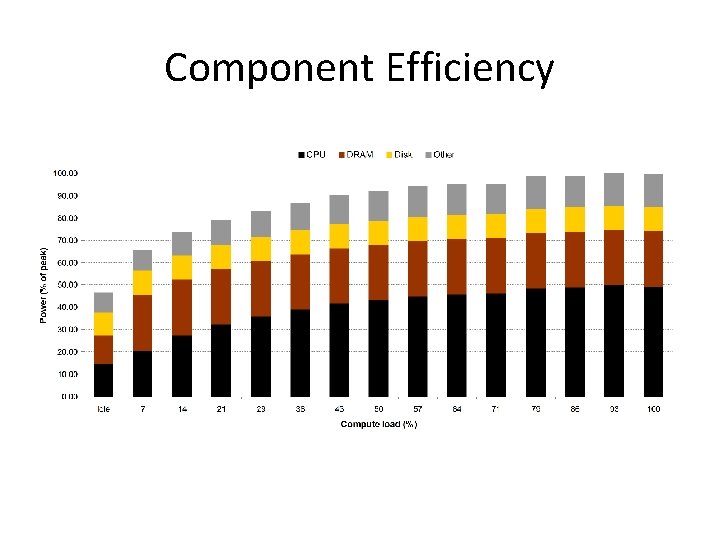
Computing Efficiency • • • Area of greatest potential Hardest to measure SPECpower Joulesort Storage Network Industry Association
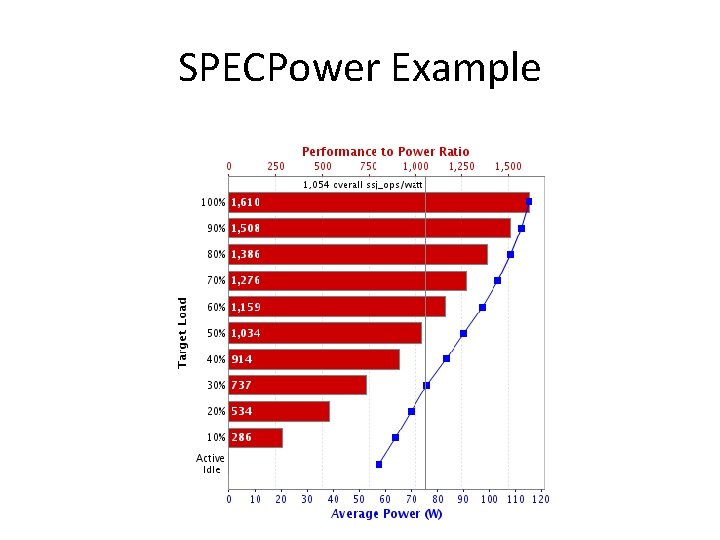
SPECPower Example
Server Load
Load vs Efficiency
Human Dynamic Range
Component Efficiency
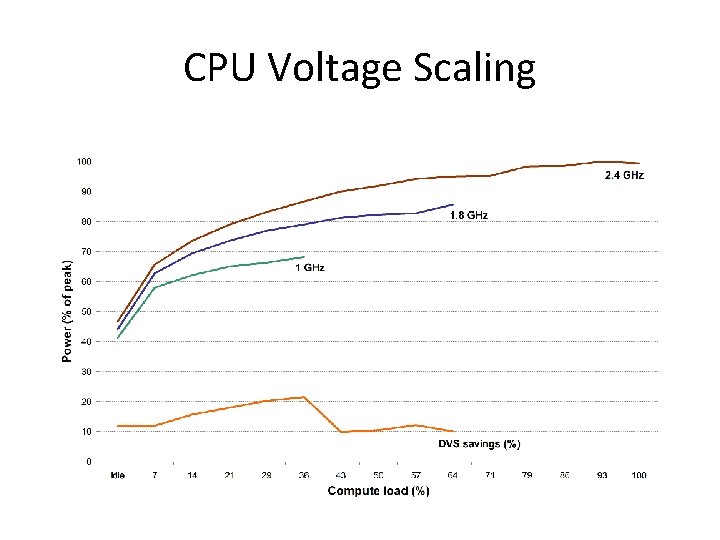
CPU Voltage Scaling
Disks • As much as 70% power to keep drives spinning • 1000 X penalty to spin up and access • Multiple head, low RPM drives [Gurumurthi]
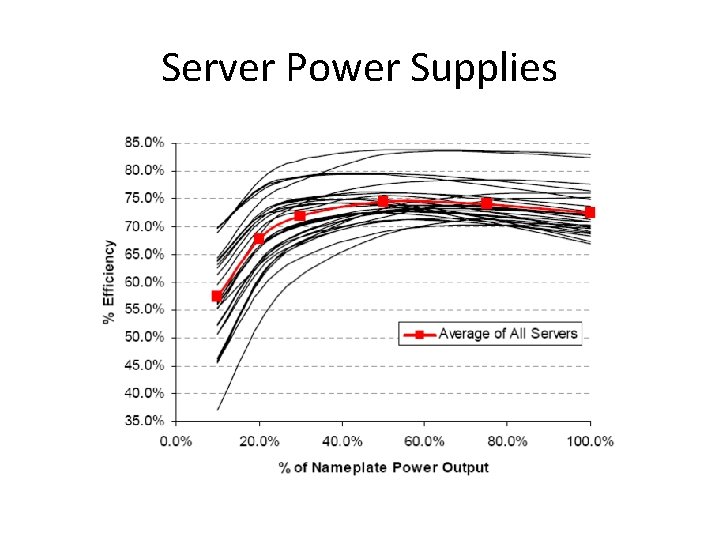
Server Power Supplies
Power Provisioning • $10 -22 per deployed IT Watt • Given 10 year depreciation cycle – $1 -2. 20 per Watt per year • Assume $0. 07 per kilowatt-hr and PUE 2. 0 – 8766 hours in a year – (8766 / 1000) * $0. 07 * 2. 0 = $1. 22724 • Up to 2 X cost in provisioning • eg. 50% full datacenter = 2 X provisioning cost
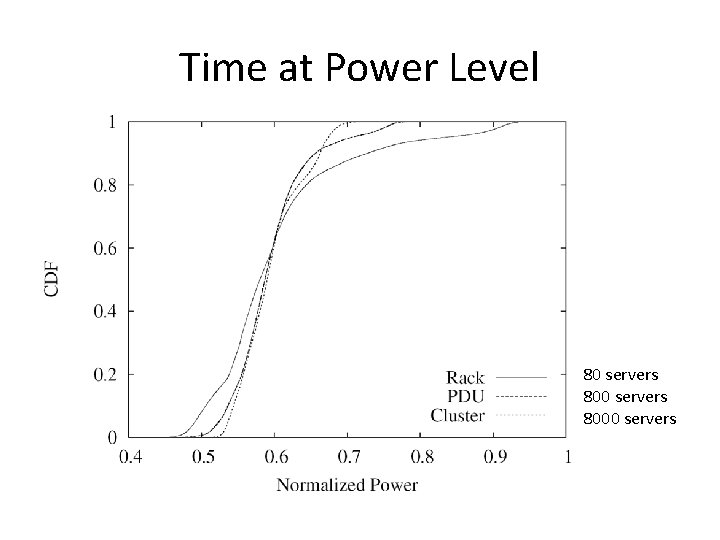
Time at Power Level 80 servers 8000 servers
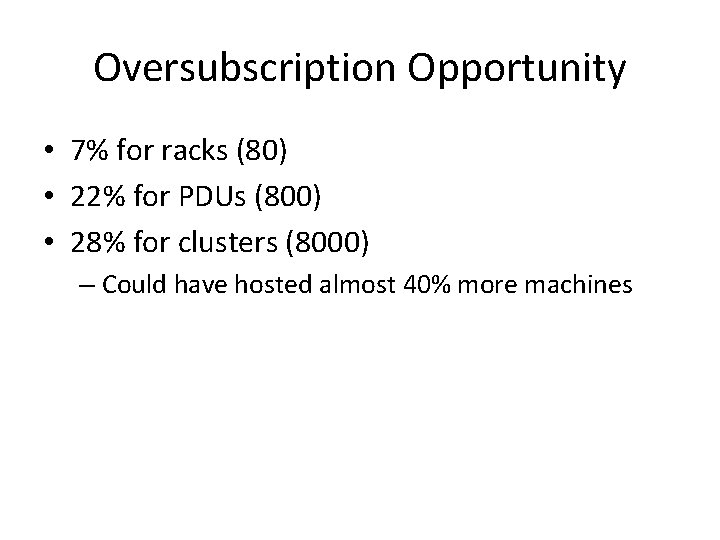
Oversubscription Opportunity • 7% for racks (80) • 22% for PDUs (800) • 28% for clusters (8000) – Could have hosted almost 40% more machines
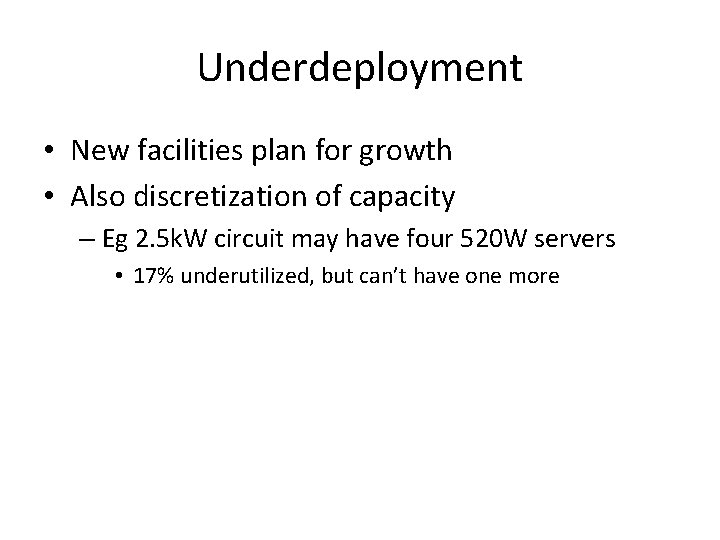
Underdeployment • New facilities plan for growth • Also discretization of capacity – Eg 2. 5 k. W circuit may have four 520 W servers • 17% underutilized, but can’t have one more
- Slides: 35