Enterprise Datacenter Management Suite ESDS SOFTWARE SOLUTION PVT
- Slides: 18

Enterprise Datacenter Management Suite |ESDS SOFTWARE SOLUTION PVT. LTD. |

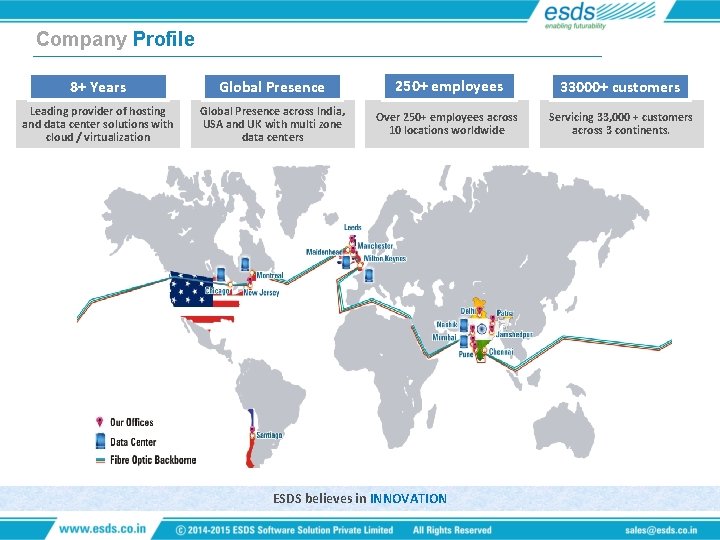
Company Profile 8+ Years Global Presence 250+ employees 33000+ customers Leading provider of hosting and data center solutions with cloud / virtualization Global Presence across India, USA and UK with multi zone data centers Over 250+ employees across 10 locations worldwide Servicing 33, 000 + customers across 3 continents. ESDS believes in INNOVATION

Introducing e. Magic

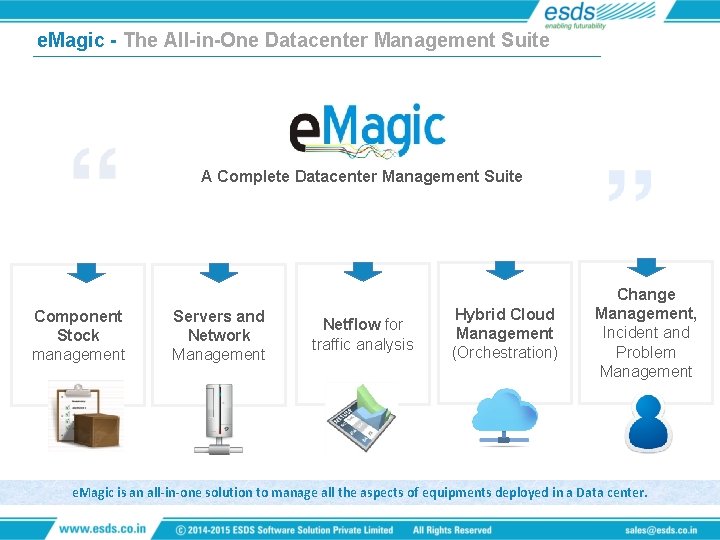
e. Magic - The All-in-One Datacenter Management Suite A Complete Datacenter Management Suite Component Stock management Servers and Network Management Netflow for traffic analysis Hybrid Cloud Management (Orchestration) Change Management, Incident and Problem Management e. Magic is an all-in-one solution to manage all the aspects of equipments deployed in a Data center.

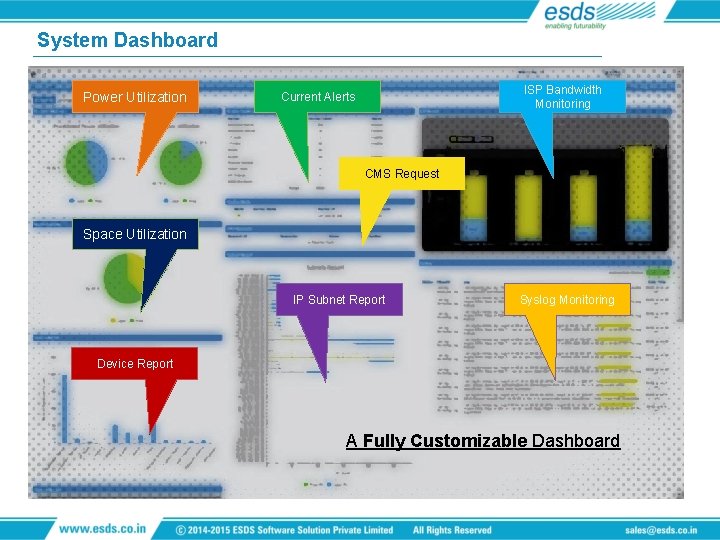
System Dashboard Power Utilization ISP Bandwidth Monitoring Current Alerts CMS Request Space Utilization IP Subnet Report Syslog Monitoring Device Report A Fully Customizable Dashboard

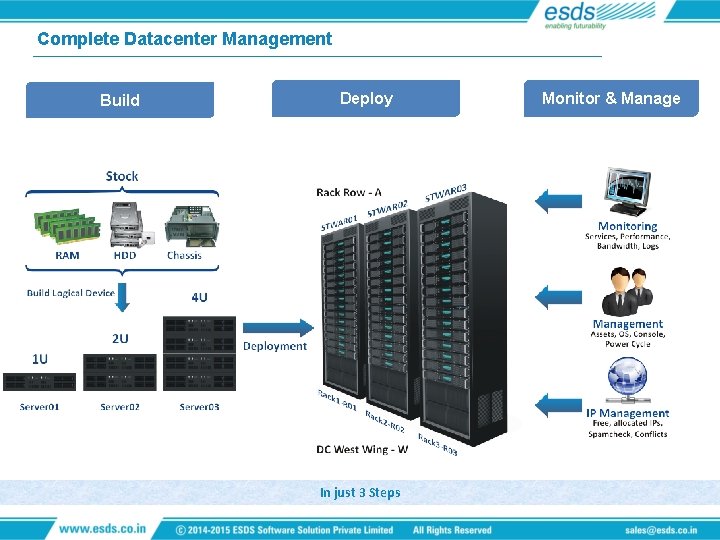
Complete Datacenter Management Build Deploy In just 3 Steps Monitor & Manage

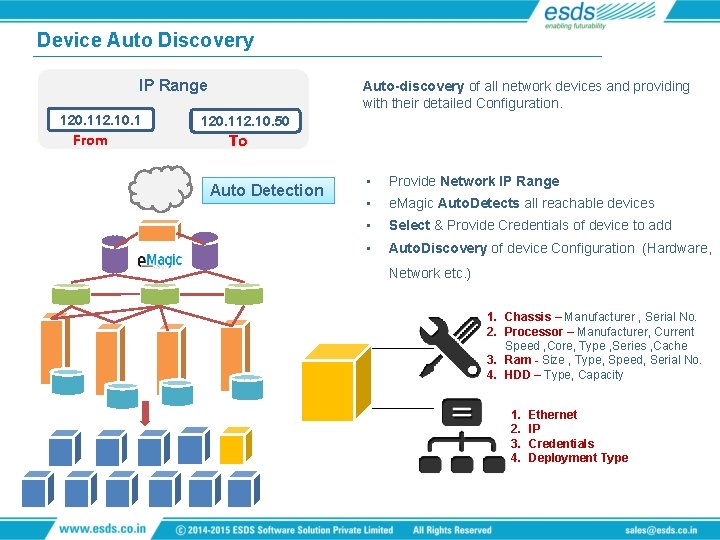
Device Auto Discovery IP Range 120. 112. 10. 1 From Auto-discovery of all network devices and providing with their detailed Configuration. 120. 112. 10. 50 To Auto Detection • • Provide Network IP Range • Select & Provide Credentials of device to add • Auto. Discovery of device Configuration (Hardware, e. Magic Auto. Detects all reachable devices Network etc. ) 1. Chassis – Manufacturer , Serial No. 2. Processor – Manufacturer, Current Speed , Core, Type , Series , Cache 3. Ram - Size , Type, Speed, Serial No. 4. HDD – Type, Capacity 1. 2. 3. 4. Ethernet IP Credentials Deployment Type

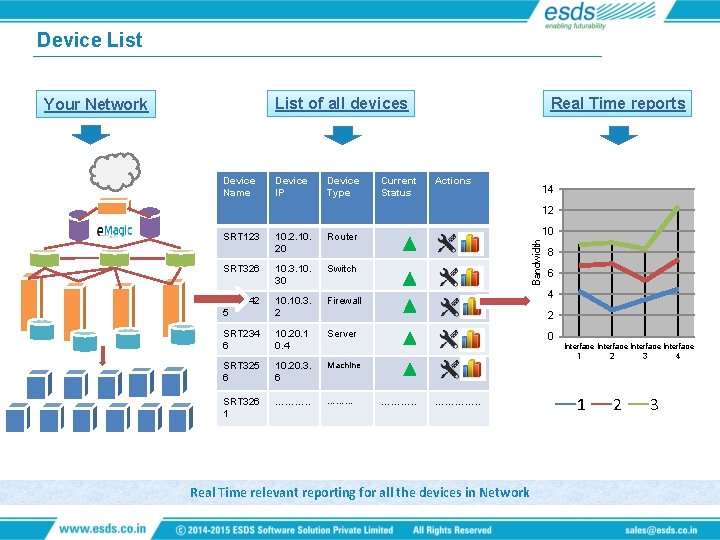
Device List Real Time reports List of all devices Your Network Device Name Device IP Device Type Current Status Actions 14 12 10. 20 Router SRT 326 10. 30 Switch SRT 342 5 10. 3. 2 Firewall SRT 234 6 10. 20. 1 0. 4 Server SRT 325 6 10. 20. 3. 6 Machine SRT 326 1 ………. . ……… 10 Bandwidth SRT 123 8 6 4 2 0 ………. . …………. . Real Time relevant reporting for all the devices in Network Interface 1 2 3 4 1 2 3

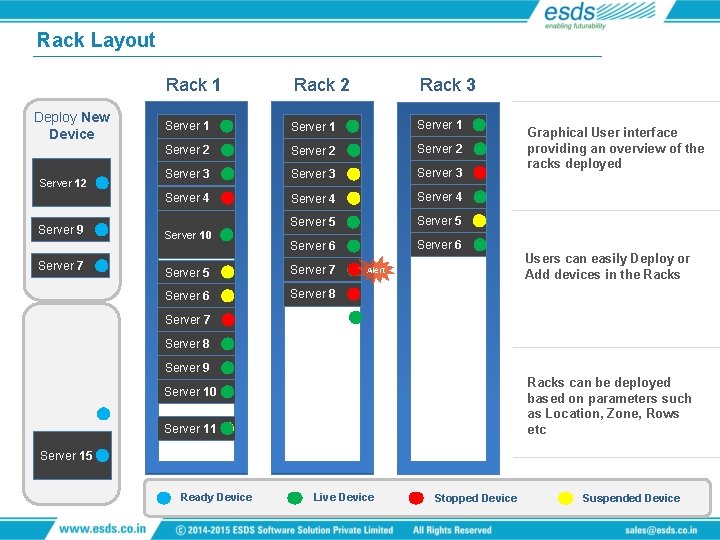
Rack Layout Rack 1 Deploy New Device Server 12 Server 9 Server 7 Rack 2 Rack 3 Server 1 Server 2 Server 3 Server 4 Server 5 Server 6 Server 10 Server 5 Server 7 Server 6 Server 8 Alert Graphical User interface providing an overview of the racks deployed Users can easily Deploy or Add devices in the Racks Server 7 Server 8 Server 9 Racks can be deployed based on parameters such as Location, Zone, Rows etc Server 10 Server 11 Server 15 Ready Device Live Device Stopped Device Suspended Device

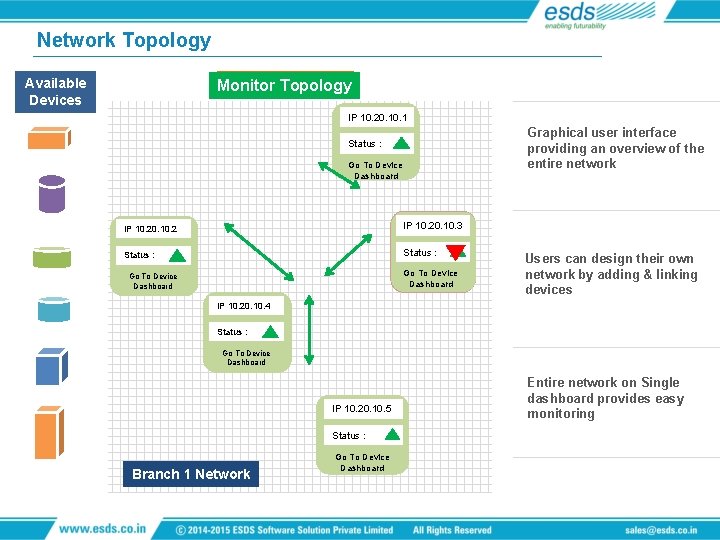
Network Topology Available Devices Save Topology Monitor Topology Build IP 10. 20. 1 Graphical user interface providing an overview of the entire network Status : Go To Device Dashboard IP 10. 20. 10. 2 IP 10. 20. 10. 3 Status : Go To Device Dashboard Users can design their own network by adding & linking devices IP 10. 20. 10. 4 Status : Go To Device Dashboard IP 10. 20. 10. 5 Status : Branch 1 Network Go To Device Dashboard Entire network on Single dashboard provides easy monitoring

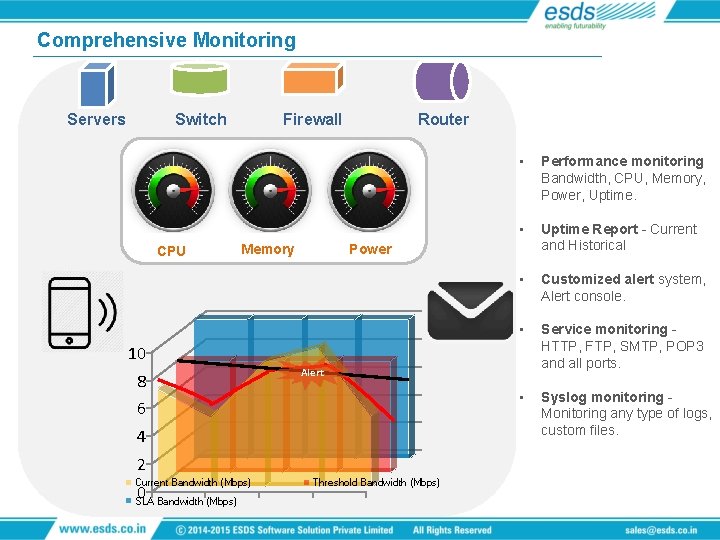
Comprehensive Monitoring Servers Switch CPU Firewall Memory Router • Performance monitoring Bandwidth, CPU, Memory, Power, Uptime. • Uptime Report - Current and Historical • Customized alert system, Alert console. • Service monitoring HTTP, FTP, SMTP, POP 3 and all ports. • Syslog monitoring Monitoring any type of logs, custom files. Power 10 8 6 Alert 4 2 Current Bandwidth (Mbps) 0 SLA Bandwidth (Mbps) Threshold Bandwidth (Mbps)

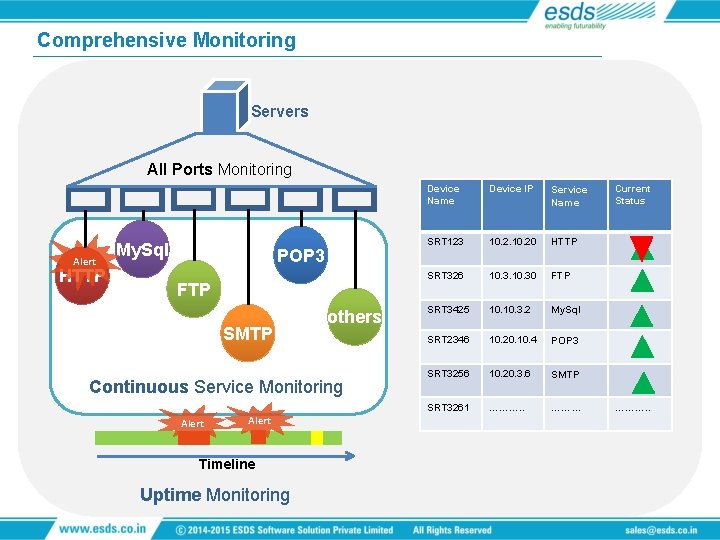
Comprehensive Monitoring Servers All Ports Monitoring Alert HTTP My. Sql POP 3 FTP SMTP others Continuous Service Monitoring Alert Timeline Uptime Monitoring Device Name Device IP Service Name SRT 123 10. 20 HTTP SRT 326 10. 30 FTP SRT 3425 10. 3. 2 My. Sql SRT 2346 10. 20. 10. 4 POP 3 SRT 3256 10. 20. 3. 6 SMTP SRT 3261 ………. . ……… Current Status ………. .

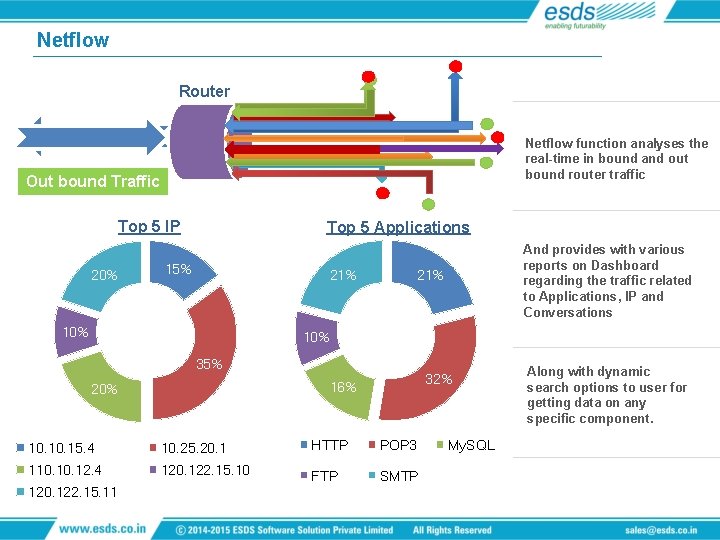
Netflow Router Netflow function analyses the real-time in bound and out bound router traffic Out In bound. Traffic Top 5 IP 20% Top 5 Applications 15% 21% 10% And provides with various reports on Dashboard regarding the traffic related to Applications, IP and Conversations 21% 10% 35% 32% 16% 20% 10. 15. 4 10. 25. 20. 1 HTTP POP 3 110. 12. 4 120. 122. 15. 10 FTP SMTP 120. 122. 15. 11 My. SQL Along with dynamic search options to user for getting data on any specific component.

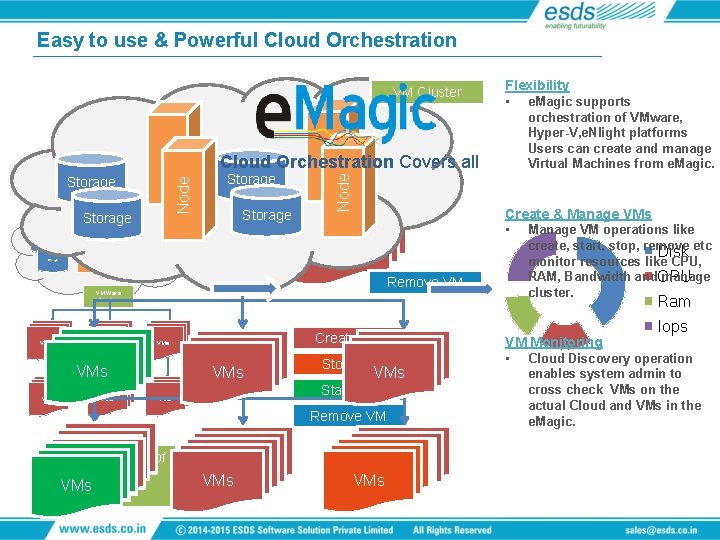
Easy to use & Powerful Cloud Orchestration VM Cluster Node Storage Storage Remove Start VM Create VM Stop VM VM Ware Cluster VMs VMs Create VM VMs Stop VM VMs Start VM VMs Remove VM Autodiscovery of VMs VM in Cluster VMs create, start, stop, remove etc Disk monitor resources like CPU, RAM, Bandwidth and. CPU manage cluster. Ram VMs orchestration of VMware, Hyper-V, e. Nlight platforms Users can create and manage Virtual Machines from e. Magic. Create & Manage VMs • Manage VM operations like VMs Node Cloud Orchestration Covers all Flexibility • e. Magic supports VMs VMs VMs Iops VM Monitoring • Cloud Discovery operation enables system admin to cross check VMs on the actual Cloud and VMs in the e. Magic.

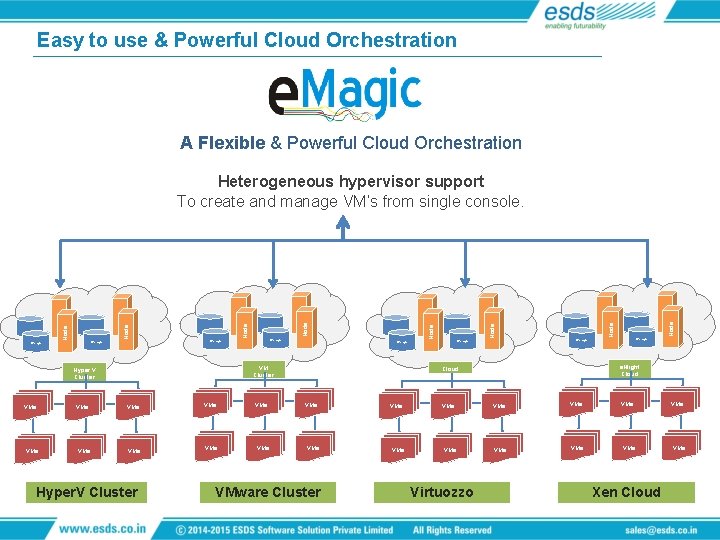
Easy to use & Powerful Cloud Orchestration A Flexible & Powerful Cloud Orchestration Storage VM Cluster Hyper V Cluster Node Storage Node Node Heterogeneous hypervisor support To create and manage VM’s from single console. Storage e. Nlight Cloud VMs VMs VMs VMs VMs VMs Hyper. V Cluster VMware Cluster Virtuozzo Xen Cloud

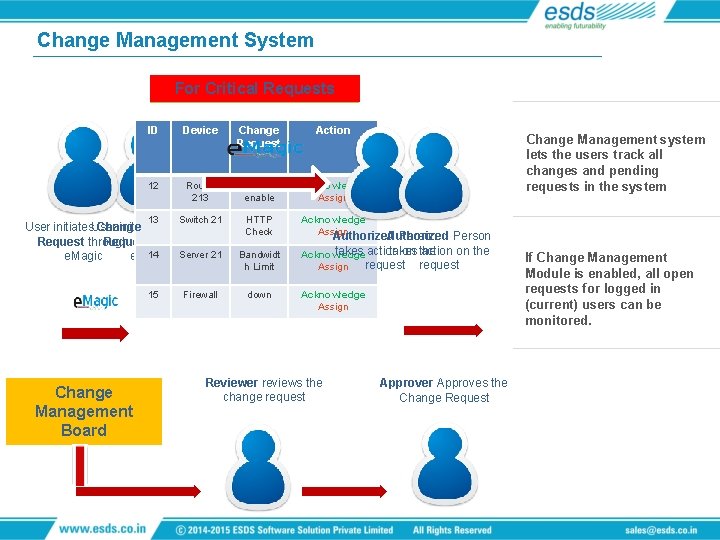
Change Management System For Critical Requests For Non Critical Requests ID Device Change Request Action 12 Router 213 SMTP enable Acknowledge Assign 13 Switch 21 HTTP Check Acknowledge Assign Authorized Person User initiates. User Change initiates Change Request through 14 Server 21 e. Magic 15 Change Management Board Firewall Bandwidt h Limit down Change Management system lets the users track all changes and pending requests in the system Person takes action takes on the action on the Acknowledge request Assign Acknowledge Assign Reviewer reviews the change request Approver Approves the Change Request If Change Management Module is enabled, all open requests for logged in (current) users can be monitored.

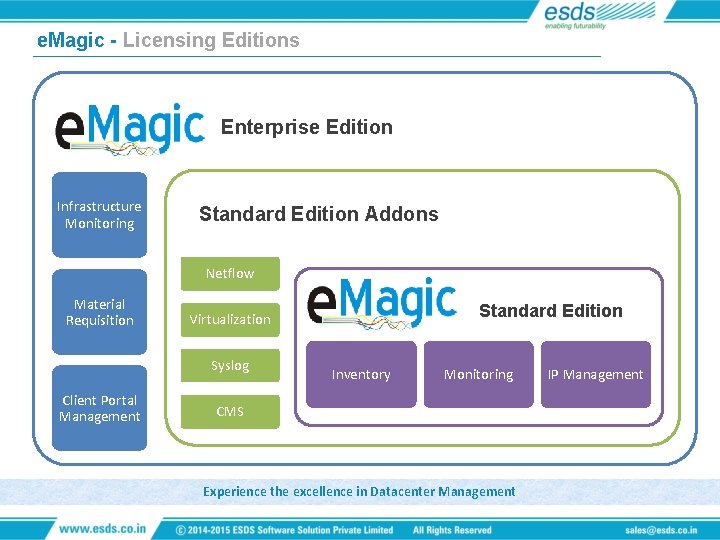
e. Magic - Licensing Editions Enterprise Edition Infrastructure Monitoring Standard Edition Addons Netflow Material Requisition Syslog Client Portal Management Standard Edition Virtualization Inventory Monitoring CMS Experience the excellence in Datacenter Management IP Management

Thank You