REVISED UNIVERSAL SOIL LOSS EQUATION RUSLE for Construction
 for Construction Sites Predicting Soil Erosion By Rainfall")


 • Smith and Whitt’s equation (1947) •")


")


 and steepness (S) are major factors")


 Slope % <3 6")


 http: //www. ectc. org/ n Industry authority in the")

 Type Percent Ground")
 and Rock Cover (Wischmeier and Smith, 1978) Type of Mulch None Mulch")
 § Conservation practices are controllable, experience-driven and interactive measures. n They")

 Surface Condition with")
 80 % passing #10 35% passing #200 2.")

 80 % passing #10 35% passing #200 2. 5:")


- Slides: 43
REVISED UNIVERSAL SOIL LOSS EQUATION (RUSLE) for Construction Sites Predicting Soil Erosion By Rainfall and Overflow Presented by: Guangyan Griffin, P. E. , Northern Region Construction Alaska Department of Transportation and Public Facilities T 2 Research Project
OBJECTIVES Understand erosion processes n Learn RUSLE and its factors n RUSLE’s application on construction sites n
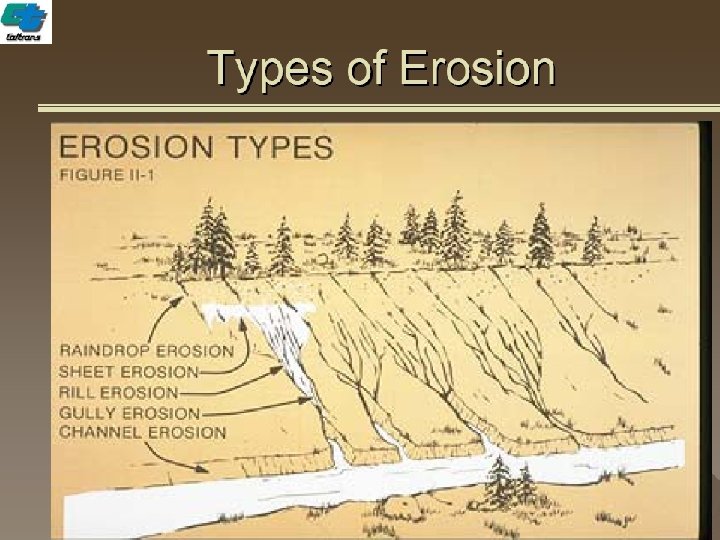
Erosion and Sedimentation Erosion is a process of detachment and transport of soil particles by erosive agents. n Erosive Agents - Raindrop impact - Overland flow surface runoff from rainfall Sedimentation is the deposition of eroded material.
FACTORS AFFECTING EROSION Climate n Soil n Topography n Land use n - Cover - Supporting practices
EROSION IS A CONCERN n Degrades soil resource n Causes downstream sedimentation n Produces sediment which is a pollutant n Produces sediment that carries pollutants
EROSION PREDICTION AS A TOOL n Evaluate impact of erosion prior to construction Manage BMPs more effectively and economically Doing it right the first time Serve as technical rationale n Concept: n n n - Estimate erosion rate under different conditions
OVERVIEW OF RUSLE background n Where RUSLE applies n RUSLE factors n
RUSLE HISTORY BACKGROUND • Zingg’s equation (1940) • Smith and Whitt’s equation (1947) • US Dept. of Agriculture: Agri. Hand. Books – AH-282 (1965) – USLE, Wischmeier and Smith – AH-537 (1978) – Wischmeier and Smith – AH-703 (1997) – RUSLE, Renard and Froster • Office of Surface Mining Manual (mined, reclaimed land, construction sites) (1998) • Computer software: - RUSLE 1 (1992) - RUSLE 2 (2001)
RUSLE BACKGROUND n From theory of erosion process that the soil loss is caused by rain drop impact and the overland flow. n Consists of a set of mathematical equations
RUSLE APPLICATIONS Cropland n Pastureland n Rangeland n Disturbed forest land n Construction sites n Surface mine reclamation n Military training lands n Parks n Waste disposal/landfills n
RUSLE Area Landscape Overland flow Interrill Rill Gully (Concentrated flow)
RUSLE FACTORS A=RKLSCP R- Rainfall-runoff erosivity factor n K- Soil erodibility factor n L- Slope length factor n S- Slope steepness factor n C- Cover-management factor n P- Supporting practices factor n
EROSIVITY - R n n 22 years or longer rainfall data gathered by weather stations. Single storm - Energy x 30 minute intensity n n n Annual-sum of daily values Average annual-average of annual values Monthly value=average annual x fraction that occurs on a given month
EROSIVITY - R Measure of erosivity of climate at a location Las Vegas, NV Phoenix, AZ Anchorage, AK Denver, CO Fairbanks, AK Syracuse, NY Juneau, AK Minneapolis, MN Chicago, IL Richmond, VA Dallas, TX Birmingham, AL Charleston, SC New Orleans, LA 8 22 26 40 48 80 101 110 140 200 275 350 400 700
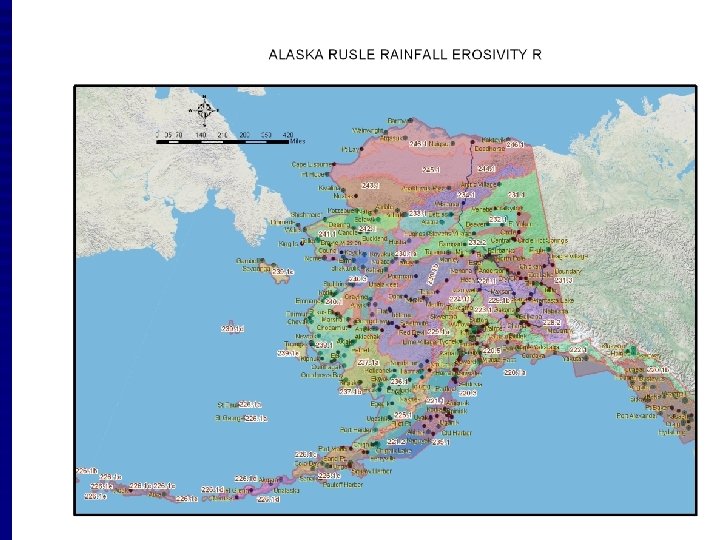
R-factor for Alaska n n n Retrieved from USDA RUSLE 2 computer program data file at fargo. nserl. purdue. edu/rusle 2_dataweb/RUSLE 2_Ind ex. htm. AK is broken into climate zones per common resource areas (CRA) Way to acquire an R-Factor: - Determine the climate zone ID in which the construction project is located from the map - Look up the R-factor from the table
Climate Zone ID Jan Feb Mar Apr May 220. 1 a 0 0 2. 5 4. 2 17 Craig, Ketchikan, Wrangell, Sitka, Alexander Archipelago Juneau, Hoonah, Yakutat, Cordova, 220. 1 b Wooded Islands 0 0 4. 4 8. 9 Common Resource Areas Middleton Islands Key Locations Sep Oct Nov Dec R, Annual 13 12 3 0 0 52 28 21 20 6. 7 0 0 89 Ri, Monthly Jun Jul Aug Seldovia Area Portlock, Port Graham, Seldovia 220. 2 0 0 1. 3 4. 6 13 4. 1 2. 2 0 0 0 25 Lower Kenai Peninsula Ushagat Island, E. Chuguch Island, Ragged Island, Chiswell Islands 220. 3 0 0 2. 5 4. 8 12 10 9. 2 2. 4 0 0 41 Seward Area Seward 220. 4 0 0 2. 7 4. 9 12 15 15 3. 6 0 0 53 220. 5 0 0 6. 2 12 36 34 24 6. 6 0 0 120 Kodiak, Chiniak, Afognak, Akhiok 221. 1 0 0 3. 6 6. 8 17 13 10 3 0 0 53 Sitkinak-Chirikof Island Area Chirkof Island, Aghlyuk Island, Kiliktagik Island 221. 2 0 0 2. 9 6. 6 17 14 11 2. 4 0 0 54 S. Alaska Coastal Mountains Hyder, Snettisham, Skagway, Haine, Thompson Pass 222. 1 0 0 6. 3 13 45 35 33 9. 6 0 0 140 Valdez 222. 2 0 0 2. 9 6. 4 27 22 18 4. 2 0 0 80 Rainy Pass, Cantwell, Sutton, Girdwood 223. 1 0 0 44 42 36 19 12 19 0 0 170 Hope 223. 2 0 0 1. 7 4 16 12 8. 9 2. 2 0 0 44 Eagle River 223. 3 0 0 0. 46 4. 8 24 3. 8 1. 4 0 0 0 35 Homer-Fox River Area Homer 224. 1 0 0 0. 91 2 7. 5 6 5. 3 1. 3 0 0 23 Small River Areas Anchor Pt, Ninilchik, Nikolaevsk 224. 2 0 0 0. 69 3. 3 14 3. 1 1. 3 0 0 0 22 Ninilchik Uplands 224. 3 0 0 0. 78 3. 3 14 3. 3 1. 5 0 0 0 23 Clam Gulch, Kaslof, Kenai, Nikiski 224. 4 0 0 0. 58 3. 6 14 3. 3 1. 3 0 0 0 22 224. 5 0 0 0. 55 3. 6 15 3. 4 1. 2 0 0 0 23 Inner Prince William Whittier, Chenega Sound Kodiak Island Area Valdez Valley Cook Inlet Mountains Turnagain Area Chugach Mountain Valleys Kenai Coastal Lowlands Kenai Foothills Soldotna, Sterling 224. 6 0 0 0. 6 3. 9 15 3. 4 1. 2 0 0 0 25 Anchorage Bowl Anchorage, Birchwood 224. 7 0 0 0. 38 3. 1 18 3. 3 1. 1 0 0 0 26 Mat. Su Lowlands Wasila, Palmer 224. 8 0 0 1 2. 6 11 9. 1 7. 2 1. 3 0 0 32 Willow, Houston, Big Lake, Goose Bay, Pt Mackenzie 224. 9 0 0 1. 9 2. 8 11 14 8. 7 2 0 0 41 Knik Lowlands
SOIL ERODIBILITY - K n Measure of K-factor under standard unit plot condition - 72. 6 ft long, 9% slope, tilled continuous fallow, up and down hill tillage n n Represent the uniform soil at upper 6”of the subsoil (not topsoil) in a construction site Major factors - Texture Organic matter Structure Permeability
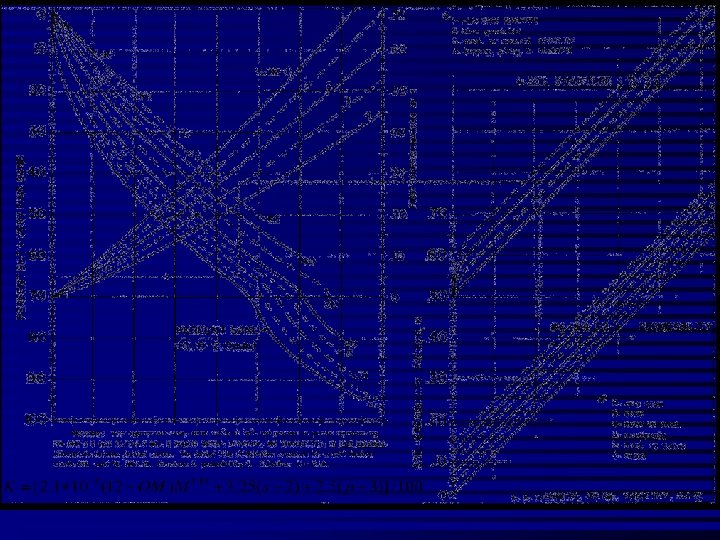
Obtain Soil Data n Perform gradation analysis - sand - silt - clay Options: n n n Information in Alaska Soil Survey Report published by NRCS. Using soil-erodibility nomograph chart or equation. Use regression equations in AH-703, Renard et al. (1997).
Approximate K Values for Construction Soil Material Soil Type USCS Classifications Percent Passing 3” Percent Passing #10 Percent Passing #200 K-Factor Sandy gravel, little or no fines 1 GW, GP 85 -100 15 -35 0 -5 0. 02 Sandy Gravel 1 GW, GP 85 -100 20 -40 5 -7 0. 04 Silty sandy gravel 1 GP-GM 85 -100 20 -50 7 -10 0. 05 Silty sandy gravel 1 GP-GM 85 -100 25 -55 10 -15 0. 08 Silty gravel, Silty sandy gravel 1 GP-GM 85 -100 30 -55 15 -25 0. 10 -0. 16 Gravelly sand 2 SP-SM -- 90 -100 10 -25 0. 20 Coarse sand, loam fine sand 2 SM 90 -100 75 -100 15 -40 0. 10 -0. 15 Silty gravel, silty sand 2 GM, SM 65 -95 35 -50 0. 17 Silt loam 2 ML -- 90 -100 70 -90 0. 37 Sandy loam 2 SM -- 90 -100 35 -50 0. 32 Fine sandy loam, loam 2 ML, SM 85 -100 80 -100 20 -60 0. 24 -0. 32 Clay loam, gravelly loam, cobbly loam 2 CL 75 -100 65 -95 55 -75 0. 32 Silty clay, cobbly silty clay 2 CL 90 -100 85 -100 75 -90 0. 17 Rock, shotrock, ripped rock 1 GP 85 -100 20 -30 < 15 0. 02 -0. 05 Rock, shotrock, ripped rock 1 GP-GM 15 -25 0. 07 -0. 11
TOPOGRAPHY - LS n n Slope length (L) and steepness (S) are major factors Watershed topography affects erosion rate and sediment transport Steep slopes typically result in rapid runoff Long slopes acuminate more runoff
Hillslope Shape Convex Uniform Concave Complex. Convex: concave Complex. Concave: convex
Slope Length for Uniform Slope SOIL LOSS SLOPE LENGTH RUSLE ESTIMATES TO HERE SEDIMENT YIELD
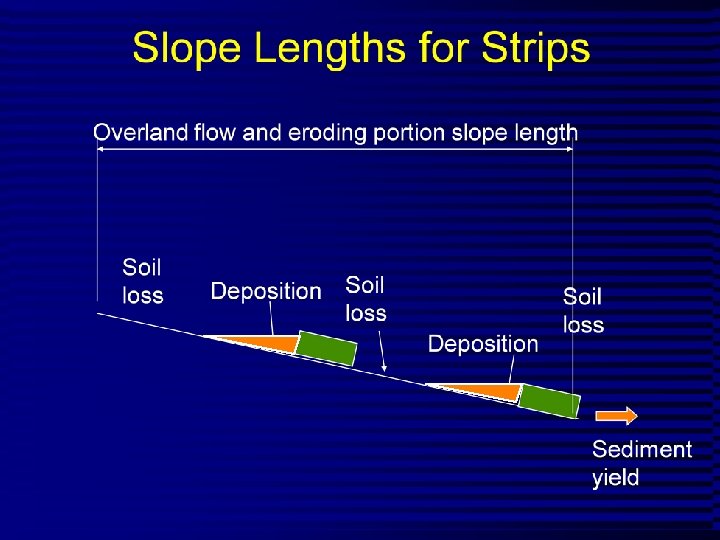
Slope Length for Complex Slope Soil loss Deposition SLOPE LENGTH Sediment yield
Values for LS for Construction Sites Horizontal slope length (ft) Slope % <3 6 9 12 15 25 50 75 100 150 200 250 300 400 600 800 1000 0. 2 0. 05 0. 06 0. 5 0. 07 0. 08 0. 09 0. 10 0. 11 0. 12 0. 13 1. 0 0. 09 0. 10 0. 13 0. 14 0. 15 0. 17 0. 18 0. 19 0. 20 0. 22 0. 24 0. 26 0. 27 2. 0 0. 13 0. 16 0. 21 0. 25 0. 28 0. 33 0. 37 0. 40 0. 43 0. 48 0. 56 0. 63 0. 69 3. 0 0. 17 0. 21 0. 30 0. 36 0. 41 0. 50 0. 57 0. 64 0. 69 0. 80 0. 96 1. 10 1. 23 4. 0 0. 20 0. 26 0. 38 0. 47 0. 55 0. 68 0. 79 0. 89 0. 98 1. 14 1. 42 1. 65 1. 86 5. 0 0. 23 0. 31 0. 46 0. 58 0. 68 0. 86 1. 02 1. 16 1. 28 1. 51 1. 91 2. 25 2. 55 6. 0 0. 26 0. 36 0. 54 0. 69 0. 82 1. 05 1. 25 1. 43 1. 60 1. 90 2. 43 2. 89 3. 30 8. 0 0. 32 0. 45 0. 70 0. 91 1. 10 1. 43 1. 72 1. 99 2. 24 2. 70 3. 52 4. 24 4. 91 10. 0 0. 35 0. 37 0. 38 0. 39 0. 40 0. 57 0. 91 1. 20 1. 46 1. 92 2. 34 2. 72 3. 09 3. 75 4. 95 6. 03 7. 02 12. 0 0. 36 0. 41 0. 45 0. 47 0. 49 0. 71 1. 15 1. 54 1. 88 2. 51 3. 07 3. 60 4. 09 5. 01 6. 67 8. 17 9. 57 14. 0 0. 38 0. 45 0. 51 0. 55 0. 58 0. 85 1. 40 1. 87 2. 31 3. 09 3. 81 4. 48 5. 11 6. 30 8. 45 10. 40 12. 23 16. 0 0. 39 0. 49 0. 56 0. 62 0. 67 0. 98 1. 64 2. 21 2. 73 3. 68 4. 56 5. 37 6. 15 7. 60 10. 26 12. 69 14. 96 20. 0 0. 41 0. 56 0. 67 0. 76 0. 84 1. 24 2. 10 2. 86 3. 57 4. 85 6. 04 7. 16 8. 23 10. 24 13. 94 17. 35 20. 57 25. 0 0. 45 0. 64 0. 80 0. 93 1. 04 1. 56 2. 67 3. 67 4. 59 6. 30 7. 88 9. 38 10. 81 13. 53 18. 57 23. 24 27. 66 30. 0 0. 48 0. 72 0. 91 1. 08 1. 24 1. 86 3. 22 4. 44 5. 58 7. 70 9. 67 11. 55 13. 35 16. 77 23. 14 29. 07 34. 71 40. 0 0. 53 0. 85 1. 13 1. 37 1. 59 2. 41 4. 24 5. 89 7. 44 10. 35 13. 07 15. 67 18. 17 22. 95 31. 89 40. 29 48. 29 50. 0 0. 58 0. 97 1. 31 1. 62 1. 91 2. 91 5. 16 7. 20 9. 13 12. 75 16. 16 19. 42 22. 57 28. 60 39. 95 50. 63 60. 84 60. 0 0. 63 1. 07 1. 47 1. 84 2. 19 3. 36 5. 97 8. 37 10. 63 14. 89 18. 92 22. 78 26. 51 33. 67 47. 18 59. 93 72. 15
LS Factor for Complex Slope n break it down into several fairly uniform segments where the gradient changes, preferably into equal lengths Number Sequential of number of segments 2 Slope Gradient (H: V) 50: 1 20: 1 15: 1 12: 1 10: 1 8: 1 6: 1 5: 1 4: 1 3: 1 2. 5: 1 2: 1 1. 75: 1 1 0. 76 0. 67 0. 65 0. 63 0. 62 0. 61 0. 6 0. 59 0. 58 0. 57 0. 56 2 1. 24 1. 33 1. 35 1. 37 1. 38 1. 39 1. 41 1. 42 1. 43 1. 44 1 0. 65 0. 53 0. 51 0. 48 0. 47 0. 46 0. 44 0. 43 0. 42 0. 41 0. 4 2 1. 06 1. 05 1. 04 1. 03 3 1. 29 1. 41 1. 45 1. 47 1. 48 1. 52 1. 53 1. 54 1. 55 1. 56 1. 57 1 0. 58 0. 45 0. 42 0. 4 0. 39 0. 37 0. 36 0. 35 0. 34 0. 33 0. 32 2 0. 94 0. 89 0. 88 0. 87 0. 86 0. 85 0. 84 0. 83 0. 82 0. 81 3 1. 16 1. 20 1. 21 1. 22 1. 23 1. 24 4 1. 32 1. 46 1. 49 1. 52 1. 53 1. 55 1. 58 1. 59 1. 62 1. 63 1. 64 1 0. 53 0. 40 0. 37 0. 35 0. 33 0. 32 0. 3 0. 29 0. 28 0. 27 0. 26 2 0. 86 0. 79 0. 76 0. 75 0. 74 0. 72 0. 71 0. 7 0. 69 0. 68 0. 67 3 1. 06 1. 05 1. 04 1. 03 4 1. 21 1. 34 1. 28 1. 48 1. 30 1. 52 1. 31 1. 32 1. 33 1. 34 1. 35 1. 36 1. 55 1. 56 1. 59 1. 61 1. 62 1. 64 1. 65 1. 66 1. 67 1. 68 3 4 5 5
Cover Management Factor C n The factor representing the site’s cover protection from rainfall impact. n The ratio of erosion between a specific ground cover and bare ground.
Cover-Management Effects Raindrops intercepted by canopy cover Raindrops not intercepted by canopy cover Intercepted rainfalling from canopy cover Canopy cover Ground cover Ridges Buried residue Live roots Dead roots
Erosion Control Technology Council (ECTC) http: //www. ectc. org/ n Industry authority in the development of standards, testing, and installation techniques - Rolled erosion control products (RECPs), - Hydraulic erosion control products (HECPs) - Sediment retention fiber rolls (SRFRs).
Table ECTC Standard Specification For Temporary Rolled Erosion Control Products (http: //www. ectc. org/specifications. asp) For use where natural vegetation alone will provide permanent erosion protection. ULTRA SHORT-TERM - Typical 3 month functional longevity. Type Product Description Material Composition 1. A Mulch Control Nets A photodegradable synthetic mesh or woven biodegradable natural fiber netting. 1. B Netless Rolled Erosion Natural and/or polymer fibers mechanically interlocked and/or Control Blankets chemically adhered together to form a RECP. 1. C Single-net Erosion Processed degradable natural and/or polymer fibers mechanically Control Blankets & bound together by a single rapidly degrading, synthetic or natural Open Weave Textiles fiber netting or an open weave textile of processed rapidly degrading natural or polymer yarns or twines woven into a continuous matrix. 1. D Double-net Erosion Processed degradable natural and/or polymer fibers mechanically Control Blankets bound together between two rapidly degrading, synthetic or natural fiber nettings. SHORT-TERM - Typical 12 month functional longevity. Type Product Description 2. A Mulch Control Nets 2. B 2. C Material Composition A photodegradable synthetic mesh or woven biodegradable natural fiber netting. Netless Rolled Erosion Natural and/or polymer fibers mechanically interlocked and/or Control Blankets chemically adhered together to form a RECP. Single-net Erosion An erosion control blanket composed of processed degradable Control Blankets & natural or polymer fibers mechanically bound together by a single Open Weave Textiles degradable synthetic or natural fiber netting to form a continuous matrix or an open weave textile composed of processed degradable natural or polymer yarns or twines woven into a continuous matrix. Slope Applications* Maximum C Factor 2, 5 Gradient 5: 1 (H: V) < 0. 10 4: 1 (H: V) < 0. 10 3: 1 (H: V) < 0. 15 2: 1 (H: V) < 0. 20 Slope Applications* Maximum C Factor 2, 5 Gradient 5: 1 (H: V) < 0. 10 4: 1 (H: V) < 0. 10 3: 1 (H: V) < 0. 15
C-factor for Other Covers (Pitt, Clark and Lake, 2007; Fifield, 2004) Type Percent Ground Cover (%) 0 20 40 60 80 95 -100 Temporary Grass 1 ---------------0. 45 --------------- Permanent Grass 2 . 45 . 20 . 10 . 042 . 013 . 003 Mechanically Cleared . 94 . 44 . 30 . 20 . 10 Not given Site 3 Hydraulic Mulching 4 ----------------0. 10 --------------
Mulch (Mechanical) and Rock Cover (Wischmeier and Smith, 1978) Type of Mulch None Mulch Rate (tons/acre) 0 1 1. 5 Straw/hay, tied down by anchoring and tacking equipment 2 2 135 Crushed stone, ¼ to 1 ½ in 240 7 12 Wood chips 25 Land Slope (%) all 1 -5 6 -10 11 -15 16 -20 21 -25 26 -33 34 -50 <16 16 -20 21 -33 34 -50 <21 21 -33 34 -50 <16 16 -20 21 -33 34 -50 Max Length 1 (ft) 200 100 300 150 400 200 150 100 75 50 35 200 150 100 75 300 200 150 75 50 100 75 200 150 100 75 C Factor 1 0. 2 0. 12 0. 06 0. 07 0. 11 0. 14 0. 17 0. 2 0. 05 0. 02 0. 08 0. 05 0. 02
Supporting Practices (P) § Conservation practices are controllable, experience-driven and interactive measures. n They can: - enhance the factors of cover and soil texture - mitigate the influence of rainfall and runoff - modify flow path length and steepness
Supporting Practices n Strips/barriers - n Buffer strips, Filter fence, Wattles Straw bales, Gravel bags Diversions - Channel - Terrace n Impoundments - Sediment traps - Detention / retention pond
P-factor for Construction Sites (Fifield 2004 and Foster & Toy 1998) Surface Condition with No Cover P-factor Bare soil, trackwalks along contour 1. 2 Bare soil, rough, loose surface 1. 0 Bare soil, trackwalks up and down slope 0. 9 Silt fence barrier, continuous berm, gravel filter 1, 2 Sediment containment systems (sediment traps/basin), rock check dam 3 Sandbag or bale barriers 1, 2 0. 6 0. 1 -0. 9 Rock barriers at sump location, diameter 1”-2” 1 0. 8 Grass buffer strips, with minimum 50 ft width and 65% ground cover 0 -10% basin slope 11% to 24% basin slope 0. 6 0. 8
Examples Steese Hwy Silty gravel (GM) 80 % passing #10 35% passing #200 2. 5: 1 Slope/60 ft long R=31 K=0. 17 LS=4. 9 RKLS = 26 Tons/acre/yr
Examples n C=1, up and down slope trackwalking P= 0. 9 CP x RKLS = 0. 9 x 26 = 23 Tons/acre/yr n 70% perennial grass cover C=0. 0275, P =1 CP x RKLS = 0. 0275 x 26 = 0. 7 Tons/acre/yr n Mulching C=0. 02, tracked P=0. 9 CP x RKLS = 0. 02 x 0. 9 x 26 = 0. 5 Tons/acre/yr
Examples Valdez Silty gravel (GM) 80 % passing #10 35% passing #200 2. 5: 1 Slope/60 ft long R=80 K=0. 17 LS=4. 9 RKLS = 67 Tons/acre/year
Examples n C=1, up and down slope trackwalking P= 0. 9 CP x RKLS = 0. 9 x 67 = 60 Tons/acre/yr n 70% perennial grass cover C=0. 0275, P =1 CP x RKLS = 0. 0275 x 67 = 1. 8 Tons/acre/yr n Mulching C=0. 02, tracked P=0. 9 CP x RKLS = 0. 02 x 0. 9 x 67 = 1. 2 Tons/acre/yr
SUMMARY RUSLE is only for interrill and rill erosion, not for gully and channel erosion. n The result from RUSLE is ESTIMATED soil loss rate, cannot be interpreted as ACTUAL soil loss rate. n RUSLE AK use on unfrozen soil only n