Research class 12 Nechama Sammet Moring Agenda 6


 • Higher rates")


 Dependent Variable Continuous")


 •")


 that is impacted")

 so you can use")


 •")


- Slides: 75
Research class 12 Nechama Sammet Moring
Agenda • 6: 00 -6: 20 check in, lit review lecture • 6: 20 -6: 45 literature review activity • 6: 45 -7: 15 statistics review • 7: 15 -7: 25 break • 7: 25 -8: 00 regression activity • 8: 00 -8: 35 study design pair shares
Literature review • Organizing and synthesizing information • Don’t go down the rabbit hole • Audience: intelligent but uninformed about your topic adult (me) • Considering generalizability
Generalizability: more than just the sample and your population matching
Sampling error • When the sample does not match the population • More likely in small samples • Selection bias is a KIND of sampling error-something is categorically different about people who were included in the sample • Who has landline phones? Who has access to the internet? Could this cause sampling errors in your study of homelessness?
So you have a study…. . • Where was it done? • What was the context? How is the context similar to yours? Different? • How was the intervention similar to your intervention? How was it different? • What was the policy landscape where your study was done? How is it similar to yours? How is it different? • What assumptions are being made by the study authors? How do you feel about these assumptions?
And that study has a sample…. • What were the inclusion criteria? The exclusion criteria? • How is this sample similar to your study population? How is it different? • Think beyond the surface here-rural poverty and urban poverty can have very different impacts on access to social work services, for example, even though both groups are below 50% of the poverty line etc
Instead, what are the take-aways FOR your population? • Differences in barriers • Differences in facilitators • Differences in needs • Differences in policies
A note about racial and ethnic differences CW: Racism • According to science, we are NOT biologically different by race. On average, we have more genetic similarities with people of different races than we do within races. There is more genetic differences within racial groups than outside racial groups. • Race is a social construct…. . with a lot of meaning. • We ARE different in terms of differential exposures to the harms of racism, different likelihoods of being offered a mortgage (even when we make the same salary), different likelihoods of being offered pain medication when we’re waiting in the emergency room with a broken leg, different likelihood of experiencing police brutality etc…these differences matter
Differential exposures to racism • Do the findings from a study with all participants of color apply to your all-white population? Yes, but might need modification • Do the findings from a study with mostly white participants apply to your population of mostly people of color? Yes, but might need modification • Do the findings from a study that doesn’t specify the racial or ethnic identities of the participants apply to your population of whoever? Yes, but think about the inherent assumptions and privileges of a ”color-blind” approach. What else might the authors be missing?
Implications for your literature review • Think critically about how the literature AS A WHOLE applies to your population • What kind of case can you build for your intervention WITH YOUR POPULATION? • What is missing in the literature base, SPECIFIC TO YOUR POPULATION? • And remember that research done on a different group doesn’t automatically mean it won’t work in your group-critical thinking!
Literature review • Integrating the literature • NOT a book report/summary of different studies • Organized by theme • Makes connections across articles • SUMMARIZES what we already know and what we don’t know
Research Question: Should dogs eat squirrels?
Should dogs eat squirrels? : Bad lit review I read three studies about dogs. The first study was by Sam and it talked to 13 squirrels and 20 meatballs who all said that they wanted to be eaten. The methods were that the author looked at all the squirrels and all the meatballs and tried to eat them and it happened in 2016. The next study was by a squirrel and it found that “dogs are mean-butts and I hate those jerks”. It was done in 1997, so it was older. The squirrel’s name was Terri. The last study was by a veterinarian named Dr. Imani Jeffers who looked at several dogs that ate squirrels. She noted that “six dogs experienced vomiting” after eating squirrels. The study included 11 dogs who had eaten squirrels, chipmunks and other small mammals that didn’t run fast enough. I didn’t know that so many dogs actually catch squirrels. Dr. Jeffers’ clinic was in Maine.
Should dogs eat squirrels? : Good lit review Researchers have not yet definitively settled the question of whether dogs should eat squirrels. Though some authors had strong feelings that squirrel-eating was excellent and should be supported, their evaluation is suspect because other food items, such as meatballs, were also included in their analysis (Sam, 2016), a problem called too much foods bias (science-y author, 2014). Other sources that were categorically against squirrel eating also suffered from don’t eat me bias, a common problem in squirrel-conducted research, (other science-y author, 2008) and may have overgeneralized all dogs as jerk-butts (Terri, 1997). A more balanced perspective is offered by Jeffers, who found that approximately half of squirrel eating dogs treated in a veterinary clinic experienced problems (Jeffers, 2011). However, this study had a small sample size and may not be applicable outside of the rural geographic area in which it was conducted. It also suffered from too many foods bias. Therefore, we don’t have the information we need to effectively answer this question, so please give me money for my study, which will have a larger sample size but will use some of Jeffers’ methodology.
Piecing it all together • Index cards and the Jen Masdea System tm • Tracking table or spreadsheet • Big picture focus but evaluate the details of the article to determine whether you can take the article seriously • Don’t use quotes from the article. You’re better than that : >
The Jen Masdea System • For each article, write the MAIN findings/take home messages ONLY on a separate index card as well as the author’s name so you can track it later • Once you’ve prepared your index cards, sort them into piles by theme. This is a lot like grounded coding • Ideas that are interesting but beyond the scope of your paper go onto a card and into your bag for later. It’s ok to put index cards into your bag, but don’t “disappear” findings that contradict your intervention-these are important to address. • Complete a study “grading” sheet for each study you sort, so that when you go through your piles, you can easily determine how much weight to give each study and comment on contradictory findings
Example: Managing disclosures of abuse by research participants with IDD (piles) • Higher rates of sexual violence against people with disabilities higher likelihood of enrolling survivors of violence • Barriers to reporting abuse • Barriers to justice for abuse survivors with IDD (and impact on abuse prevalence) • Research as a safe environment for disclosures (or not) • Appropriate responses by professionals (not researchers) to disclosures • Wildcard but important • Bag for later: LGBTQ people w/IDD completely absent from literature; impact of unaddressed trauma on “functioning”; representation, visibility and feminism/why this isn’t a feminist issue; historical connection between rape, incest and eugenics movement
Further sorting, using the Jen Masdea System • Now that all your literature is in piles, approach each pile and do a further sort. Identify main themes within each pile • For each pile and each theme, refer back to your assignment 2 to think about the quality of the evidence. Are there a lot of studies that agree/show the same thing? Take advantage of all the work you already did evaluating the quality of the evidence. • Write a summary paragraph for each pile. Provide an outline of main findings ACROSS STUDIES and discuss quality of evidence. • Using a bias chart (see handout) will help you assess quality of the evidence. • For each pile, is any information missing? (these are the gaps you want to identify)
Example: Combining, evaluating, providing selective detail, identifying gaps in each pile • Higher rates of sexual violence against people with disabilities higher likelihood of enrolling survivors of violence. COMBINING: There is extensive, high quality evidence showing that people with disabilities experience much higher rates of sexual violence victimization (Swango-Wilson, 2009; Mc. Carthy 2011; Mc. Cormack et al, 2006; Jones et al, 2016). SELECTIVE DETAIL: People with intellectual disabilities are even more likely than their counterparts with other kinds of disabilities to experience sexual violence (Horner-Johnson & Drum, 2006). We know that people with ID are consensually participating in research at higher rates than ever before (Ianoco, 2005). GAPS: While common sense suggests that this higher rate of sexual violence victimization means that researchers who enroll people with IDD in their studies are more likely to encounter research participants who have survived sexual violence, this has not yet been studied. Though some preliminary studies suggest that research participants with IDD view participatory action research as an opportunity to reduce sexual violence in their communities (Northrup et al, 2010), we lack understanding of researchers’ role in responding to sexual violence against people with IDD.
Let’s try it with 2 articles • Using assignment 2, work with a peer to identify themes/categories (piles) and put important findings (only) from your first study onto cards • Use your bags as needed to save interesting but less relevant information for later • Switch and help your peer put findings from her first study onto cards and identify themes/categories for her piles • Sort your cards into piles • If you have time, put findings from your second study onto cards and add these findings to your piles • Summarize each pile • Buy an index card sorter (or some envelopes) and continue your sorting at home
Review: Study types • Qualitative vs. quantitative • If quant: cross-sectional vs longitudinal • If quant and longitudinal: the spectrum of pre-experimental (no comparison group) to quasi-experimental (comparison groups but not randomly assigned) to experimental (comparison groups randomly assigned) • If qual: spectrum from ethnography, phenomenology, traditional qualitative, community based participatory, participatory action research
ntinuum of longitudinal studies from pre-experimental to experimental Pre-experimental • People are compared to themselves (before & after)—no separate comparison group • *no one is randomly assigned, since there is no comparison group Quasi-experimental • There is a comparison group but it is categorically different from the experiment group (ie morning and evening classes) • *group assignment is not random experimental • There is a comparison group and people have an equal chance of being in the experiment group and the control group • *group assignment is random
Spectrum of Qualitative Research Community focused Researcher as community member Researcher focused Researcher as camera Design: Ethnography Data Collection: phenomenology case studies traditional qualitative methods CBPR Participatory action research Observation participant observation interviews: structured, semi-structured, unstructured focus groups photo voice, digital storytelling etc
Kinds of validity (related to measurement, standardized instruments • Face validity: on the surface, does it “look right? ” • Content: how well do the variables I selected to determine if you’re a zombie actually measure if you are a zombie? (represent the concept of zombie-hood) • Criterion: does scoring highly on my zombie scale mean you are more likely to actually be a zombie? (does it accurately “predict” zombie-hood? ) • Concurrent: does scoring highly on my zombie measure correlate with scoring highly on other zombie measures? • Construct: Am I measuring the right things? Do these concepts represent zombiehood?
Review: Reliability (related to measurement, standardized instruments • How much the measure stays the same, the stability and consistency of the measure (Faulkners) • Test-retest-do I score the same tomorrow as I did yesterday (if I havent changed and become undead!) • Equivalent form-my measure gets the same results as an existing measure (but existing might not be appropriate for my population) • Internal: questions measuring the same concept get the same answers • Interobserver: we’d get the same results if we each administered the measure to the same person
Review: Biases In all studies In longitudinal studies • Selection • Instrumentation • Interviewer • Non-random misclassification • Confounding factors (factors that impact the independent and dependent variable) • • History Maturation Recall Testing Regression to the mean Loss to follow up Diffusion of treatment Plus all the biases in column 1
Another way to think about statistical significance: how much pee in your yard stops you from walking to work? % grass 0, 01 1 99 0, 05 5 95 0, 06 6 94 0, 5 % pee 50 50
Identifying analysis methods-and their issues: Family feud • Group yourselves in teams of 4 ish • After we read the abstract out loud, first team to buzz in gets 10 points for identifying the following: • • • Study design Sampling method Analysis method (what was being compared? ) Pros of the analysis method Cons of the analysis method • Each kind of bias you identify also earns 10 points for your team. • You have the mic until you make a mistake, when another team can buzz in • Current issue of NASW’s Social Work Research https: //academic. oup. com/swr/issue
“Tu no eres de aqui”: Latino children’s experiences of institutional and interpersonal discrimination and microaggressions. Cecilia Ayon & Sandy Philbin • Informed by critical race theory and Latino critical perspective, this study examined Latino children's experiences with institutional and interpersonal forms of discrimination in the state of Arizona. Interviews conducted with 54 Latino immigrant parents revealed that Latino children encounter institutional and interpersonal forms of discrimination, including microaggressions. Interpersonal discrimination manifested through verbal abuse in the form of microinsults, microassaults, and physical attacks. Institutional discrimination occurred in schools as teachers minimized children's connection to the Spanish language or culture (microinvalidation), enforced informal “no Spanish in the classroom” policies, and practiced differential treatment toward Latino children. Consequently, parents reported that their children are hyperaware of discrimination, experience emotional distress and social isolation, and demonstrate indicators of internalized oppression. The article ends with a discussion of the implications for social work practice and recommendations for social work intervention.
Perceived microaggressions and mental health in a sample of Black youths experiencing homelessness. Maurice Gattis & Andrea Larson The effects of microaggressions targeted at sexual minorities and racial minorities have been well documented. Lesbian, gay, bisexual, and transgender (LGBT) youths and black youths are more likely to experience homelessness than their heterosexual, cisgender, and white peers, and yet little is known about how microaggressions may affect youths during instances of homelessness. This study examines whether perceived LGBT racial microaggressions and perceived racial microaggressions are associated with depressive symptoms and suicidality in a sample of black youths experiencing homelessness. This study uses a cross-sectional design with structured face-to-face interviews of a convenience sample of 89 black youths (ages 16 to 24 years) experiencing homelessness. Results show that whereas both types of perceived microaggressions are positively associated with depressive symptoms, neither form of microaggression is independently associated with suicidality. Depressive symptoms and suicidality are common experiences among black youths dealing with homelessness, and the perception of microaggressions targeted at sexual or racial minority statuses is associated with depressive symptomology. Results underscore the importance of social workers comprehensively addressing how subtle, pervasive forms of heterosexism, gender normativity, and racism affect mental health outcomes among homeless youths
In pursuit of belonging: acculturation, perceived discrimination and ethnic-racial identity among Latino youths Guided by Bronfenbrenner's ecological systems framework and informed by the rejection-identification model, this study examined the relationship between acculturation, discrimination, and ethnic–racial identity (ERI) searching and affirmation among a sample of Latino youths (N = 830; mean age = 12. 2 years). Results revealed that higher levels of acculturation were associated with lower levels of searching and affirmation. Furthermore, higher perceived discrimination was associated with higher affirmation, but unrelated to searching. Finally, perceived discrimination significantly attenuated the negative associations between acculturation and adolescents’ ERI searching and affirmation. The article concludes with a discussion of practice implications.
A brief high school prevention program to decrease alcohol usage and change social norms This study assessed the effectiveness of Refuse, Remove, Reasons (RRR), a universal classroom-based substance abuse prevention program for urban and suburban high school students. A total of 1, 352 adolescents were part of either a treatment (n = 678) or a comparison group (n = 674). The study evaluated the influence of implementing RRR in decreasing alcohol use, increasing perceived risk of drug use, decreasing social norms drug use, and increasing perceptions about negative consequences of drug use. Participants were assessed at baseline and treatment exit. One-way between-groups analyses of covariances were used to detect significant differences between treatment and comparison groups, using the pretest as a covariate. Findings indicated that RRR significantly reduced getting drunk from alcohol, decreased social norms and acceptance of alcohol and cigarettes, and increased perceptions about negative consequences of drug use for the treatment group compared with the comparison group. Results support school -based prevention models for reducing alcohol use and changing social norms for high school youths.
Issues with statistical tests • Descriptive statistics: doesn’t show statistical significance, doesn’t tell you why, just an overview of numbers • Correlation (2 continuous variables)-needs a rationale, never shows causation, very sensitive to confounding factors • Chi square-binary variables, is it fair to use the dominant group as the expected? • T-tests-binary groups (multi-racial people exist, non-binary people exist etc) focus on averages ignores outliers • ANOVA, same as t-tests, though more groups can be included • Odds ratio-does not predict, binary groups AND binary outcomes (no shades of gray)
4 basic types of statistical tests: Description • Mean, standard deviation • Median, Mode • Percentage, frequency Correlation • Pearson’s correlation Comparison • Student’s t tests • Chi-square tests • ANOVA • Odds ratios Prediction • OLS regression • Logit regression
Boston Public Schools Data http: //www. bostonstudentrights. org/the-school-to-prisonpipeline/ http: //www. youthonboard. org/
What statistical test to pick • Are you comparing groups or individual variables? • How many groups? • What kind of variable is the independent variable? • What kind of variable is the dependent variable?
What statistical test to pick Independent Variable Continuous Nominal (2 groups) Dependent Variable Continuous Nominal (2+ Continuous groups) Nominal (2+ groups) Nominal You can use: correlation t-tests (paired if you are comparing group members to themselves (ie before and after a class); independent if you are comparing unrelated groups) ANOVA Odds ratio Chi square (x 2) to compare observed to expected
In School Vs Out of School Suspensions for Nonviolent, non-criminal offenses: Observed to expected
Students’ t-test: Why use it? • Assesses whether the means of 2 groups are statistically different from each other • Appropriate whenever you want to compare the means of 2 groups • Requirements: • 2 binary groups (and not more than 2) • Continuous variable
“Student’s t” test: What are you looking for?
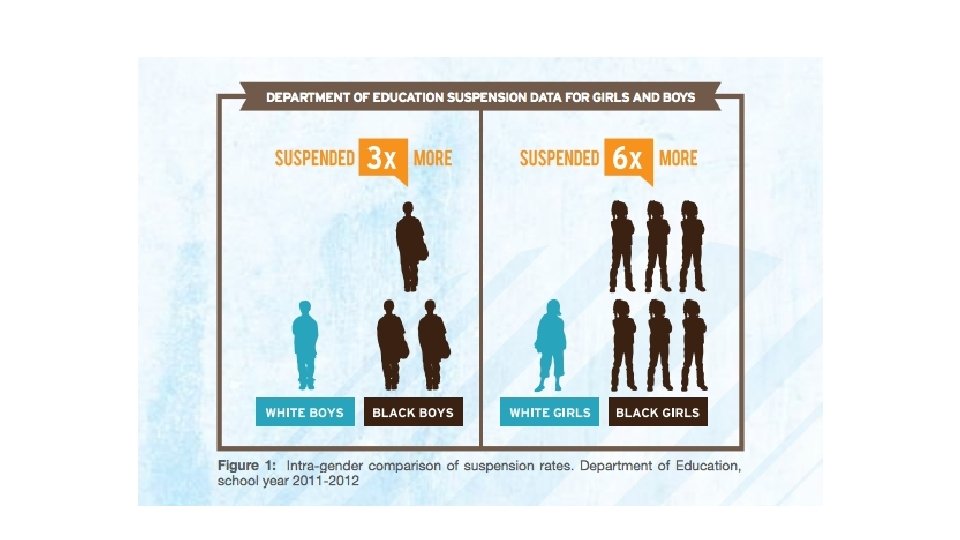
• In 2011 -2012, black girls made up 61 percent of all girls disciplined in Boston schools, while comprising only 28 percent of district enrollment. White girls, on the other hand, who represent 15 percent of the school district, made up only 5 percent of the girls disciplined. • Of the total number of girls expelled from Boston schools in 2011 -2012, 63 percent were black students. No white girls were expelled that year. During the same timeframe, black girls were suspended at school at almost 12 times the rate of white girls in Boston Public Schools. • Girls who are suspended face a significantly greater likelihood of dropping out of school and are more likely to have contact with the juvenile justice system, face unemployment or engage in low-wage work, the report says. All of which can have particularly negative impacts for women
Odds ratios: how likely are you to be suspended if you are Black (compared to white) • Not a guarantee that you will be suspended if you have the “condition” (identity) • Looking at “likelihood” of suspension using statistical probability • how many times more likely are you to be suspended if you have the ”condition” • Binary groups: Black and white • Binary, nominal variable (suspended or not suspended)
Odds ratios: How to interpret them OR=1. 5*** 1. 5 times more likely… OR=12. 5*** Almost 13 times more likely… OR=0. 50*** Fifty percent less likely… OR=O. 89*** 11 percent less likely…
Regression • Predicts impacts of several independent variables on ONE dependent variable (outcome) • Useful for examining complex outcomes that are impacted by multiple factors • Creates a “model” of different factors—and their interactions—on the dependent variable
The complex sink jam
A lot of different factors go into every toddler -created sink jam
Regression • Prediction vs comparison: what will happen if I throw in a toothbrush? • What will happen if I throw in a hairbrush?
Regression analysis creates a model that accounts for my toothbrush, my hair lotion and several other factors in analyzing the impact on the sink jam (dependent variable)
Regression basics • Usually done with software • You still need to pay attention to bias (validity) and generalizability • Sample must be representative of the population
Regression overview • You have a big complex outcome (dependent variable) that is impacted by a lot of factors at once (independent variables) • Regression creates a model that lets you know how much of each independent variable impacts the dependent variable. • Then, it lets you know how much of the variation in the dependent variable is explained by the independent variables you choose. • If the independent variables are continuous, you use linear regression. If they are nominal, you use logistic regression. • Regression is about predicting. It’s the psychic table at Statsapalooza
Choosing the right regression • If your independent variables are CONTINUOUS - use LINEAR regression • If your independent variables are BINARY, NOMINAL use LOGISTIC regression
Quick math notes • Sometimes variables are “dichotomized” (made binary) so you can use logistic regression (i. e. white vs. non-white; experienced 1 -3 vs. more than 3 instances of involuntary hospitalization etc) • Logistic regression gives you a log odds, which is like an odds ratio • Everything is less effective with smaller samples. Lower degrees of freedom (d. f. ) = smaller sample size = less significant • Moving on…
Example: life expectancy and serious mental illness • We have good evidence that people with SMI have much higher rates of preventable negative health outcomes and live an average of 25 years less than their peers without SMI • Factors that might be involved: lack of access to health care; lack of social supports isolation, lack of practical supports for getting health care; discrimination in care; social stigma unemployment financial inequity and can’t afford needed medical treatment; unstable housing; involuntary hospitalization; medication side effects; toxic stress • Other factors that might be important: race (and experience of racism or discrimination); pet ownership; gender; violence victimization
Now let’s predict how responsible each of these factors are for shortened life expectancy • Each candy represents a factor you are testing • Throw all your candy into the pot, stacked up • For every one unit of candy (the factor), how much does the chance of dying early increase? In other words, how much does your line change when you add in the candy? • How statistically significant is this increase? • What % of the different life expectancy does each factor explain? • Note that the impacts are different for each factor-candies are different shapes and sizes. Some factors are more important than others. Some don’t change the formula at all
Inter-related factors • Changing the amount of peer support a person gets will change their life expectancy by. 03, all on its own • BUT! Peer support reduces isolation, which in turn reduces comorbid depression, so the coefficients for depression and isolation also change. So do the coefficients for increased self-determination and self-efficacy • Examining these additional changes help un-tangle relationships among factors and demonstrate causality
Linear Regression example • # of Samira farts per hour is the dependent variable (outcome) • If we were doing linear regression, the independent variables are continuous and include # of pieces of kibble she eats, # of beans she eats and # of meatballs she eats • We do linear regression and determine that for every additional piece of kibble she eats, her # of farts per hour go up by. 5. For every additional bean she eats, her # of farts per hour go up by 2. 2, and for every meatball she eats, her # of farts per hour go up by 1. • However, Samira is a complicated beast, and kibble, bean and meatball consumption only explains 40% of the variation in her farts per hour
Linear regression terms • You get an overall r square, which is a decimal that tells you the percent of the variation in number of farts (dependent variable) that is explained by the independent variables you choose. • For each independent variable, you get: • A coefficient-this is the actual number of additional farts per hour that you get for each unit of the dependent variable (ie how many new farts adding one bean would give you) • A t-statistic (meaningless but reported in your descriptive sentence) • A p value, which tells you whether the difference is statistically significant • Note that the coefficient for each independent variable has been adjusted for the other independent variables you choose
Linear regression output example • Dependent variable = # of Sam farts per hour • R squared = 0. 23 • Independent variables • # of kibbles-coefficient =0. 5, p=0. 005 • # of beans-coefficient=2. 2 p=0. 005 • # of meatballs-coefficient=1 p=0. 0001
Logistic regression example • Likelihood of Sam farting is the dependent variable (outcome) • If we were doing logistic regression, the independent variables are nominal and include whether she’s been walked in the last 2 hours (yes/no), whether I decide it’s her birthday and feed her accordingly (yes/no) and whether I have important company over (yes/no) • Logistic regression essentially generates an odds ratio for each independent variable • We do logistic regression and determine that if Sam’s been walked in the last 2 hours, the odds of her farting are 0. 7. If it’s her birthday, her odds of farting are 3. 6, and if I have company over I want to impress, her odds of farting are 8. 1. If all 3 conditions are met (been walked, birthday and company) the overall odds of her farting are 12. 2 • However, Sam is a complicated beast, and walks, birthdays and company only explains 20% of the variation in how likely she is to fart
Logistic Regression output • You get an overall r square, which is a decimal that tells you the percent of the variation in likelihood of farting(dependent variable) that is explained by the independent variables you choose. • For each independent variable, you get: • An odds ratio (called exp(b) is spss)-this is the actual adjusted odds ratio of likelihood of farting if this condition is met (ie if Sam HAS been walked or HAS had a birthday) • A p value, which tells you whether the difference is statistically significant • Note that the odds for each independent variable has been adjusted for the other independent variables you choose. So in this model, the odds of Sam farting if she has been walked recently, adjusted for company and birthdays, is 0. 9
Logistic regression output example • R square is. 08 • Been walked OR=. 5 p=0. 0001 • It’s her birthday OR=2. 6 p=0. 005 • We have company OR=12. 1 p=0. 005
For your research project • Your intervention has a goal • The goal has outcomes and indicators • You’ll need to collect data to see if the indicators are being achieved • You need a research design to organize your data collection and make comparisons (if needed) • Then, you’ll have a bunch of data you’ll need to analyze and make sense of • You need an analysis strategy • Remember, you wont evaluate every aspect of your program, and that’s ok
Outcomes • Can be measured qualitatively, quantitatively or both • Need to be measurable, observable, specific, time-framed (MOST) • Important to evaluate the right outcomes (you don’t know what you don’t know) • Outcomes of importance might be different for different stakeholders (i. e. is what clients want the same as what their parole officers want? )
Goals, Outcomes, Indicators, Data Collection • Goal a broad thing you want to happen (for example decreased parental stress). • Outcome/indicator a very specific, measurable benchmark, or way to know that you have achieved this goal (ie 20% drop in self-reported symptoms of stress, such as irritability, sleeplessness etc 30 days after completing the intervention). • Data collection how you will find out whether the indicator is happening (ie monthly surveys of parents involved in your program that ask about stress symptoms). • broad goal- a specific way of measuring progress towards the goal (an indicator)- a way of getting the information you need to measure whether the indicator has been met or not (data collection).
Logic models • Graphic portrayal depicting essential elements of program • How goals/objectives link to elements • Link to short-term process measures • Measurable indicators of success • Link to longer-term outcome measures • Measurable indicators of success
Example logic model: Sam training Input s Goal Activities Short-term outcomes and indicators mid-term outcomes indicators Long term outcomes & indicators Sam increases her Learning bond with Nechama by the look 10% and eventually command looks to N for direction in 90% of high interest situations Sam becomes familiar with the command Sam maintains eye contact for 30 sec Sam utilizes the command in high interest situations Sam looks at N for 1 min while squirrel passes Sam relies on N and the command rather than her prey drive 90% of the time Sam looks at N for 9 out of 10 squirrels Nech ama Sam’s safety (defined Long leash as likelihood of getting recall lost or hit by car) practice improves through solid recall Sam enjoys her long leash and the “game” of running towards N for treats Wags when sees long leash Sam obeys the recall command in low interest situations 50% recall Sam obeys the reall command in high interest situations 90% recall Sit for. 5 sec Sit for 10 sec Sit for 1 min treats Guests to our home feel more comfortable because Sam jumps on them less and sits Sit-stay practice
More example of intervention definition and goals, measurement • Meditation classes for kids with behavioral health challenges and their parents to provide support. Measured by decreased parental stress, increased reported support and use of positive behavior management techniques by parents, less child abuse over time; and by increased use of coping skills by kids, less incarceration over time • Designing an app for people with depression to break up large tasks into steps and provide reminders. Measured by client satisfaction with the app, increased feelings of support, self-efficacy for managing life tasks, despite the biological impacts of depression on motivation, increased skills, decreased job loss over time
Example evaluation questions • Meditation classes for kids with behavioral problems and their parents: • Process: Do parents and kids feel welcome at the classes? Do they want to be there? Are they making friends and feeling supported? Are the teachers actually teaching the content (fidelity)? Can they teach? • Outcome: Are kids using the meditation skills to manage anger? Do they have fewer negative behaviors? Has parental stress levels changed? Over time, is there a reduction in child abuse rates and/or incarceration rates?
For your research project • Your intervention has a goal • The goal has outcomes and indicators • You’ll need to collect data to see if the indicators are being achieved • You need a research design to organize your data collection and make comparisons (if needed) • Then, you’ll have a bunch of data you’ll need to analyze and make sense of • You need an analysis strategy • Remember, you wont evaluate every aspect of your program, and that’s ok
Mechanism of action and direction of association • Which came first? • Any confounders? (I didn’t take prenatal vitamin s because I couldn’t afford them (or food) my baby was low birth weight? ) • Unless the RESEARCH specifically evaluates mechanism of action (how it works) or direction, we just don’t know. • Avoid assumption