Class limit Class Boundaries Class Mark Class Limit

Ø Class limit, Class Boundaries, Class Mark

Class Limit: Class limit are defined as the number and values, the variables which describe the smaller number is the lower class limit and larger number is upper class limit, class limit should be well defined and there should be no overlapping. Class from these can be obtained by taking the average of upper class limit of one class and lower class limit of next class. , Class Boundaries: Lower class boundaries can be obtained by subtracting half a unit of measure from the lower class limit. Upper class Boundaries: Upper-class boundaries can be obtained by adding half a unit of measure from the upper class.

For example 55 -57 58 -60 61 -63 Class bounteous formula: 58 -57=1/2 =0. 5 -55, 0. 5+57

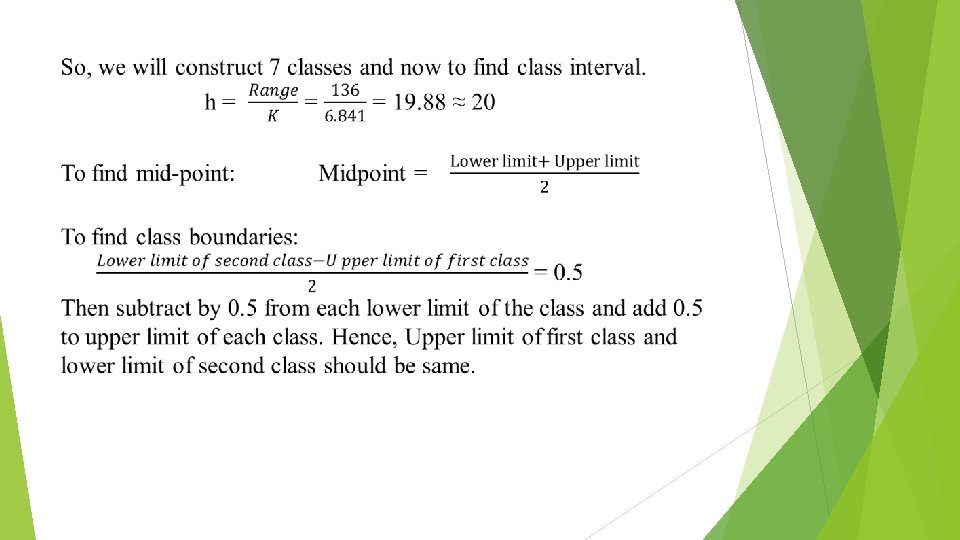
Class mark: Class Mark also called as class mid point which divides each class into two parts. In practice, it is obtained by dividing either sum of the lower and upper class limit of the class or the sum of the lower and upper boundaries of the class. Classes interval: The difference between upper and lower class boundary of a class is called interval or class interval of a class. And we represent this as h.

Class mark 10 -19 10+19=/2=14. 5 20 -29 20+29=/2=24. 5 40 -49 40+49=/2=44. 5

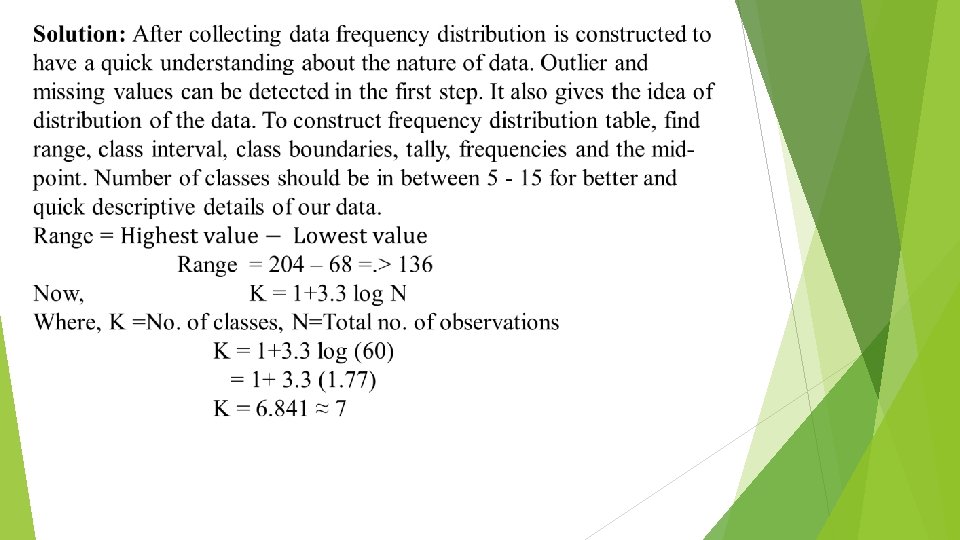
Question 2: These data represent the record high temperatures for each of the 60 states. Construct a grouped frequency distribution for the given data. 106 107 76 82 109 107 115 93 187 95 123 125 111 92 86 70 126 68 130 129 139 115 128 100 186 84 99 113 204 111 141 136 123 90 115 98 110 78 185 162 178 140 152 173 146 158 194 148 90 107 181 131 75 184 104 110 80 118 82

Class interval Class boundaries Tally Frequency Midpoint 68 -87 67. 5 -87. 5 IIII 10 77. 5 88 -107 87. 5 -107. 5 IIII III 13 97. 5 108 – 127 107. 5 -127. 5 IIII 15 117. 5 128 - 147 127. 5 -147. 5 IIII 9 137. 5 148– 167 147. 5 -167. 5 IIII 4 157. 5 168 -187 167. 5 -187. 5 IIII II 7 177. 5 188 – 207 187. 5 -207. 5 II 2 197. 5 Total frequencies 60
- Slides: 9