Process Kinetics Important Process and their Kinetics Enzyme


 + O 2 biomass +")

 • RQ")


: Blackman equation: μ = μm if")

![Tessier equation: μ = μm [1 - exp(-KCS)] μm = 0. 9 per h](https://slidetodoc.com/presentation_image_h2/10d578da04e7b731c544bf13ea8f2353/image-26.jpg "Tessier equation: μ = μm [1 - exp(-KCS)] μm = 0. 9 per h")


 μ= μm")


 Monod model does not model")


 Constitutive Expressed")


")


 on growth Rate ignoring m. S S µ")
 on growth Rate Sm = critical substrate concentration")
 on growth Rate The negative specific growth rate")


- Slides: 57
Process Kinetics
Important Process and their Kinetics • Enzyme kinetics • Fermentation kinetics
Microbial Cell Growth Microbial growth implies an increase in cellular constituents - leads to rise in cell number when microorganisms reproduce by processes like budding or binary fission - ability to reproduce is a major criterion to determine if a microbe is alive or not - results when cell become longer/larger Population growth is used to analyze the growth curve of a microbial culture
Microbial Cell Growth • Mode of Growth • Selective assimilation of nutrients and convert into and also include Chemical rearrangement of protoplasmic material characteristic of the particular organism • Production of an increased amount of nuclear substance and cell division
Microbial growth summary • Energy + nutrient biomass and products • Energy (light or chemical): phototrophs and chemotrophs • Nutrient (carbon source): autotroph and heterotroph
Stoichiometry of growth • Carbon + Nitrogen + (P&vitamins&minerals) + O 2 biomass + CO 2 + H 2 O + products + heat • CHl. Om + βNH 3 + O 2 CHa. Ob. Nc + CHp. Oq. Nr + H 2 O + CO 2 CHl. Om : element composition of the carbon sources CHa. Ob. Nc: element composition of biological materials CHp. Oq. Nr element composition of extracellular products (All defined as containing 1 gram atom of carbon)
Atomic balance • CHl. Om + βNH 3 + O 2 CHa. Ob. Nc + CHp. Oq. Nr + H 2 O + CO 2 C: =1+ + H: l + 3β = a +1+ p + 2 O: m + 2 = b + β + q + + 2 N: β = c + r
Respiratory coefficient and degree of reductance • Respiratory quotient or coefficient (RQ) • RQ = rate of CO 2 production/rate of O 2 consumption • Degree of reductance ( ): the number of equivalents of available electrons per gram atom of C. • C: 4, . H: 1, O: -2, N: -3: P: 5 • H 2 O, CO 2, NH 3=0, glucose = 24.
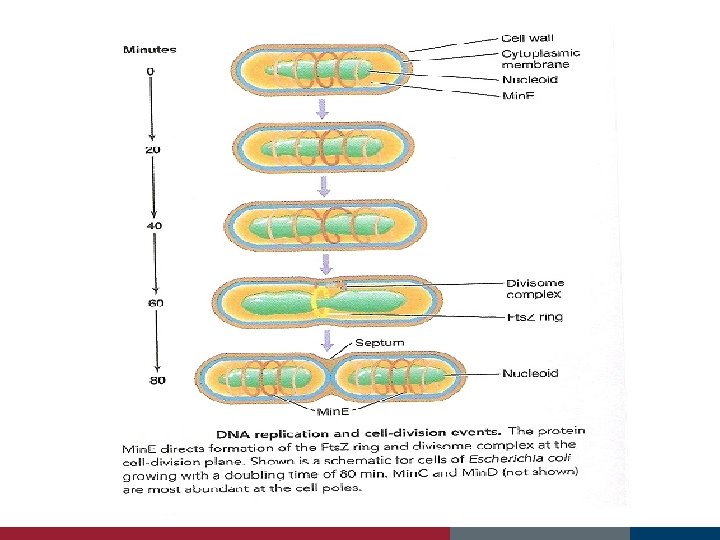
Cell Growth and Binary Fission Fts proteins Min E proteins assist in the location of the actual cell midpoint forms in the space between the duplicated nucleoids
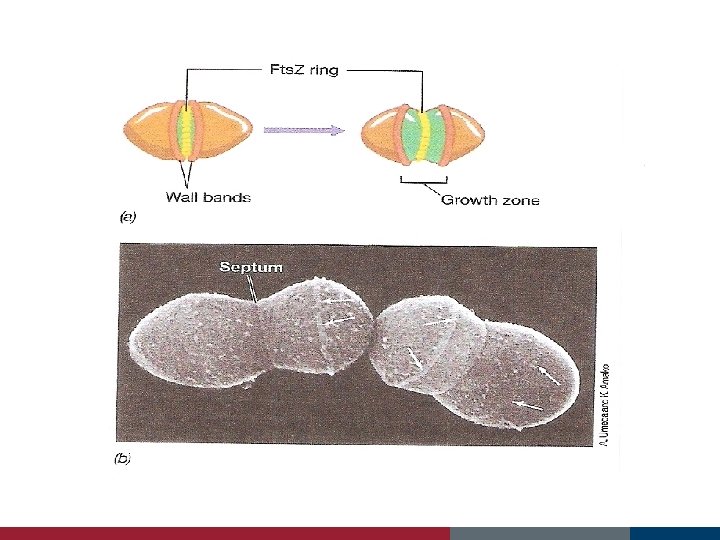
The Fts. Z ring and cell division forms a ring around the cylinder in the center of the cell
2 copies of chromosomes are pulled apart to each daughter cell
Microbial Growth Kinetics - describe how the microbe grows in the fermenter - important to determine optimal batch times - growth of microbes can be broken down into 4 stages; accelerated death phase LAG PHASE LOG/EXPONENTIAL PHASE STATIONARY PHASE DEATH PHASE decelerated growth phase Lag Phase accelerated growth phase Cells have just been introduced into a new environment Cell growth is minimal Cell is synthesizing new components – no cell division takes place - cell is old and depleted of ATP - medium may be different from the one the microorganism was growing - microorganism have been injured and require time to recover
LOG/EXPONENTIAL PHASE Cells have adjusted to their environment Rapid growth takes place Cell growth rate is highest in this phase At some point, cells growth rate level off and become constant STATIONARY PHASE Cell growth rate has leveled off and become constant Number of cells multiplying equals the number of cells dying - nutrient limitation - aerobic organism are limited by oxygen availability - population growth cease due to the accumulation of toxic waste products DEATH PHASE Decline in the number of viable cells
Log/Exponential Phase The rate of increase in biomass is correlated with the specific Growth rate µ and the biomass concentration X (g/L), whereas the Rate of sincrease in cell number is correlated with µ and cell density N (1/L) d. X = µ • X dt or d. N = µ • N dt specific growth rate, µ, 3 parameters : the concentration of limiting substrate S the maximum growth rate µmv the substrate-specific constant Ks µ = µm ___S___ Ks + S Monod equation Ks substrate concentration at which half the maximum specific growth rate is obtained (µ = 0. 5 µm ) - equivalent to the Michaelis constant in enzyme kinetics
Growth Approximation
Approaches to modeling cell growth: Unstructured Models Structured Models (cell population is treated as single component) (cell population is treated as a multicomponent system) Nonsegregated Models Segregated Models (cells are treated as homogeneous) (cells are treated heterogeneous)
Approaches to modeling cell growth: Unstructured Nonsegregated Models Structured Segregated Models (cell population is treated as single component, and cells are treated as homogeneous) (cell population is treated as a multicomponent system, and cells are treated heterogeneous) Simple and applicable to many situations. Most realistic, but are computationally complex.
Unstructured, nonsegregated models: Monod model: μ= μm C S Most commonly used model for cell growth KS + C S μ : specific (cell) growth rate μm : maximum specific growth rate at saturating substrate CS : substrate concentration KS : saturation constant (CS = KS when μ = μm / 2) concentrations
Unstructured, nonsegregated models: Monod model: μ= Most commonly used model for cell growth μm C S KS + C S μm = 0. 9 per h Ks = 0. 7 g/L
Assumptions behind Monod model: - One limiting substrate - Semi-empirical relationship - Single enzyme system with M-M kinetics being responsible for the uptake of substrate - Amount of enzyme is sufficiently low to be growth limiting - Cell growth is slow - Cell population density is low
Other unstructured, nonsegregated models (assuming one limiting substrate): Blackman equation: μ = μm if CS ≥ 2 KS μ = μm C S 2 KS Tessier equation: Moser equation: μ = μm [1 - exp(-KCS)] μ = μm C S n KS + C S n Contois equation: μ = μm C S KSX CX + CS if CS < 2 KS
Blackman equation: μ = μm μ= if CS ≥ 2 KS μm C S 2 KS This often fits the data better than the Monod model, but the discontinuity can be a problem. if CS < 2 KS μm = 0. 9 per h Ks = 0. 7 g/L
Tessier equation: μ = μm [1 - exp(-KCS)] μm = 0. 9 per h K = 0. 7 g/L
Moser equation: μ = μm C S n When n = 1, Moser equation describes Monod model. KS + C S n μm = 0. 9 per h Ks = 0. 7 g/L
Contois equation: μ = μm C S KSX CX + CS Saturation constant (KSX CX ) is proportional to cell concentration
Extended Monod model: KS + CS – CS, min μ (per h) μ= μm (CS – CS, min) Extended Monod model includes a CS, min term, which denotes the minimal substrate concentration needed for cell growth. μm = 0. 9 per h Ks = 0. 7 g/L CS, min = 0. 5 g/L
Monod model for two limiting substrates: μ= μm CS 1 CS 2 KS 1 + CS 1 KS 2 + CS 2
Monod model modified for rapidly-growing, dense cultures: Monod model is not suitable for rapidly-growing, dense cultures. The following models are best suited for such situations: μ= μm C S KS 0 CS 0 + CS μ= μm C S KS 1 + KS 0 CS 0 + CS where CS 0 is the initial substrate concentration and KS 0 is dimensionless.
Monod model modified for substrate inhibition: μ (per h) Monod model does not model substrate inhibition. Substrate inhibition means increasing substrate concentration beyond certain value reduces the cell growth rate.
Monod model modified for cell growth with noncompetitive substrate inhibition: μm μ= (1 + KS/CS)(1 + CS/KI ) μm C S = KS + CS 2/KI + KS CS/KI If KI >> KS then μ= μm C S KS + CS 2/KI where KI is the substrate inhibition constant.
Monod model modified for cell growth with competitive substrate inhibition: μ= μm C S KS(1 + CS/KI) + CS where KI is the substrate inhibition constant.
Monod model modified for cell growth with product inhibition: Monod model does not model product inhibition (where increasing product concentration beyond certain value reduces the cell growth rate) For competitive product inhibition: μ= μm C S KS(1 + Cp/Kp) + CS For non-competitive product inhibition: μ= μm (1 + KS/CS)(1 + Cp/Kp ) where Cp is the product concentration and Kp is a product inhibition constant.
Monod model modified for cell growth with product inhibition: Ethanol fermentation from glucose by yeasts is an example of non-competitive product inhibition. Ethanol is an inhibitor at concentrations above nearly 5% (v/v). Rate expressions specifically for ethanol inhibition are the following: μ= μm C S (KS + CS) μ= μm C S (1 + Cp/Cpm) exp(-Cp/Kp) (KS + CS) where Cpm is the product concentration at which growth stops.
Monod model modified for cell growth with toxic compound inhibition: For competitive toxic compound inhibition: μ= μm C S KS(1 + CI/KI) + CS For non-competitive toxic compound inhibition: μ= μm (1 + KS/CS)(1 + CI/KI ) where CI is the product concentration and KI is a constant to be determined.
Monod model extended to include cell death kinetics: μ= μm C S KS + C S where kd is the specific death rate (per time). - kd
Limitations of unstructured non-segregated models: • No attempt to utilize or recognize knowledge about cellular metabolism and regulation • Show no lag phase • Give no insight to the variables that influence growth • Assume a black box • Assume dynamic response of a cell is dominated by an internal process with a time delay on the order of the response time • Most processes are assumed to be too fast or too slow to influence the observed response.
Product formation kinetics • Classified based on the relationship between product synthesis and energy generation in the cell – Growth associated – Non-growth associated – Mixed-growth associated
Products • Growth-associated § produced at the same time as cell growth – constitutive enzymes (ones that are normally present) • glucose isomerase – metabolic intermediates • pyruvate, citrate, acetate • Non-growth-associated § takes place during the stationary phase (m=0) – secondary metabolites • antibiotics • Mixed - growth associated § takes place during growth and stationary phases – metabolic byproducts • lactate, ethanol – secondary metabolites
Product generation X, P Time Growth-associated X, P Time Mixed-growth associated Non-growth associated
Product Formation • Growth-associated products - produced simultaneously to growth (exponential, decline) Constitutive Expressed Enzyme § Substrate Utilization enzymes § • Non growth associated - takes place during stationary phase qp= constant Antibiotics § RDX degradation §
Product Formation - cont • Mixed-growth-associated • Luedeking-Piret Equation § = 0 non-growth associated § b = 0 only growth associated § = YP/X • Examples § Lactic acid fermentation § Xanthan gum production
Microbial Growth Maintenance Coefficient 1 mole of ATP generated during catabolism allows • theoretically → synthesis of 32 g cells • in praxis → 10. 5 g cells The maintenance coefficient (ms) is the reason for 2/3 being “wasted” 1. Substrate transport into cell (e. g. against diffusion gradient) 2. Osmotic work 3. Motility 4. Intracellular p. H 5. Replacement of thermally denatured proteins (↑ T → ↑ ms) 6. Leakage of H+ ions across membrane (uncoupling) S (mg) ms = X (mg) • time (h) ms influences Y, μ and the metabolic activity of the cells and is thus important to be considered in bioprocesses.
Effect of Maintenance Coefficient on Growth Rate What is maintenance coefficient? The energy supply rate needed to maintain the life functions of a non growing cell. Units? strictly speaking: mol ATP/ cell/ h mostly used: g substrate / g biomass / h = (h-1)
Effect of Maintenance Coefficient on Growth Rate What does the maintenance coefficient (m. S) affect? • ms is the reason for Y not being constant. á ms �Y hence á ms �u Why? Because some substrate is taken up just for maintenance, not for growth. • Effect is more apparent in slow growing cultures than in fast growing cultures. • Slow growing cultures can have a very low Y. m. S (g. S/g. X/h) * Ymax (g. X/g. S) = Decay rate (h-1)
Effect of maintenance coefficient on growth rate Effect of m. S on Y? Y is the observed yield coefficient. The maximum yield coefficient Ymax is approached only when m = mmax Ymax is one of four growth constants
Effect of maintenance coefficient on growth rate m. S and Ymax can be combined: m. S (g. S/g. X/h) * Ymax (g. X/g. S) = Decay rate (h-1) The Pirt equation of growth includes all four growth constants: S µ = µmax * ---- - m. S *Ymax S + k. S
Effect of maintenance coefficient on growth rate ms the respiration u = (v – m. S) *Ymax S u = ( vmax * ---- - m. S) * Ymax S + k. S S µ = Ymax * vmax * ---- - m. S *Ymax S + k. S S µ = µmax * ---- m. S *Ymax S + k. S substrate uptake activity used to just stay alive
Effect of Maintenance Coefficient (m. S) on growth Rate ignoring m. S S µ = µmax * -----S + k. S µ (h-1) 0 S(g/L) including m. S S µ = µmax * ---- - m. S *Ymax S + k. S And 5151
Effect of Maintenance Coefficient (m. S) on growth Rate Sm = critical substrate concentration growth is zero µ (h-1) m. S. k. S. Ymax sm= ---------umax- ms. Ymax 0 S(g/L) Sm
Effect of Maintenance Coefficient (m. S) on growth Rate The negative specific growth rate (µ) observed in the absence of substrate (when S = 0) (cells are starving, causing loss of biomass over time) µ (h-1) 0 S(g/L) - m. S*Ymax is the decay rate m. S*Ymax
Light Illumination Effect • Oscillatoria agardhi Gomont § (Post AF, R de Witt, LC Mur, J. Plank. Res. , 7 (1985) 487 -495)
Temperature effect • Modified Arhenius Model
Temperature Effect Classification of Microorganism
• Questions?