Pressure Volume Temperature Relationship of Pure Fluids Volumetric


- Slides: 31
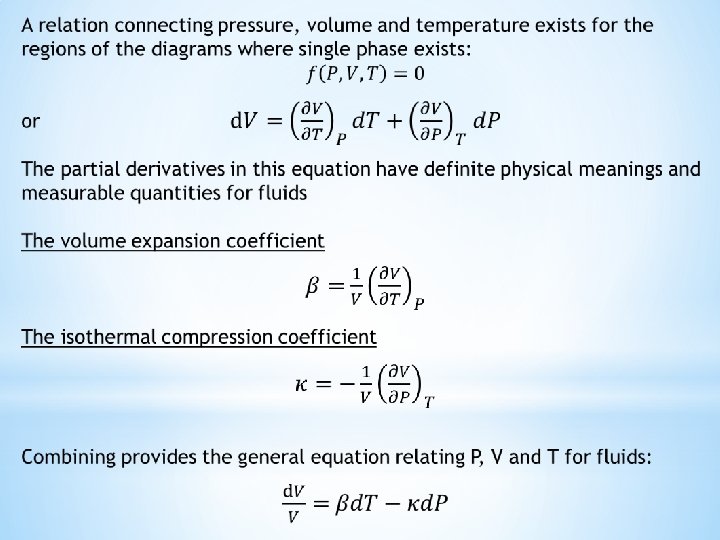
Pressure – Volume – Temperature Relationship of Pure Fluids
Volumetric data of substances are needed to calculate thermodynamic properties such as internal energy and enthalpy, from which the heat and work requirements of processes are obtained Understanding the P-V-T behavior of pure substances allows the engineer to make accurate estimations to the changes in properties accompanying their state changes Pressure, volume and temperature are experimentally controllable properties that are connected by equation of state For ideal gas A pure substance can have as many as 3 phases coexisting at the same conditions: gas, liquid, solid P-V-T behavior of any substance can be experimentally obtained and represented in the form of phase diagrams
The word fluid covers both gases and liquids, any gas and any liquid is a fluid A phase is considered a liquid if it can be vaporized by reduction in pressure at constant temperature A phase is considered a gas if it can be condensed by reduction of temperature at constant pressure Vapor is the preferred term for gas when the gaseous phase is in equilibrium with the corresponding liquid or solid, although there is no significant physical or chemical difference between a vapor and a gas Vaporization curve in a P-T diagram of a pure substance seperates vapor and liquid phases upto a critical temperature and pressure where the curve ends Above the critical temperature and/or critical pressure, fluid is the preferred term, because there is no meaningful distinction between liquid/vapor/gas
Pressure – Temperature diagram of water It is convinient to call the phase below critical pressure the gas phase and the gas phase below critical temperature the vapor phase which can be condensed to liquid
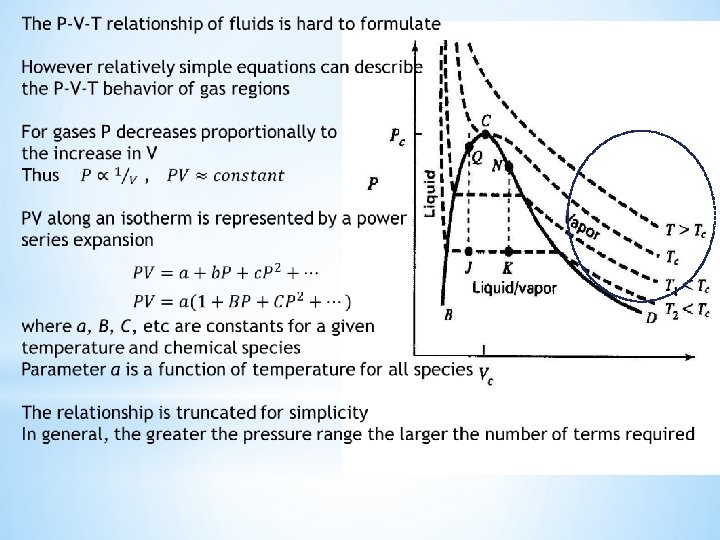
Pressure – Volume diagram of a pure fluid Isotherms greater than the critical temperature do not cause phase changes and therefore are smooth Isotherms lower than the critical temperature consist of three distinct regions: vapor, liquid-vapor, liquid • At the horizontal sections which represent the phase change between vapor and liquid, the constant pressure is the vapor pressure • Ratio of liquid and vapor phases can be obtained by the lever rule • The curve B-C represents saturated liquid • The curve C-D represents saturated vapor • Isotherms in the liquid region are steep because liquid volumes change little with large changes in pressure • The horizontal sections of the isotherms get gradually shorter with increasing T, approaching point C • The liquid and vapor phases have the same properties at the horizontal inflection point at C
Temperature - Volume diagram of a pure fluid Temperature increase is proportional to volume except the phase change region
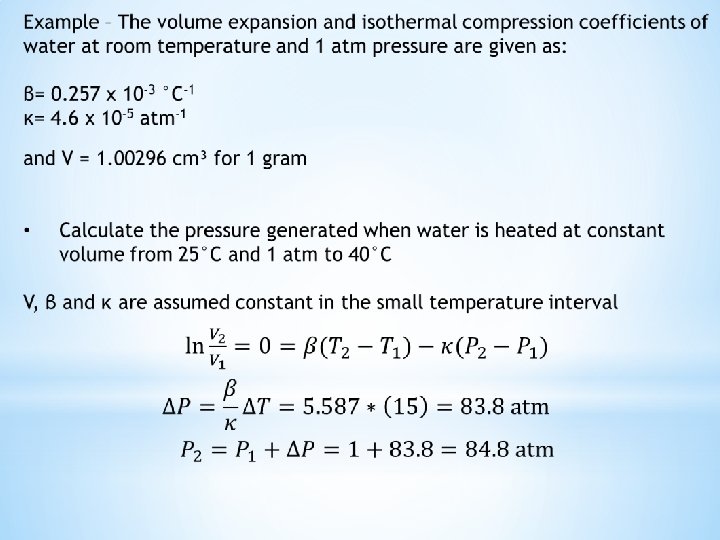
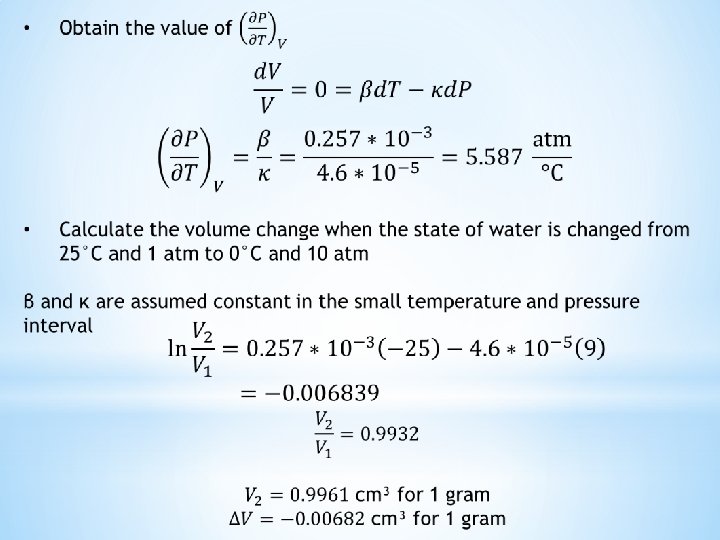
The isotherms for the liquid phase on the left side of the P-V and T-V diagrams are steep and closely spaced which means both volume expansion and isothermal compression coefficients of liquids are small A useful idealization known as incompressible fluid is employed in fluid mechanics for a sufficiently realistic model of liquid behavior The volume expansion and isothermal compression coefficient of the incompressible fluid are zero so it cannot be described by an equation of state relating V to T and P β and κ are weak functions of temperature and pressure for real liquids Thus error introduced by taking them constant is low for small changes in T and P
Data taken for various gases at a specific constant temperature show that P-V plots have the same limiting value of PV/T as P 0 T=273. 16 K a is the same for all gases! This remarkable property of gases helped scientists establish a temperature scale that is independent of the gas used as thermometric fluid: where R denotes the universal gas constant where the t denotes the value of the triple point of water Thus Kelvin or ideal gas temperature scale established throughout the temperature range for which limiting values of PV as P 0 are experimentally accessible
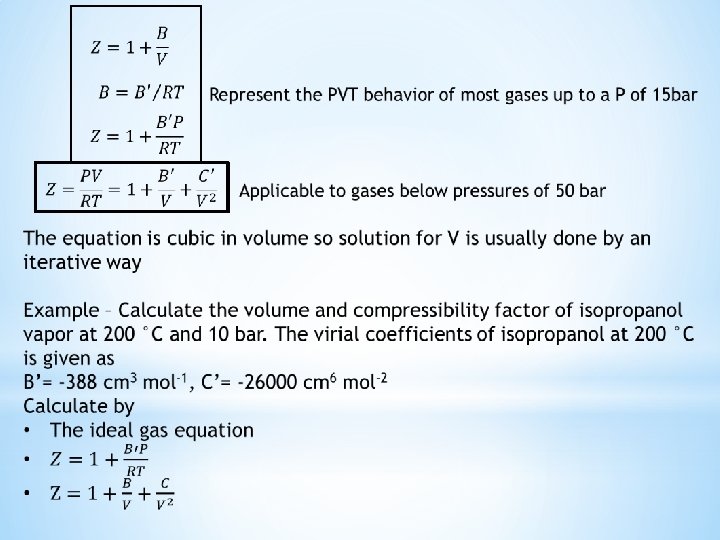
Constant a is replaced by RT with the establishment of ideal gas temperature scale where the ratio PV/RT, Z is called the compressibility factor An alternative representation of Z: B, C, D, etc called virial coefficients represent the interaction between pairs of molecules, three-body interactions, four-body interactions respectively Contributions to Z of the higher-ordered terms fall off rapidly As the pressure of a real gas is reduced at constant temperature, its volume increases and the contributions of the terms B’/V, C’/V 2 decrease As pressure of the gas approaches zero, molecular distance become infinite, molecular attractions become negligible and Z approaches unity so for 1 mole of ideal gas
The use of the compressibility factor and the associated equation expansion is practical when no more than two or three terms are required This requirement is satisfied for gases at low to moderate pressures The plots of compressibility factors of gases as a function of pressure at various temperatures show that Z=1 at P=0 and the isotherms are nearly straight at low to moderate pressures The tangent to an isotherm at P=0 is a good approximation of the isotherm for a finite pressure range or
The compressibility factor accurately describes the PVT behavior of gases at low to medium pressures A cubic equation of higher complexity is applied to define the PVT behavior of liquids as well as gases The equation also known as Redlich/Kwong equation has three roots at most of the low pressure range The smallest root is liquid volume, the highest vapor volume and the middle is of no significance Thus volumes of saturated liquid and saturated vapor are given by the smallest and largest roots when P is the saturation or vapor pressure The equation is solved by iteration See text book for iteration steps and calculation of the constants a and b
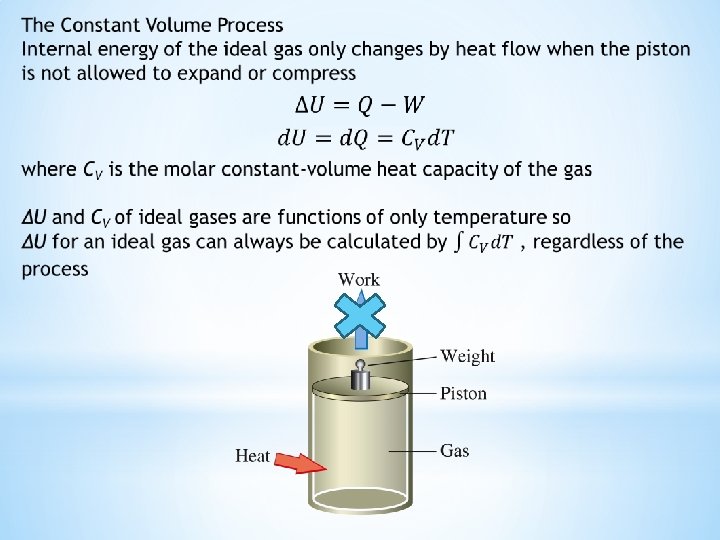
Ideal gas equation of state is a model equation applicable to all gases to understand their P-V-T behavior and the energy requirements of processes within small margins of error Consider an engine piston full of ideal gas Total energy of the ideal gas can only be changed through transfer of energy across its boundary and work done on or by the system Heat is admitted to the system by conduction through metal block Work is done on the system by compressing the piston Work is done by the system by expansion of the piston
Let U be a thermodynamic state function of the system called the internal energy ΔU is the change in internal energy of the system for any process Q is the quantity of heat that flows into the system during process W is defined as the mechanical work done on the system by the external pressure W’ is defined as all other kinds of work done on the system during the process Thus Mathematical formulation of the First law of thermodynamics U is a state function and is independent of the path Q, W, and W’ are process variables that depend on the path Mechanical work is the only work done in practical applications and W’ is omitted The signs of Q and W depend on the direction of the energy transfer They are positive when heat is transferred into the system and work is done by it through expansion They are negative when heat flows out of the system and work is done on it by compression
Specific Heat: It is the amount of heat required to raise the temperature of a 1 kg mass 1 C or 1 K
Example – A batch of 20 tons of liquid copper is to be cooled from 1200 °C to 1150 °C by adding solid copper at 25 C. 40000 k. J are lost during the time it takes to make the addition and the temperature to stabilize. What quantity of solid is used?
T