Introduction of Incidence Response Software Splunk Incident Response

- Slides: 49

Introduction of Incidence Response Software - Splunk Incident Response Technologies Dr. Cliff Zou

Acknowledgement Slides. Share. net ◦ Splunk. Live! Zurich 2017 - Getting Started with Splunk Enterprise https: //www. slideshare. net/search/slideshow? searchfrom= header&q=splunk WEB APPLICATION MONITORING AND ANALYTICS WITH SPLUNK http: //depts. washington. edu/learnit/techconnect/wor dpress/wp-content/uploads/2015/02/Splunk. Presentation. pdf. Splunk – Meetup. http: //files. meetup. com/95697/Splunk_Linux_Meeti 2 ng. ppt

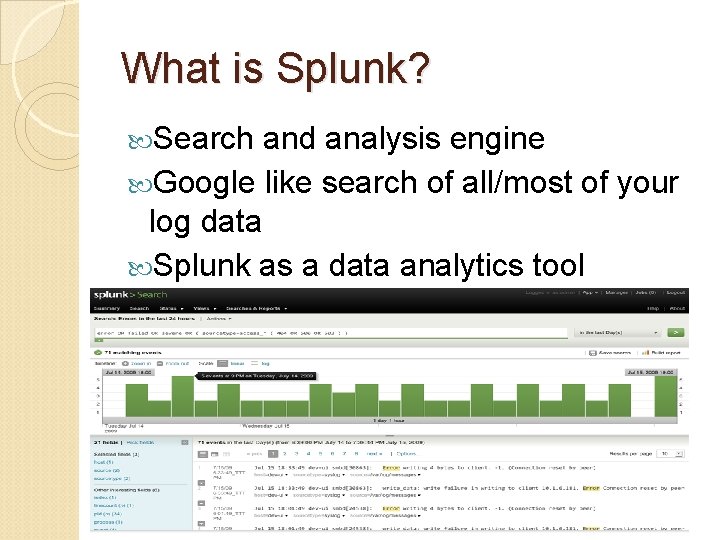
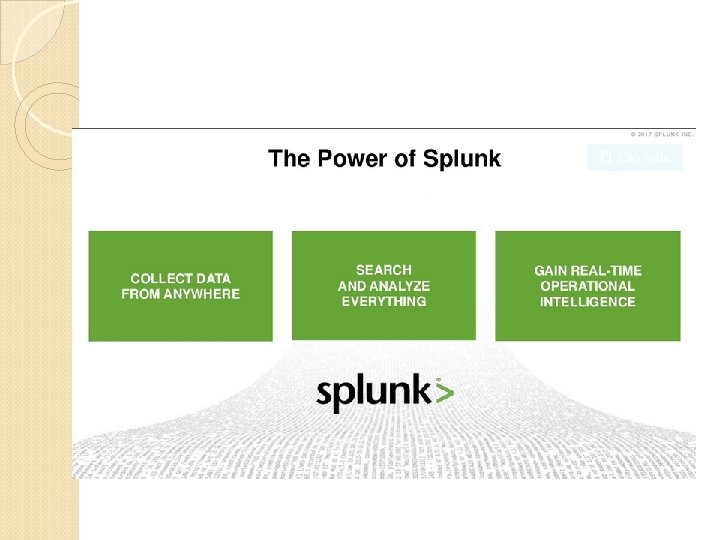
What is Splunk? Search and analysis engine Google like search of all/most of your log data Splunk as a data analytics tool

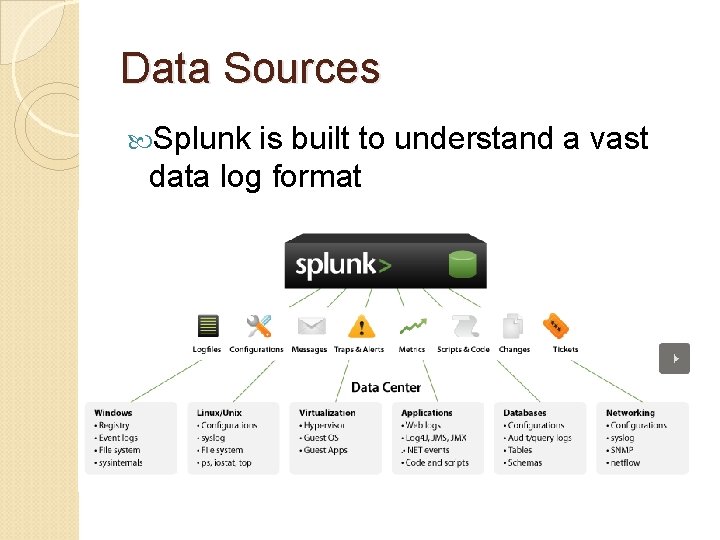
Data Sources Splunk is built to understand a vast data log format

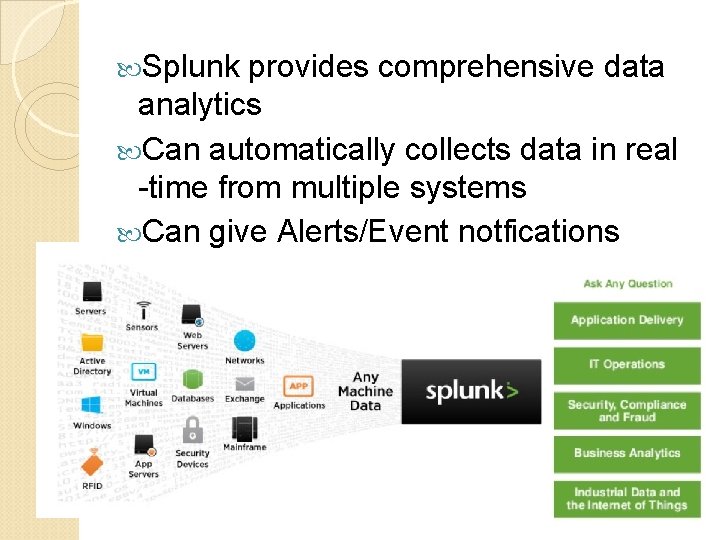
Splunk provides comprehensive data analytics Can automatically collects data in real -time from multiple systems Can give Alerts/Event notfications


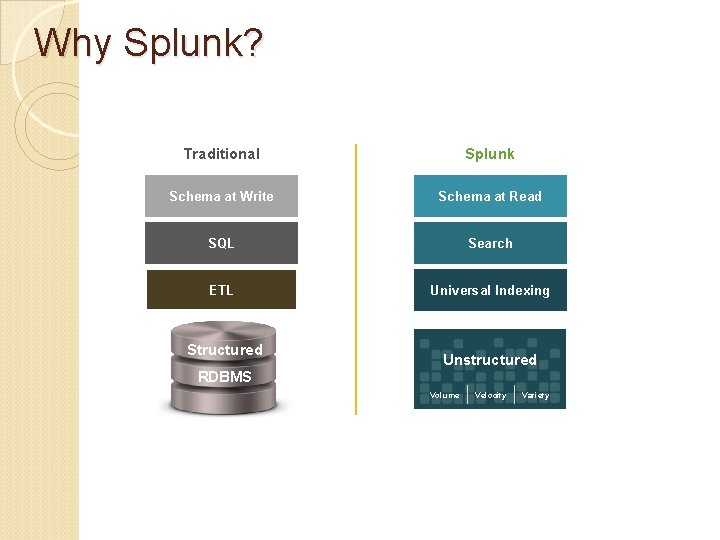
Why Splunk? Traditional Splunk Schema at Write Schema at Read SQL Search ETL Universal Indexing Structured Unstructured RDBMS Volume Velocity Variety

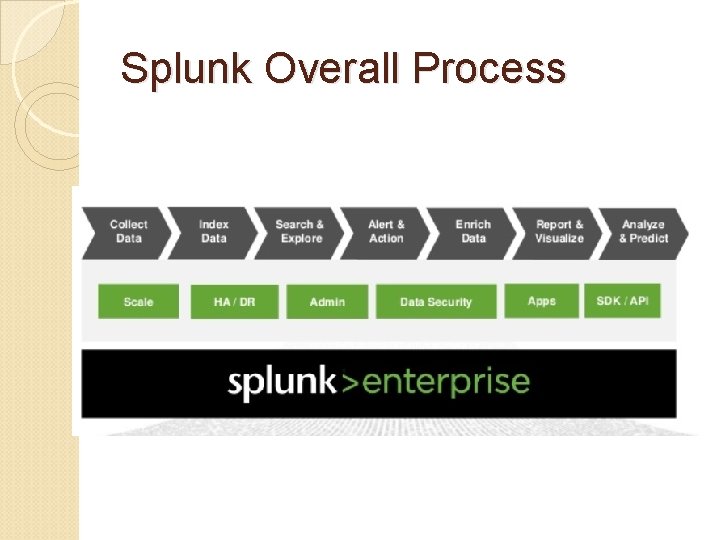
Splunk Overall Process

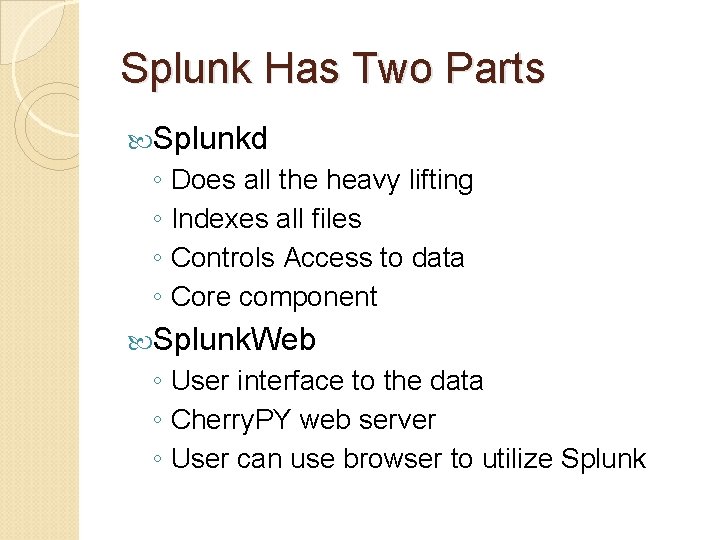
Splunk Has Two Parts Splunkd ◦ Does all the heavy lifting ◦ Indexes all files ◦ Controls Access to data ◦ Core component Splunk. Web ◦ User interface to the data ◦ Cherry. PY web server ◦ User can use browser to utilize Splunk

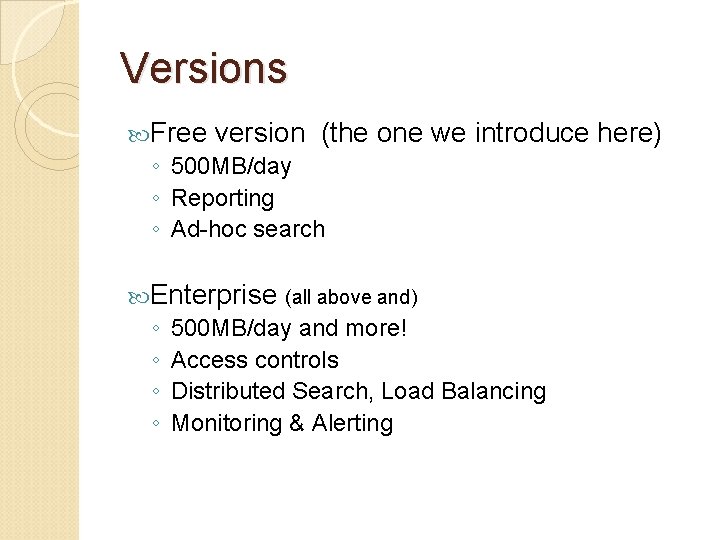
Versions Free version (the ◦ 500 MB/day ◦ Reporting ◦ Ad-hoc search one we introduce here) Enterprise (all above and) ◦ 500 MB/day and more! ◦ Access controls ◦ Distributed Search, Load Balancing ◦ Monitoring & Alerting

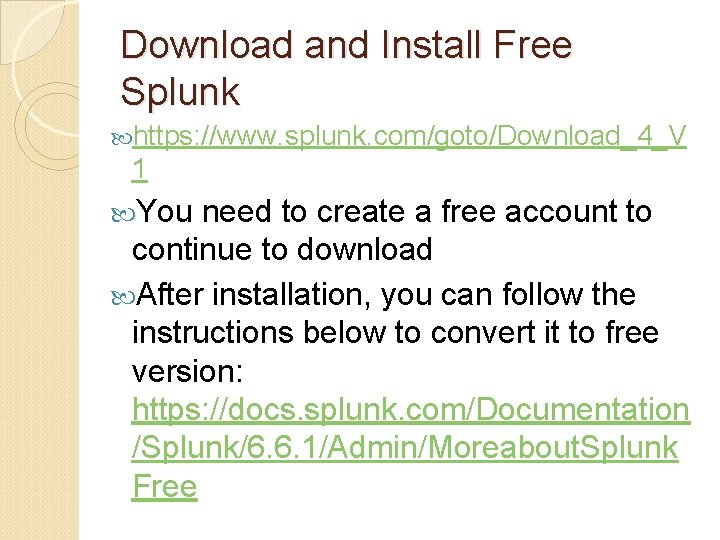
Download and Install Free Splunk https: //www. splunk. com/goto/Download_4_V 1 You need to create a free account to continue to download After installation, you can follow the instructions below to convert it to free version: https: //docs. splunk. com/Documentation /Splunk/6. 6. 1/Admin/Moreabout. Splunk Free

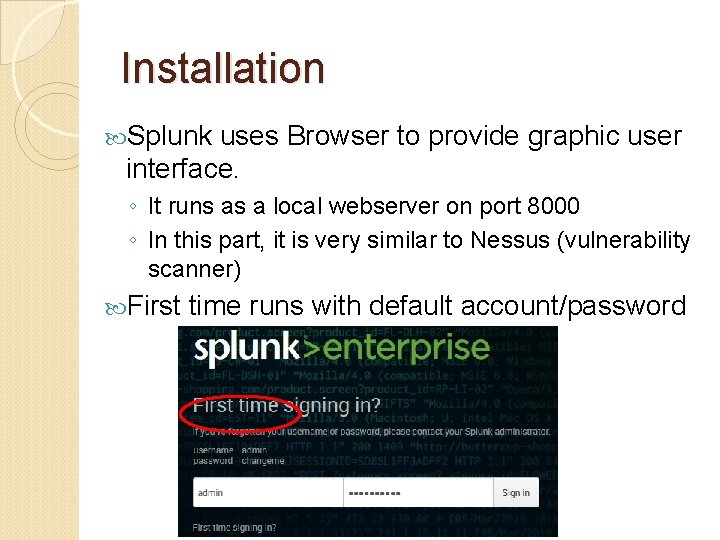
Installation Splunk uses Browser to provide graphic user interface. ◦ It runs as a local webserver on port 8000 ◦ In this part, it is very similar to Nessus (vulnerability scanner) First time runs with default account/password

Demonstration The following slides are mainly from Splunk. Live! Zurich 2017 - Getting Started with Splunk Enterprise https: //www. slideshare. net/search/slideshow? searchf rom=header&q=splunk Before we start, you need to: ◦ Download the tutorial data (a small zip file) http: //splk. it/2 ey 34 P 8

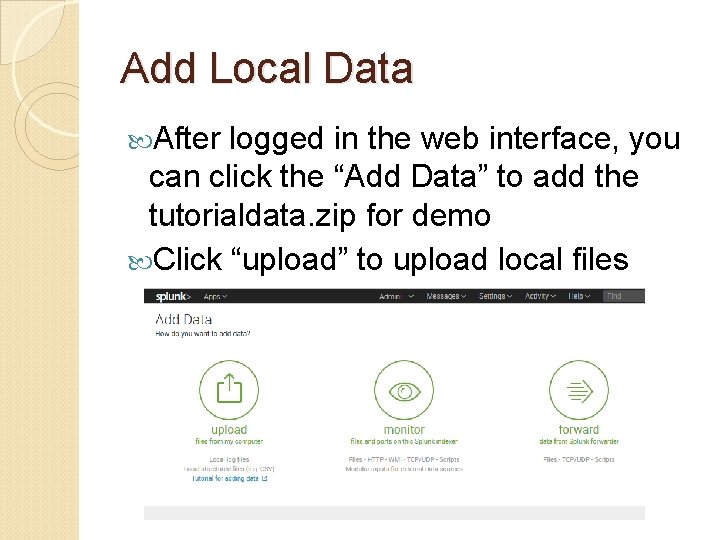
Add Local Data After logged in the web interface, you can click the “Add Data” to add the tutorialdata. zip for demo Click “upload” to upload local files

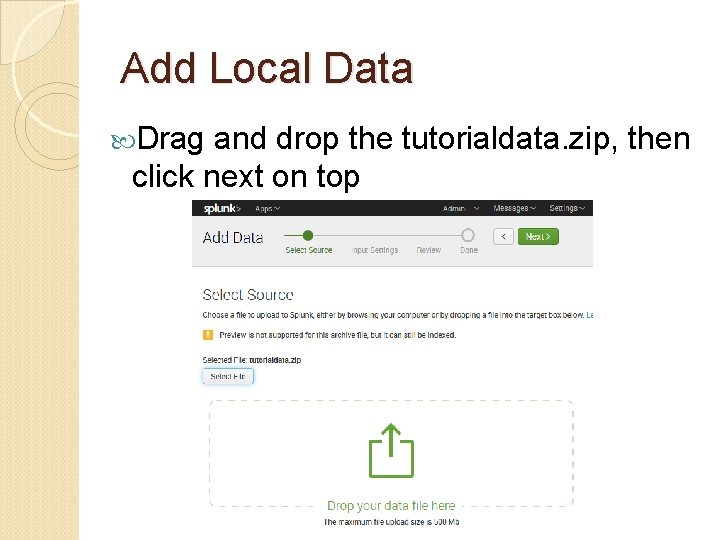
Add Local Data Drag and drop the tutorialdata. zip, then click next on top

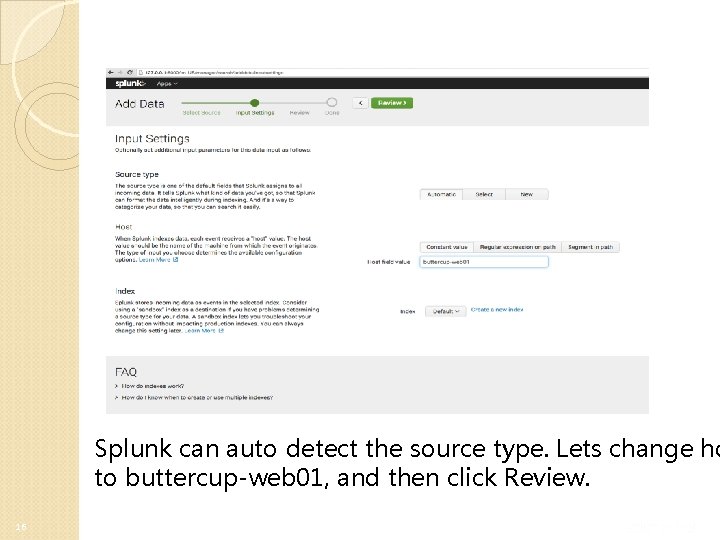
Splunk can auto detect the source type. Lets change ho to buttercup-web 01, and then click Review. 16

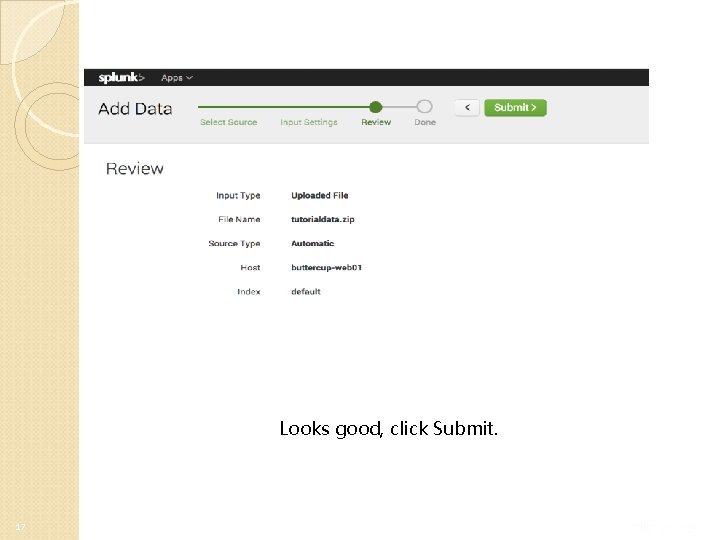
Looks good, click Submit. 17

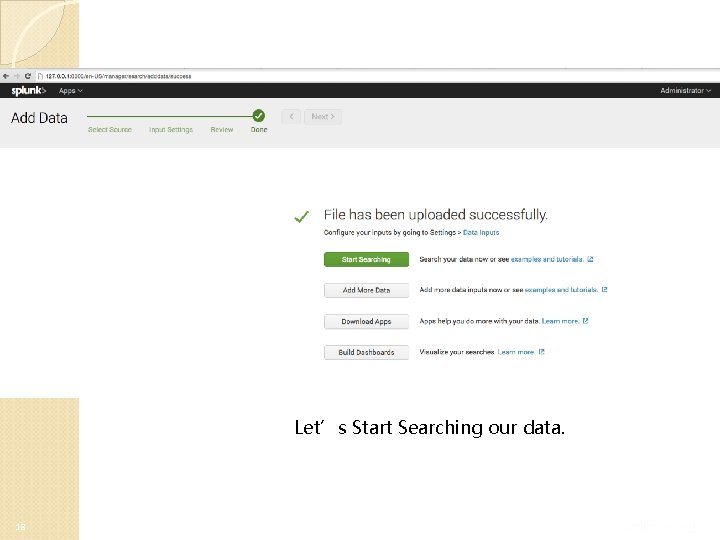
Let’s Start Searching our data. 18

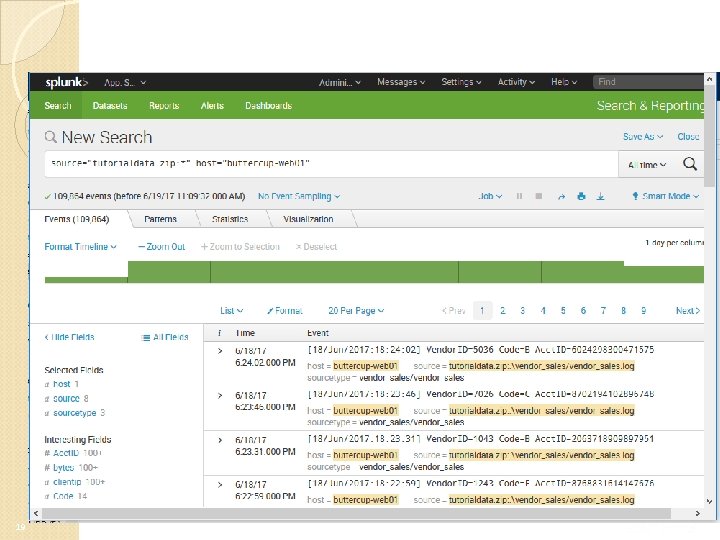
19

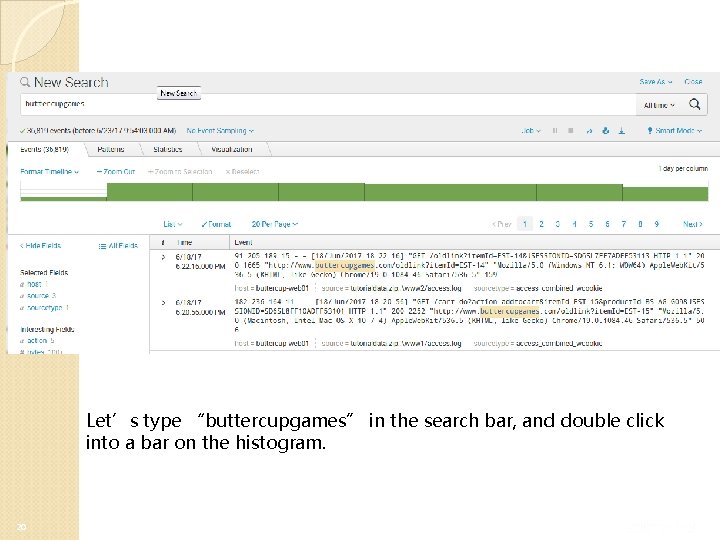
Let’s type “buttercupgames” in the search bar, and double click into a bar on the histogram. 20

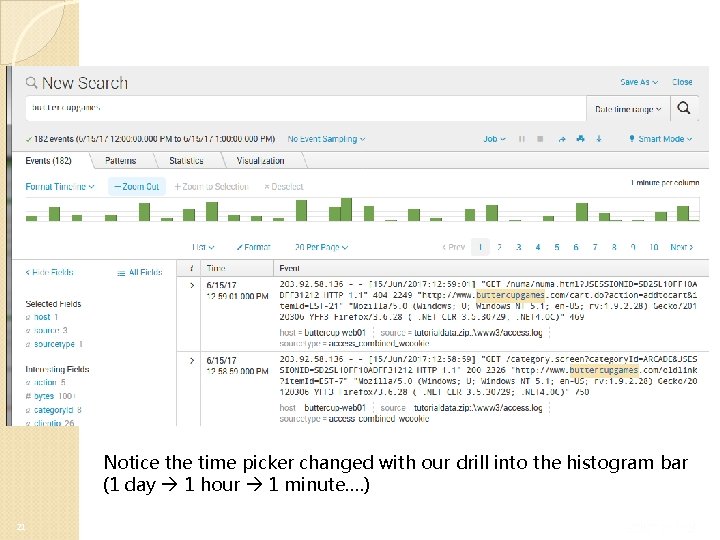
Notice the time picker changed with our drill into the histogram bar (1 day 1 hour 1 minute…. ) 21

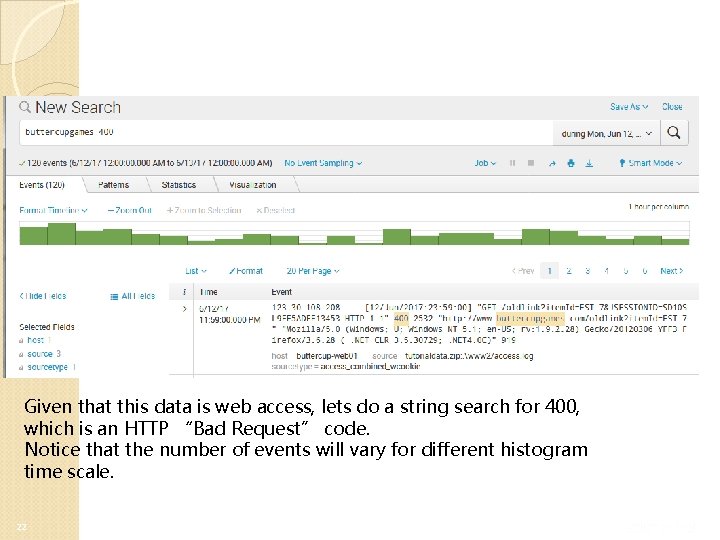
Given that this data is web access, lets do a string search for 400, which is an HTTP “Bad Request” code. Notice that the number of events will vary for different histogram time scale. 22

Rethink: Splunk vs. Wireshark It seems the traffic and search is very similar to Wireshark? – Wireshark can only process wireshark, or tcpdump (or similar networking) trace; Splunk can deal with many different software’s logs – Wireshark does traffic capturing; Splunk does log processing – For networking traffic, wireshark has more enriched search/analysis options 23

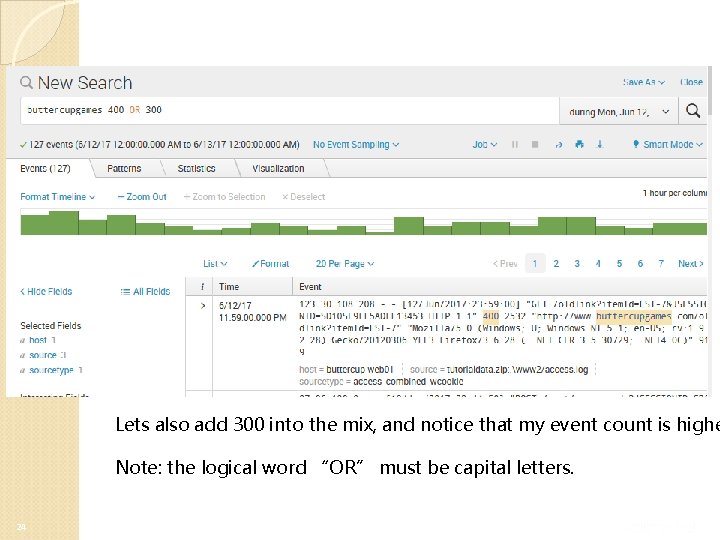
Lets also add 300 into the mix, and notice that my event count is highe Note: the logical word “OR” must be capital letters. 24

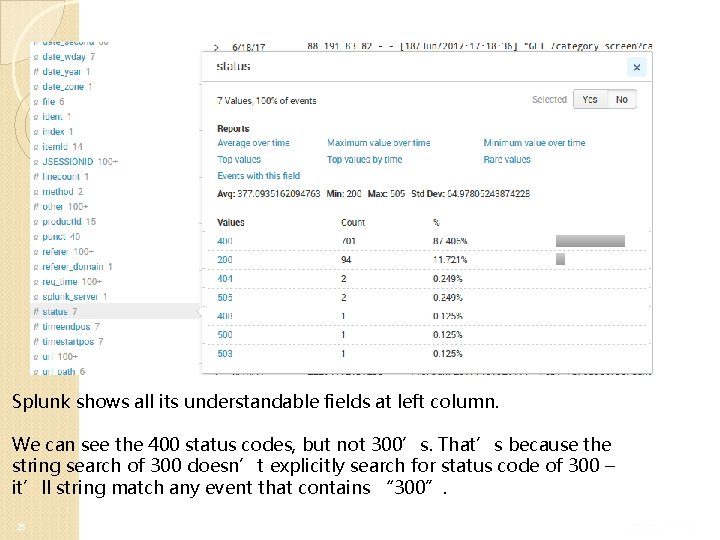
Splunk shows all its understandable fields at left column. We can see the 400 status codes, but not 300’s. That’s because the string search of 300 doesn’t explicitly search for status code of 300 – it’ll string match any event that contains “ 300”. 25

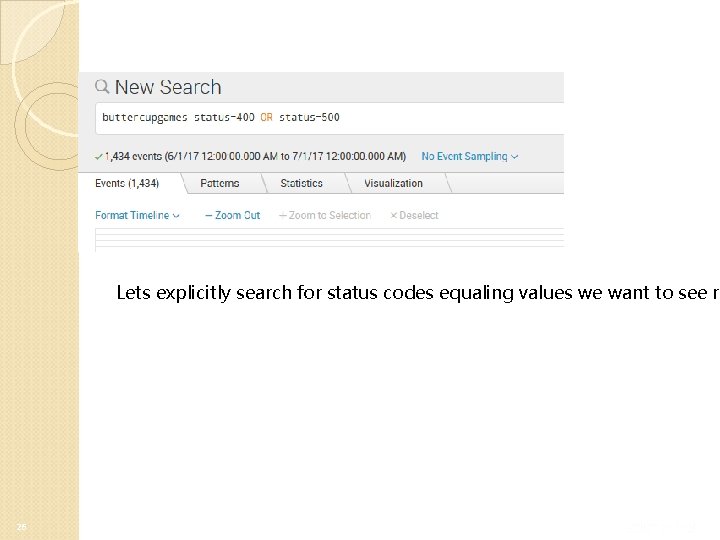
Lets explicitly search for status codes equaling values we want to see re 26

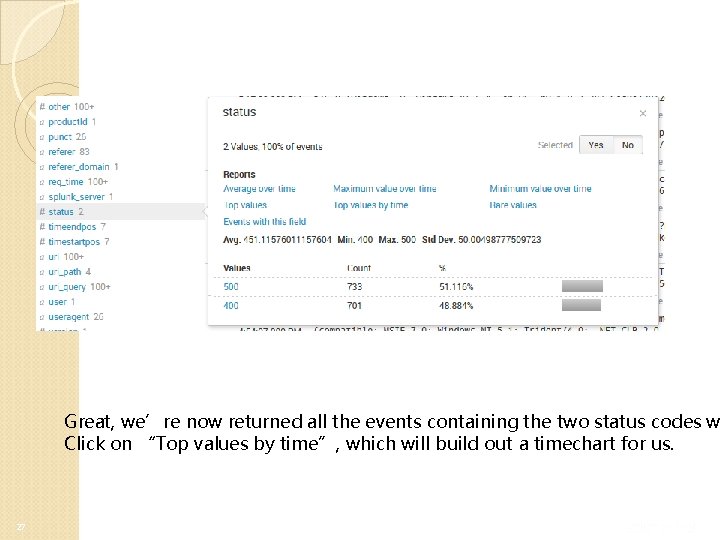
Great, we’re now returned all the events containing the two status codes w Click on “Top values by time”, which will build out a timechart for us. 27

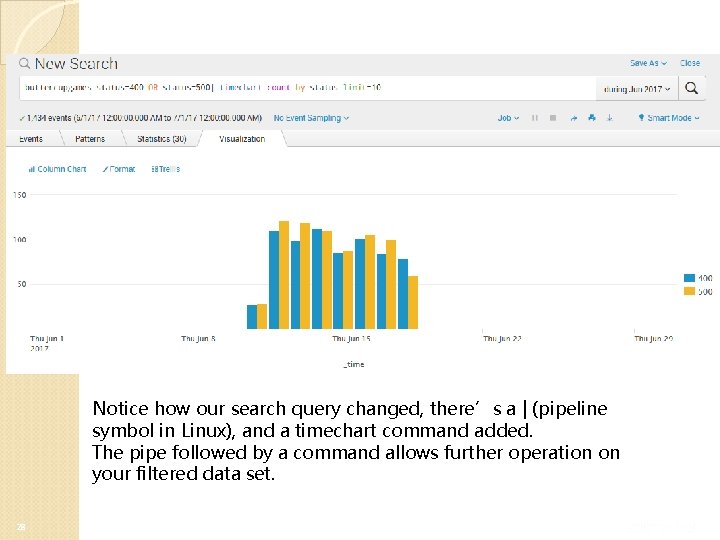
Notice how our search query changed, there’s a | (pipeline symbol in Linux), and a timechart command added. The pipe followed by a command allows further operation on your filtered data set. 28

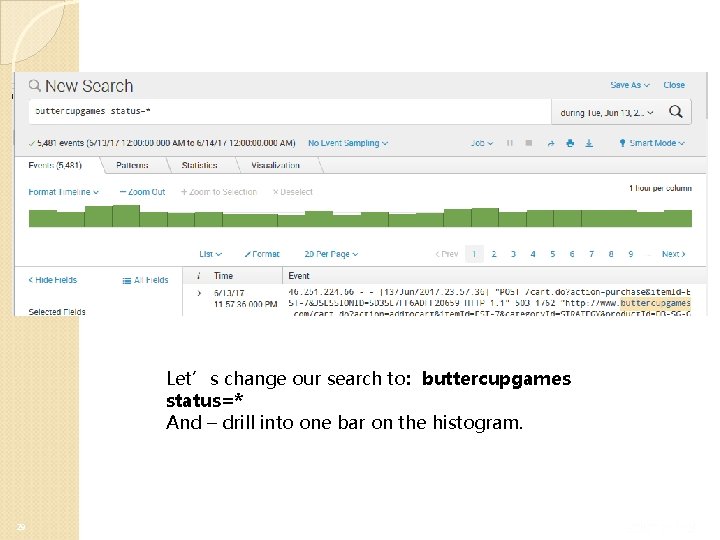
Let’s change our search to: buttercupgames status=* And – drill into one bar on the histogram. 29

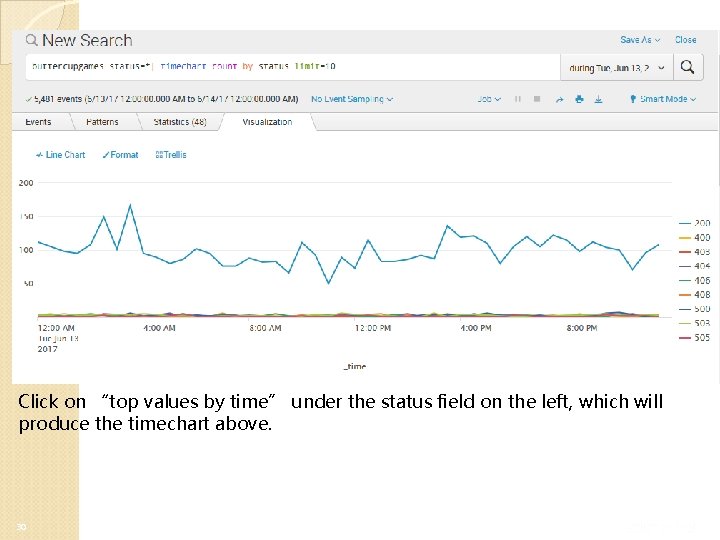
Click on “top values by time” under the status field on the left, which will produce the timechart above. 30

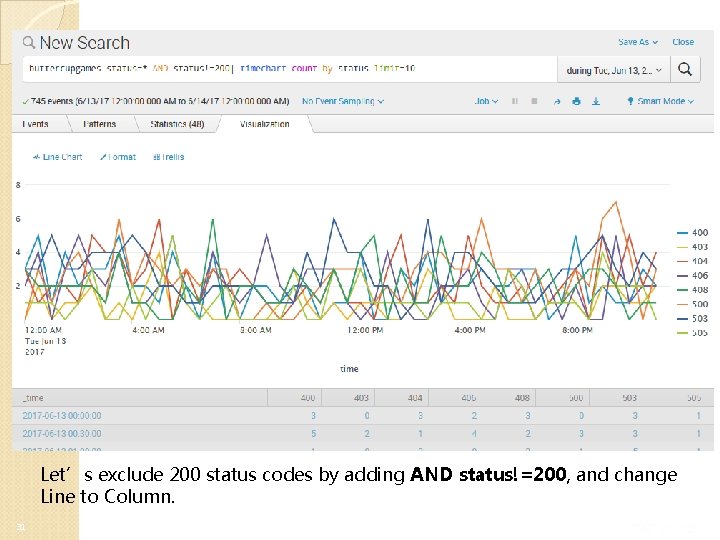
Let’s exclude 200 status codes by adding AND status!=200, and change Line to Column. 31

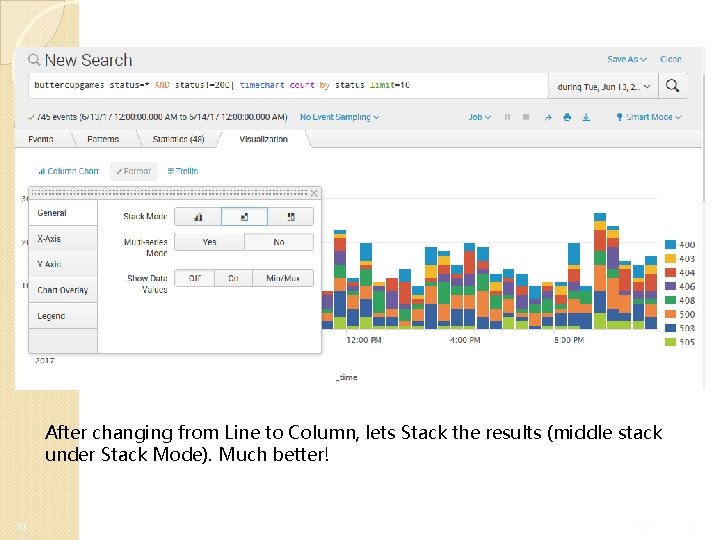
After changing from Line to Column, lets Stack the results (middle stack under Stack Mode). Much better! 32

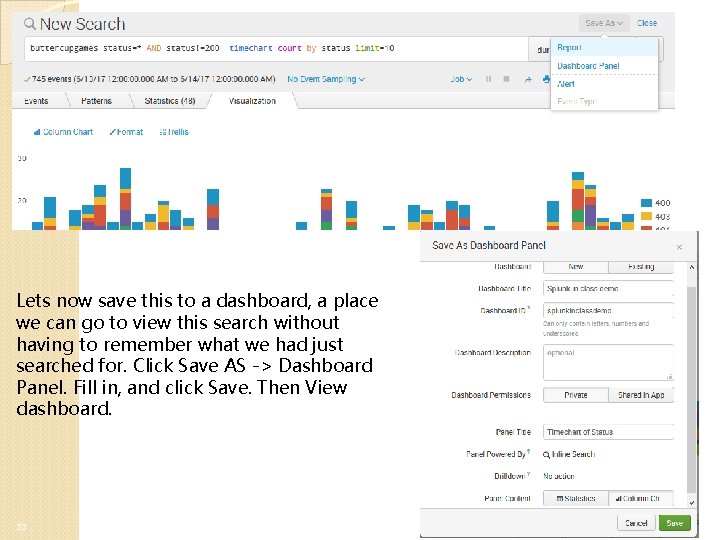
Lets now save this to a dashboard, a place we can go to view this search without having to remember what we had just searched for. Click Save AS -> Dashboard Panel. Fill in, and click Save. Then View dashboard. 33

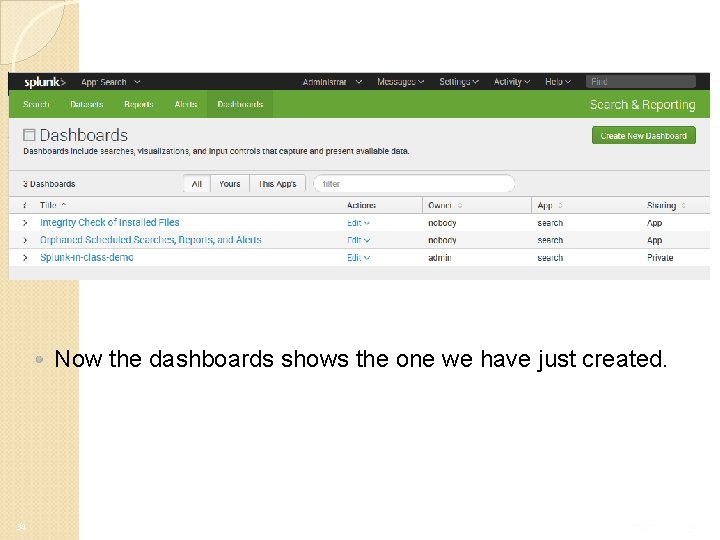
Now the dashboards shows the one we have just created. 34

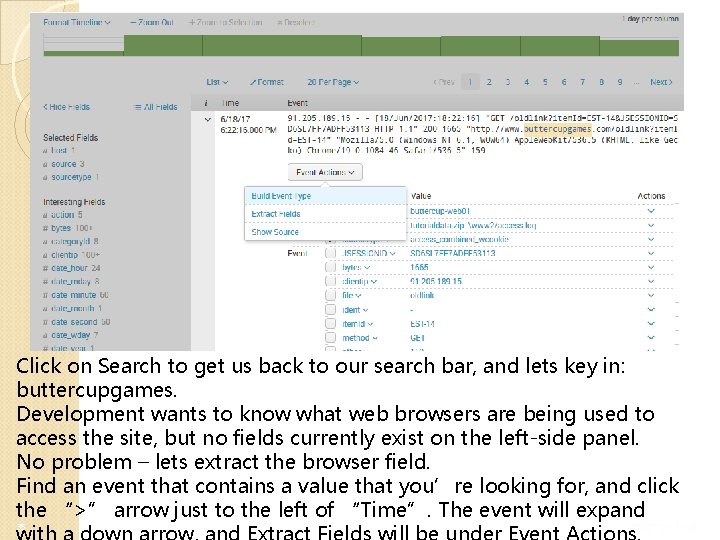
Click on Search to get us back to our search bar, and lets key in: buttercupgames. Development wants to know what web browsers are being used to access the site, but no fields currently exist on the left-side panel. No problem – lets extract the browser field. Find an event that contains a value that you’re looking for, and click the “>” arrow just to the left of “Time”. The event will expand 35

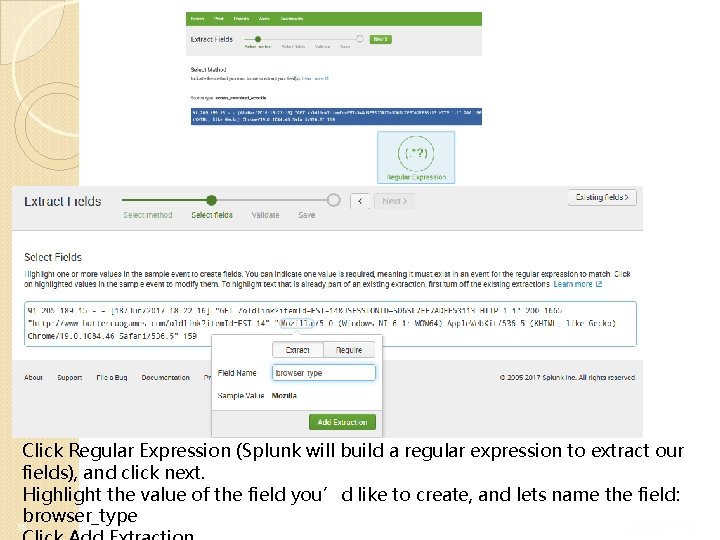
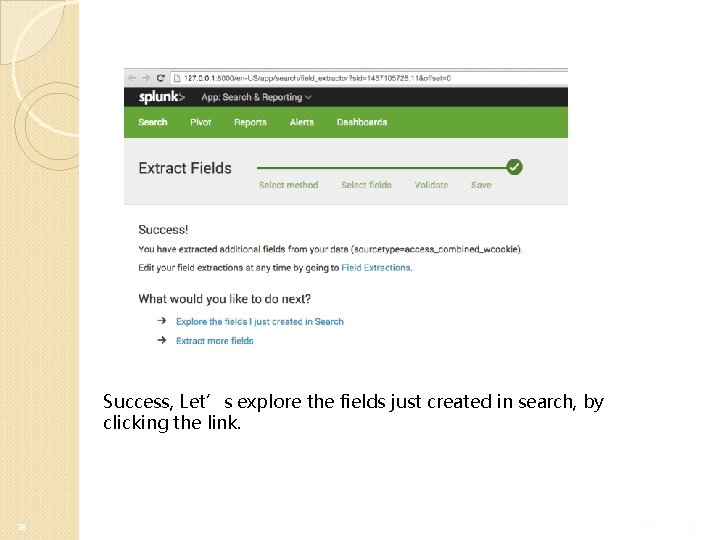
Click Regular Expression (Splunk will build a regular expression to extract our fields), and click next. Highlight the value of the field you’d like to create, and lets name the field: browser_type 36

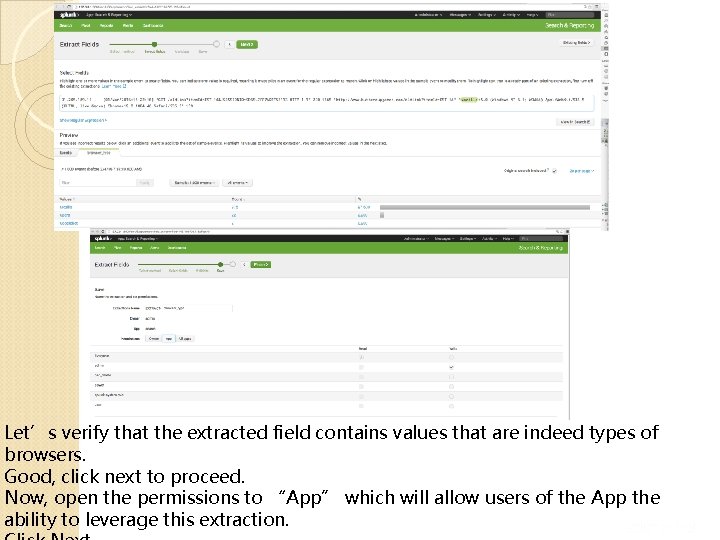
Let’s verify that the extracted field contains values that are indeed types of browsers. Good, click next to proceed. Now, open the permissions to “App” which will allow users of the App the ability to leverage this extraction. 37

Success, Let’s explore the fields just created in search, by clicking the link. 38

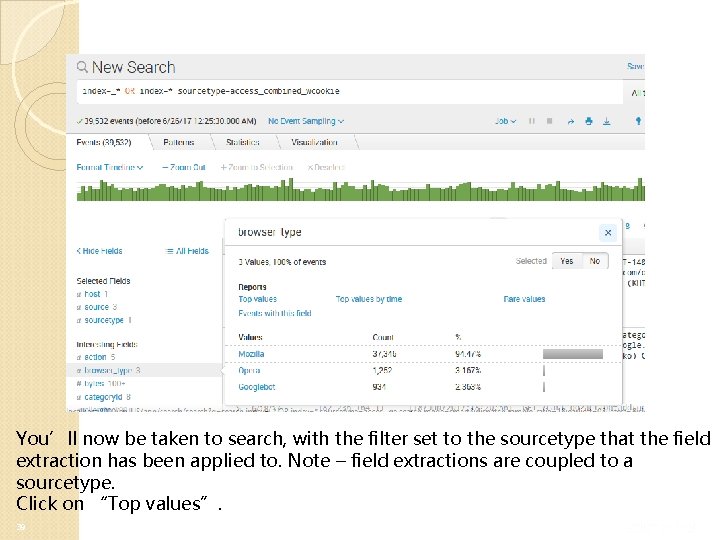
You’ll now be taken to search, with the filter set to the sourcetype that the field extraction has been applied to. Note – field extractions are coupled to a sourcetype. Click on “Top values”. 39

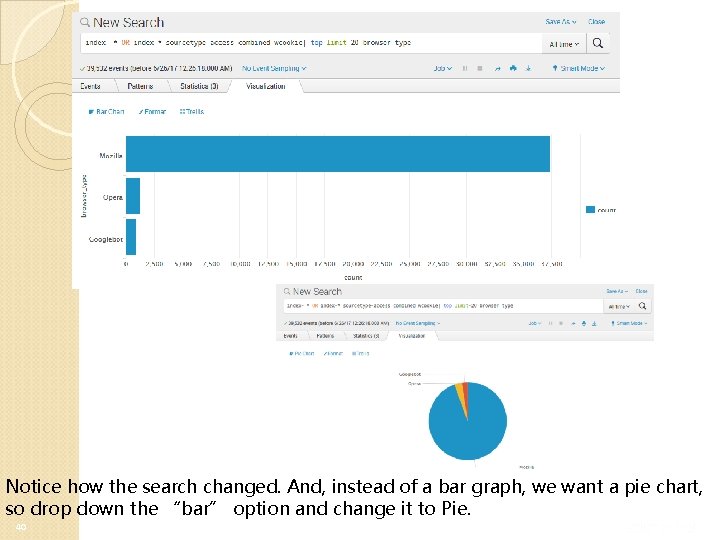
Notice how the search changed. And, instead of a bar graph, we want a pie chart, so drop down the “bar” option and change it to Pie. 40

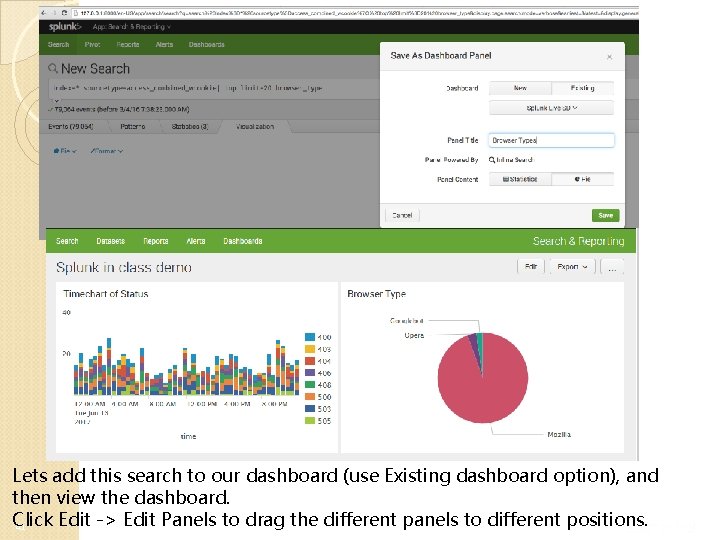
Lets add this search to our dashboard (use Existing dashboard option), and then view the dashboard. Click Edit -> Edit Panels to drag the different panels to different positions. 41

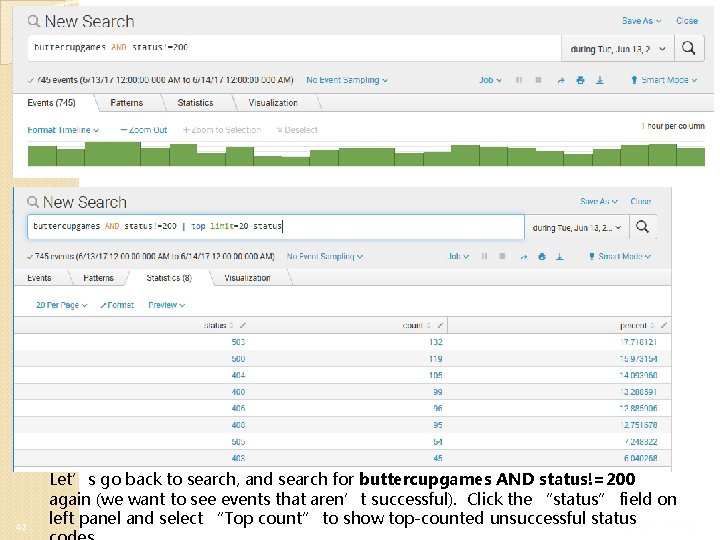
42 Let’s go back to search, and search for buttercupgames AND status!=200 again (we want to see events that aren’t successful). Click the “status” field on left panel and select “Top count” to show top-counted unsuccessful status

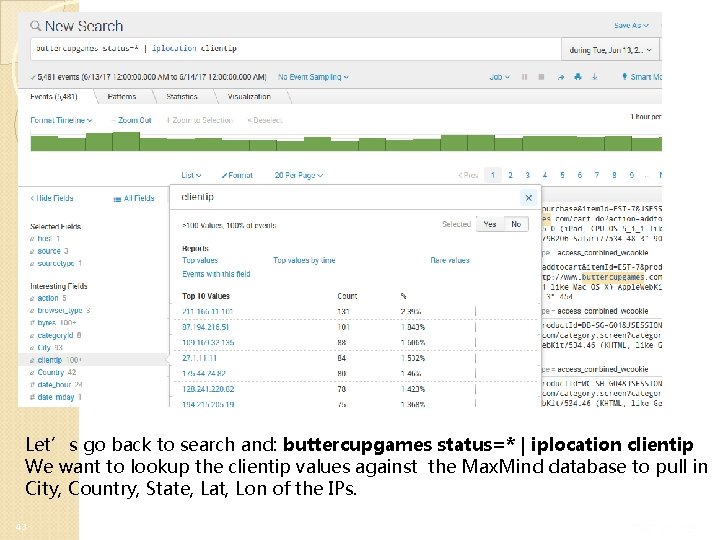
Let’s go back to search and: buttercupgames status=* | iplocation clientip We want to lookup the clientip values against the Max. Mind database to pull in City, Country, State, Lat, Lon of the IPs. 43

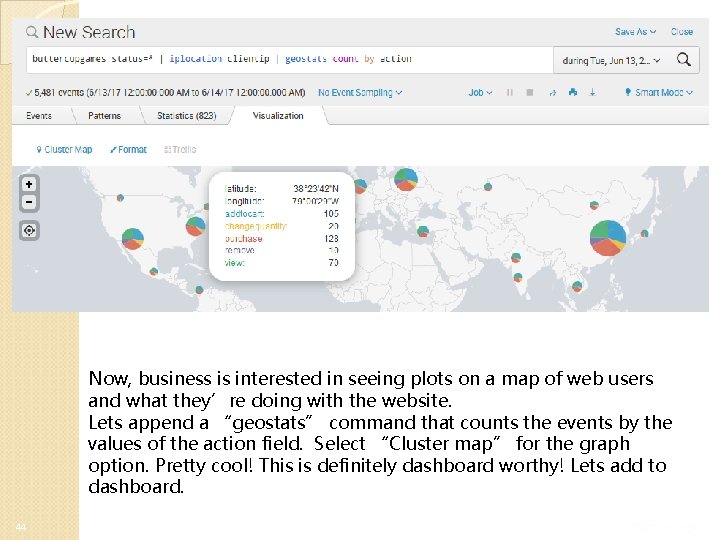
Now, business is interested in seeing plots on a map of web users and what they’re doing with the website. Lets append a “geostats” command that counts the events by the values of the action field. Select “Cluster map” for the graph option. Pretty cool! This is definitely dashboard worthy! Lets add to dashboard. 44

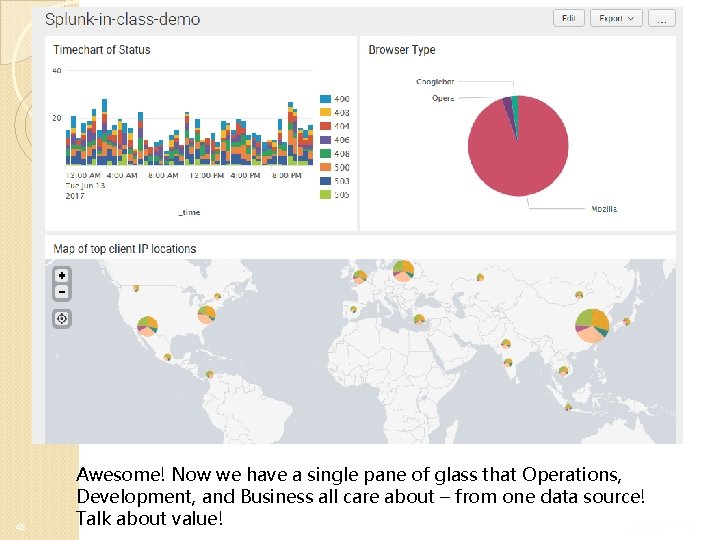
45 Awesome! Now we have a single pane of glass that Operations, Development, and Business all care about – from one data source! Talk about value!

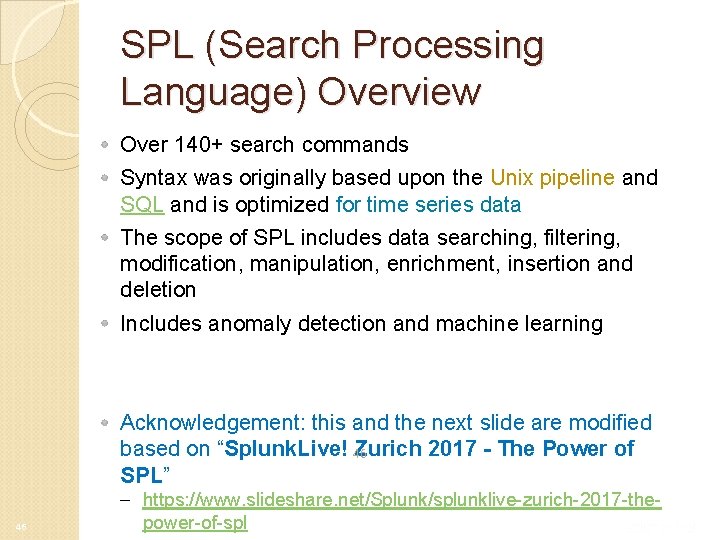
SPL (Search Processing Language) Overview Over 140+ search commands Syntax was originally based upon the Unix pipeline and SQL and is optimized for time series data The scope of SPL includes data searching, filtering, modification, manipulation, enrichment, insertion and deletion Includes anomaly detection and machine learning Acknowledgement: this and the next slide are modified based on “Splunk. Live! 46 Zurich 2017 - The Power of SPL” 46 – https: //www. slideshare. net/Splunk/splunklive-zurich-2017 -thepower-of-spl

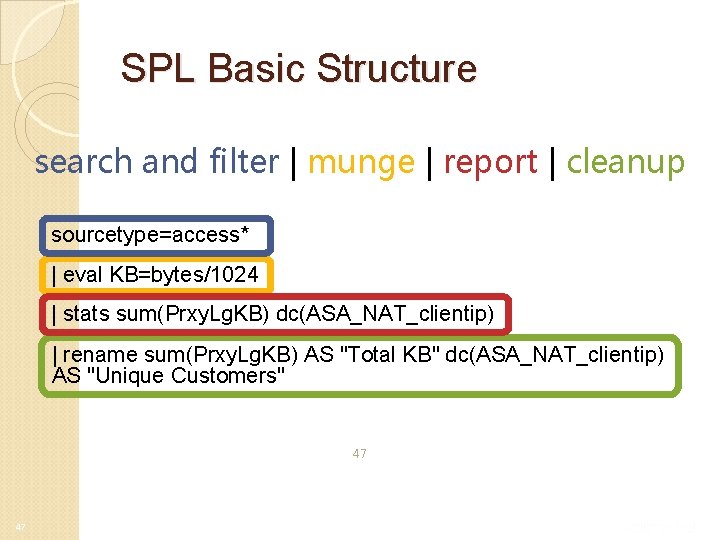
SPL Basic Structure search and filter | munge | report | cleanup sourcetype=access* | eval KB=bytes/1024 | stats sum(Prxy. Lg. KB) dc(ASA_NAT_clientip) | rename sum(Prxy. Lg. KB) AS "Total KB" dc(ASA_NAT_clientip) AS "Unique Customers" 47 47

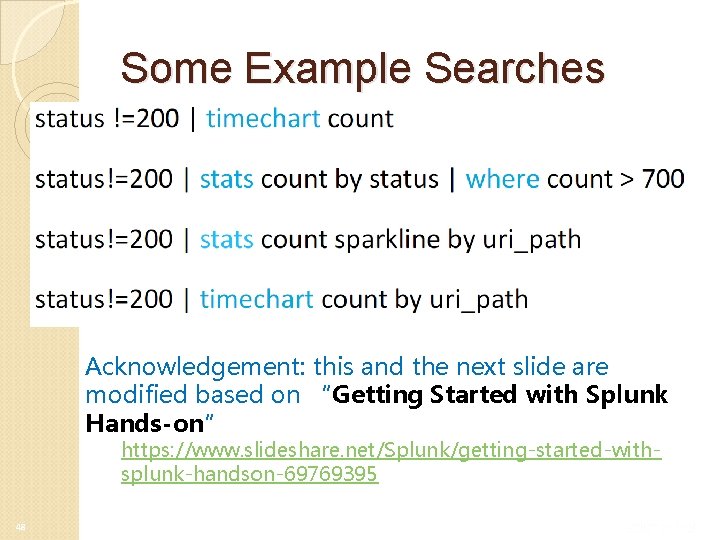
Some Example Searches Acknowledgement: this and the next slide are modified based on “Getting Started with Splunk Hands-on” https: //www. slideshare. net/Splunk/getting-started-withsplunk-handson-69769395 48

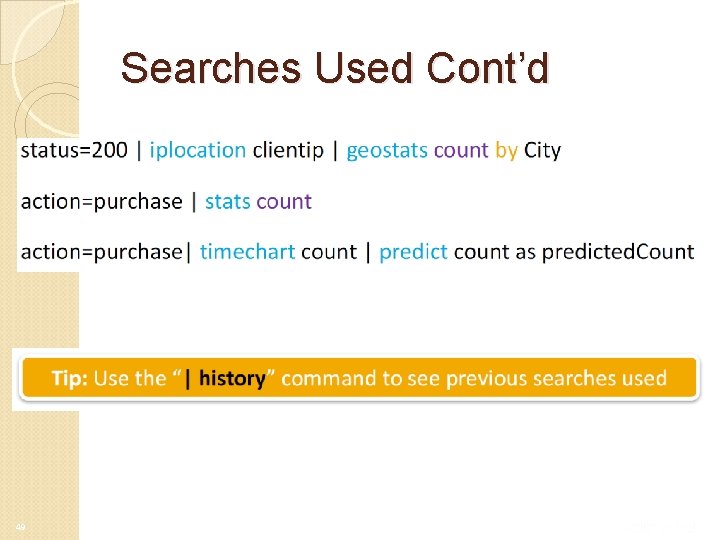
Searches Used Cont’d 49