
Line graph What is being tested is your
Line graph What is being tested is your ability to: o ¨ objectively describe the information given to you o ¨ report on a topic without the use of opinion o ¨ use suitable language to describe the graph Sample task (Incidence of X disease in Someland, p. 2) o You should spend about 20 minutes on this task. Write a report for a university lecturer describing the information in the graph below. You should write at least 150 words.

Guidelines for a good answer When you’ve finished the task o How good is your answer? Check the guidelines on the next page and read the sample answer. Does the report have a suitable structure? o ¨ Does it have an introduction, body and conclusion? o ¨ Does it include connective words to make the writing cohesive within sentences and paragraphs? Does the report use suitable grammar and vocabulary? o ¨ Does it include a variety of sentence structures? o ¨ Does it include a range of appropriate vocabulary? Does the report meet the requirements of the task? o ¨ Does it meet the word limit requirements? o ¨ Does it describe the whole graph adequately? o ¨ Does it focus on the important trends presented in the graphic information?
Sample task Incidence of X disease in Someland
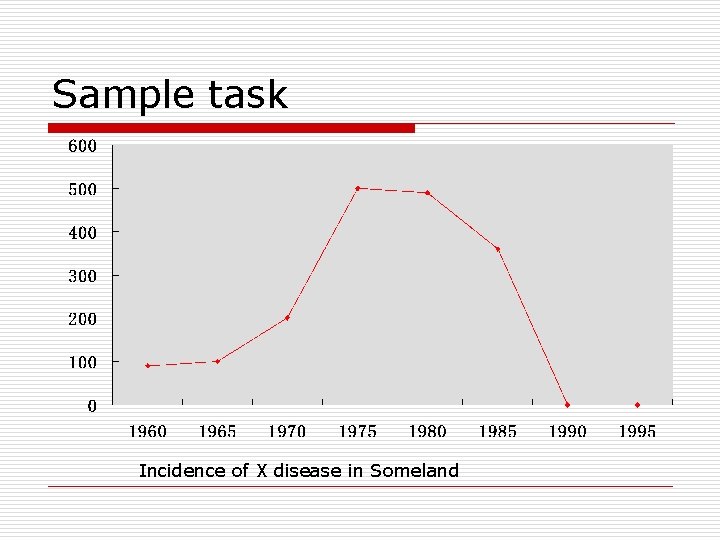
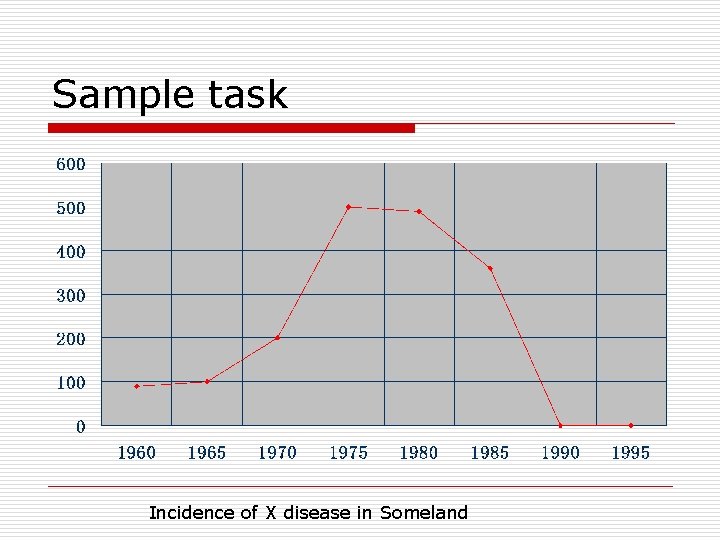
Sample answer o The graph shows the number of cases of X disease in Someland between the years 1960 and 1995. As an overall trend, it is clear that the number of cases of the disease increased fairly rapidly until the mid seventies, remained constant for around a decade at 500 cases before dropping to zero in the late 80 s. In 1960, the number of cases stood at approximately 100. That number rose steadily to 200 by 1969 and then more sharply to 500 in 1977. At this point the number of cases remained stable until 1984 before plummeting to zero by 1988. From 1988 to 1995 Someland was free of the disease. In conclusion, the graph shows that the disease was increasingly prevalent until the 1980 s when it was eradicated from Someland.

What do you think? o What is your opinion of this sample answer? o How well does it meet the requirements of the guidelines? o Read the next page for a teacher's comments on this answer.
Sample answer o The graph shows the number of cases of X disease in Someland between the years 1960 and 1995. As an overall trend, it is clear that the number of cases of the disease increased fairly rapidly until the mid seventies, remained constant for around a decade at 500 cases before dropping to zero in the late 80 s. In 1960, the number of cases stood at approximately 100. That number rose steadily to 200 by 1969 and then more sharply to 500 in 1977. At this point the number of cases remained stable until 1984 before plummeting to zero by 1988. From 1988 to 1995 Someland was free of the disease. In conclusion, the graph shows that the disease was increasingly prevalent until the 1980 s when it was eradicated from Someland.
Strategies 1. Selecting information o It is important that you describe the whole graph fully. However, this does not mean that you should note every detail. In most cases there will be too much information for you to mention each figure. You will therefore need to summarize the graph by dividing it into its main parts. This is what we mean by describing the trends.
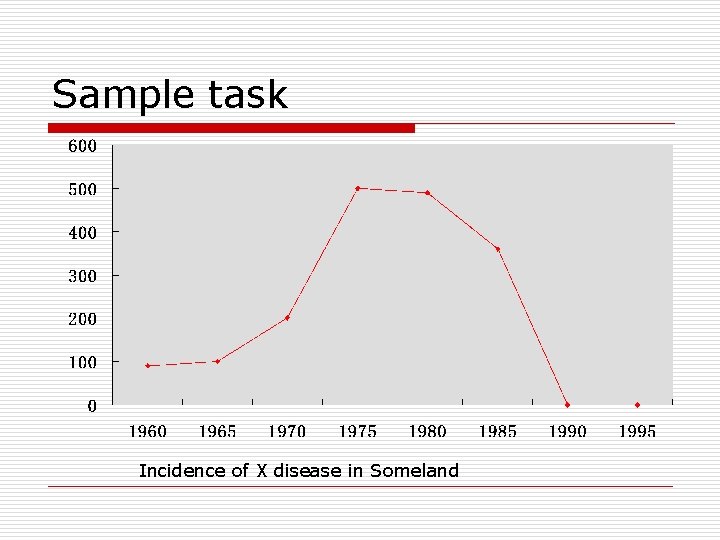
Sample task Incidence of X disease in Someland
o In the Sample Task, the graph shows four main trends: o ¨ first, a gradual increase from 1960 to 1968 o ¨ second, a steeper increase from 1968 to 1977 o ¨ third, a plateau from 1977 to 1983 o ¨ fourth, a drop from 1983 to 1988 o The structure of the report must show these four main trends clearly.
Strategies 2. Report structure o Your report should be structured simply with an introduction, body and conclusion. o Tenses should be used appropriately.
2. 1 Introduction o Use two standard opening sentences to introduce your report. These opening sentences should make up the first paragraph.
Sample task Incidence of X disease in Someland
two standard opening sentences o The graph shows the number of cases of X disease in Someland between the years 1960 and 1995. As an overall trend, it is clear that the number of cases of the disease increased fairly rapidly until the mid seventies, remained constant for around a decade at 500 cases before dropping to zero in the late 80 s. In 1960, the number of cases stood at approximately 100. That number rose steadily to 200 by 1969 and then more sharply to 500 in 1977. At this point the number of cases remained stable until 1984 before plummeting to zero by 1988. From 1988 to 1995 Someland was free of the disease. In conclusion, the graph shows that the disease was increasingly prevalent until the 1980 s when it was eradicated from Someland.
Sentence one should define what the graph is about; that is, the date, location, what is being described in the graph etc. o For example: o The graph shows the number of cases of X disease in Someland between the years 1960 and 1995. o Notice the tense used. o Notice that the sample opening sentence does not simply copy the words used on the graphic material. Copied sentences will not be assessed by the examiner and so you waste your time including them.
Describing the overall trend Sentence two (and possibly three) might sum up the overall trend. For example: As an overall trend, it is clear that the number of cases of the disease increased fairly rapidly until the mid seventies, remained constant for around a decade at 500 cases before dropping to zero in the late 80 s. o Notice the tense used. Here we are talking about the occurrence of the disease in the past.
2. 2 The body of the report: describing the graph or graphs in detail. o You will need to decide on the most clear and logical order to present the material. o Line graphs generally present information in chronological order and so the most logical order for you to write up the information would, most probably be from earliest to latest. o Bar graphs, pie charts are organized in different ways and so you need to decide on the organization of each one.
The body of the report o The graph shows the number of cases of X disease in Someland between the years 1960 and 1995. As an overall trend, it is clear that the number of cases of the disease increased fairly rapidly until the mid seventies, remained constant for around a decade at 500 cases before dropping to zero in the late 80 s. In 1960, the number of cases stood at approximately 100. That number rose steadily to 200 by 1969 and then more sharply to 500 in 1977. At this point the number of cases remained stable until 1984 before plummeting to zero by 1988. From 1988 to 1995 Someland was free of the disease. In conclusion, the graph shows that the disease was increasingly prevalent until the 1980 s when it was eradicated from Someland.
2. 3 Concluding sentences o Your report may end with one or two sentences which summarise your report to draw a relevant conclusion.
Concluding sentences o The graph shows the number of cases of X disease in Someland between the years 1960 and 1995. As an overall trend, it is clear that the number of cases of the disease increased fairly rapidly until the mid seventies, remained constant for around a decade at 500 cases before dropping to zero in the late 80 s. In 1960, the number of cases stood at approximately 100. That number rose steadily to 200 by 1969 and then more sharply to 500 in 1977. At this point the number of cases remained stable until 1984 before plummeting to zero by 1988. From 1988 to 1995 Someland was free of the disease. In conclusion, the graph shows that the disease was increasingly prevalent until the 1980 s when it was eradicated from Someland.
3. Grammar and vocabulary 3. 1 Avoiding repetition For example, the candidate who writes: The number of cases of X disease started at 80 in 1960 and then went up to 200 in 1970 and then went up to 500 in 1980 and then went down to zero in 1990. will lose marks for being repetitive. Use a wide variety of terms to describe the different movements in the graphs and different structures to vary your writing.
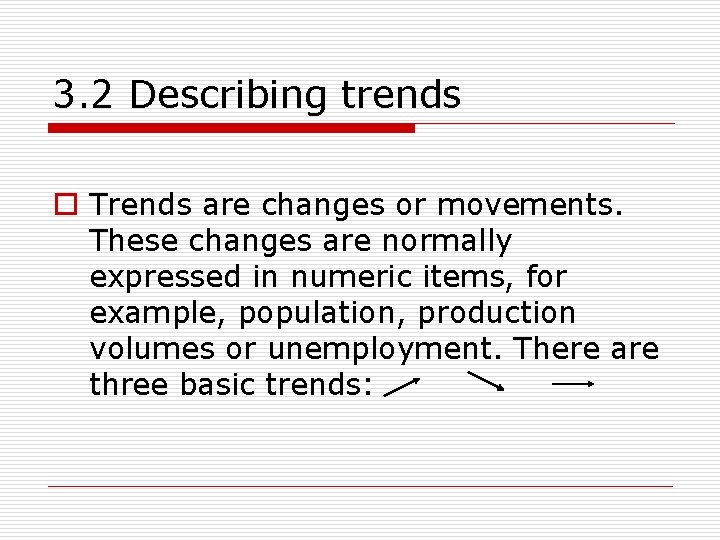
3. 2 Describing trends o Trends are changes or movements. These changes are normally expressed in numeric items, for example, population, production volumes or unemployment. There are three basic trends:
3. 2. 1 Expressing movement: nouns and verbs o For each trend there a number of verbs and nouns to express the movement. We can use a verb of change, for example: Unemployment levels fell o Or we can use a related noun, for example: There was a fall in unemployment levels
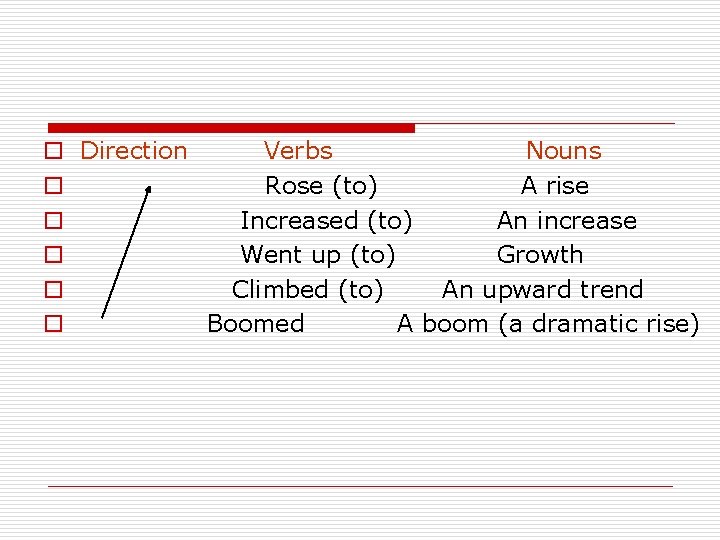
o Direction Verbs Nouns o Rose (to) A rise o Increased (to) An increase o Went up (to) Growth o Climbed (to) An upward trend o Boomed A boom (a dramatic rise)
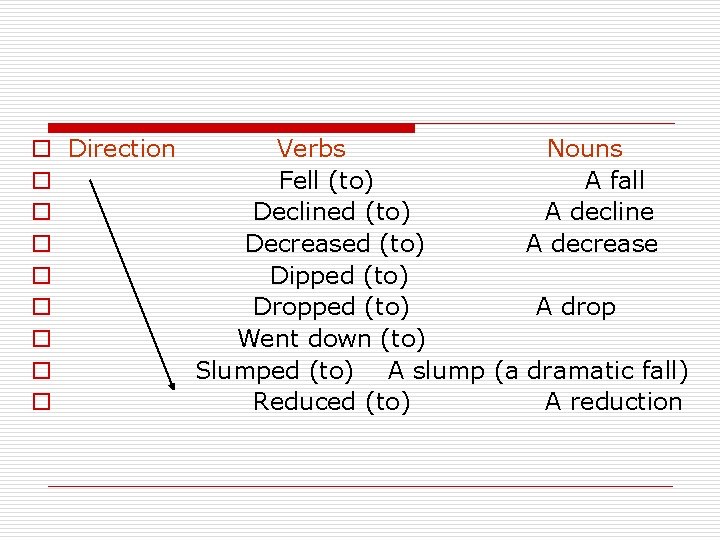
o Direction Verbs Nouns o Fell (to) A fall o Declined (to) A decline o Decreased (to) A decrease o Dipped (to) o Dropped (to) A drop o Went down (to) o Slumped (to) A slump (a dramatic fall) o Reduced (to) A reduction
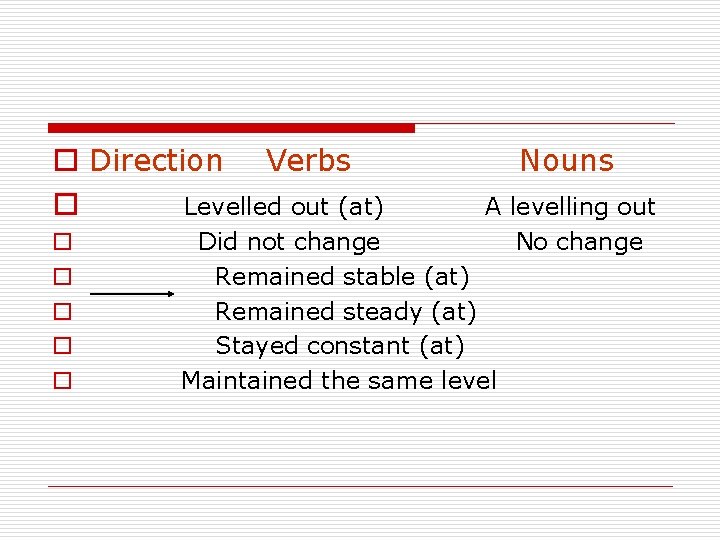
o Direction Verbs o Levelled out (at) o o o Nouns A levelling out No change Did not change Remained stable (at) Remained steady (at) Stayed constant (at) Maintained the same level
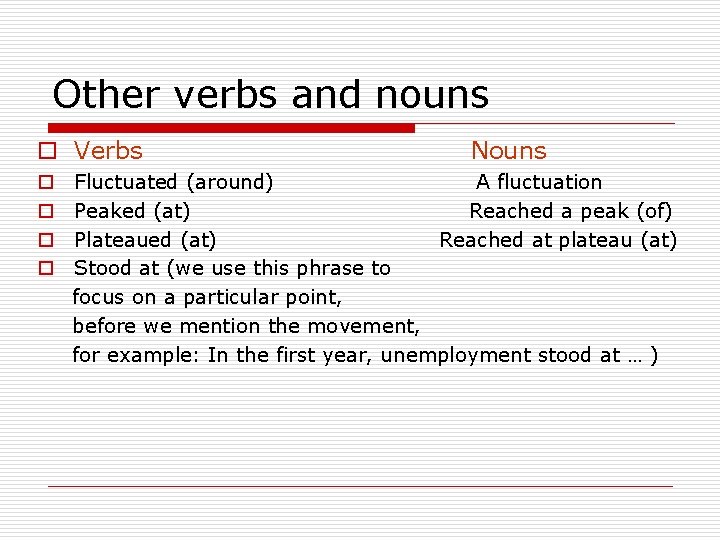
Other verbs and nouns o Verbs o o Nouns Fluctuated (around) A fluctuation Peaked (at) Reached a peak (of) Plateaued (at) Reached at plateau (at) Stood at (we use this phrase to focus on a particular point, before we mention the movement, for example: In the first year, unemployment stood at … )
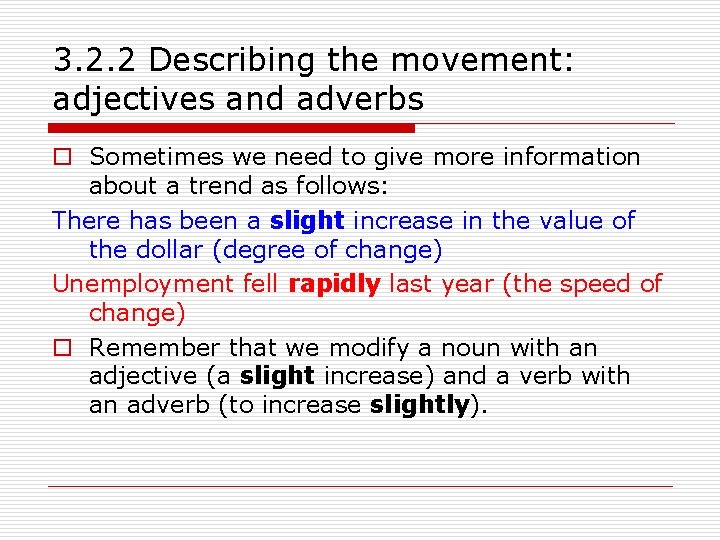
3. 2. 2 Describing the movement: adjectives and adverbs o Sometimes we need to give more information about a trend as follows: There has been a slight increase in the value of the dollar (degree of change) Unemployment fell rapidly last year (the speed of change) o Remember that we modify a noun with an adjective (a slight increase) and a verb with an adverb (to increase slightly).
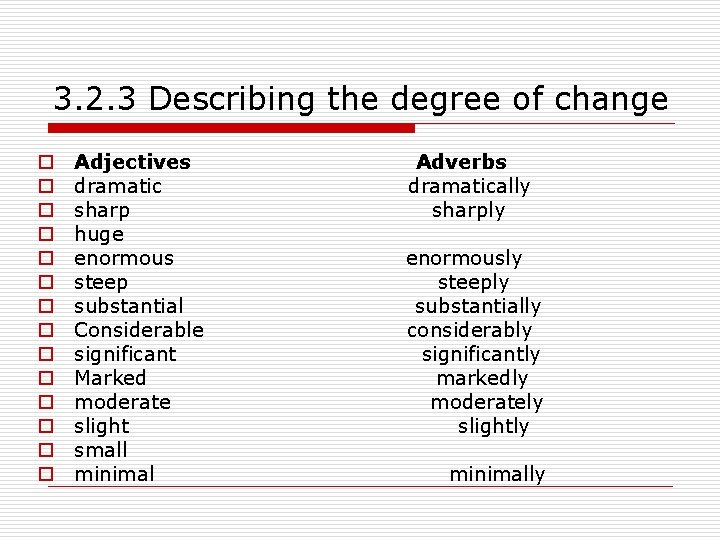
3. 2. 3 Describing the degree of change o o o o Adjectives dramatic sharp huge enormous steep substantial Considerable significant Marked moderate slight small minimal Adverbs dramatically sharply enormously steeply substantially considerably significantly markedly moderately slightly minimally
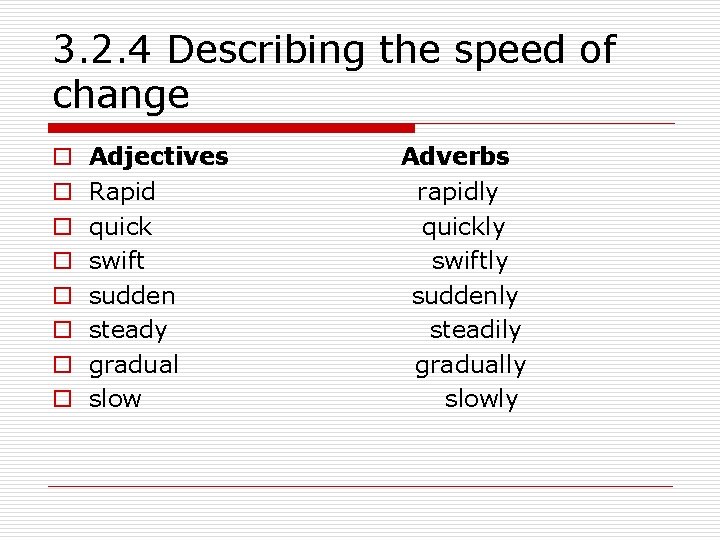
3. 2. 4 Describing the speed of change o o o o Adjectives Rapid quick swift sudden steady gradual slow Adverbs rapidly quickly swiftly suddenly steadily gradually slowly
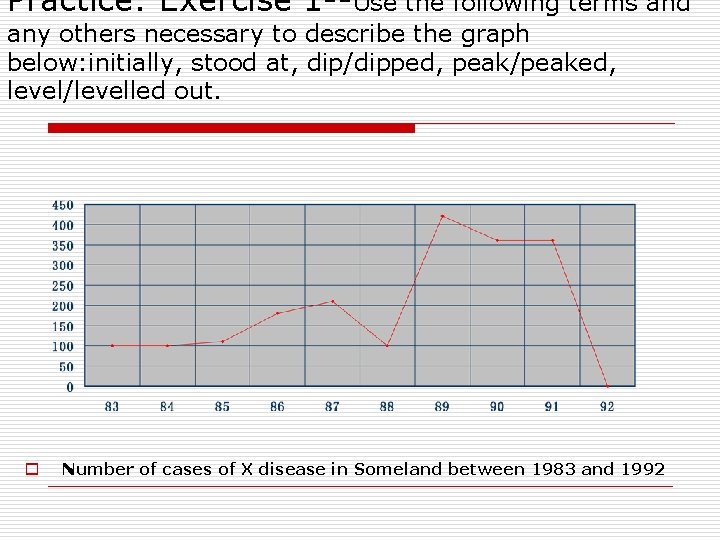
Practice: Exercise 1 --Use the following terms and any others necessary to describe the graph below: initially, stood at, dip/dipped, peak/peaked, level/levelled out. o Number of cases of X disease in Someland between 1983 and 1992
3. 3 Use language to describe a trend We can describe a trend by looking at: o ¨ the difference between two levels o ¨ the end point of the trend
3. 3. 1 Describing the difference between two levels o This year unemployment has increased by 20, 000 cases (the difference between this year and last year is 20, 000 cases). o This year there has been an increase unemployment of 5%. o Notice the prepositions. We use to increase by (with the verb) and an increase of (with the noun).
3. 3. 2 Describing the end point o This year unemployment has risen to 10% (the end result is that unemployment is up to 10%). o This year there has been a rise in unemployment to 10%. o Notice the prepositions. We use to rise to (with the verb) and a rise to (with the noun).
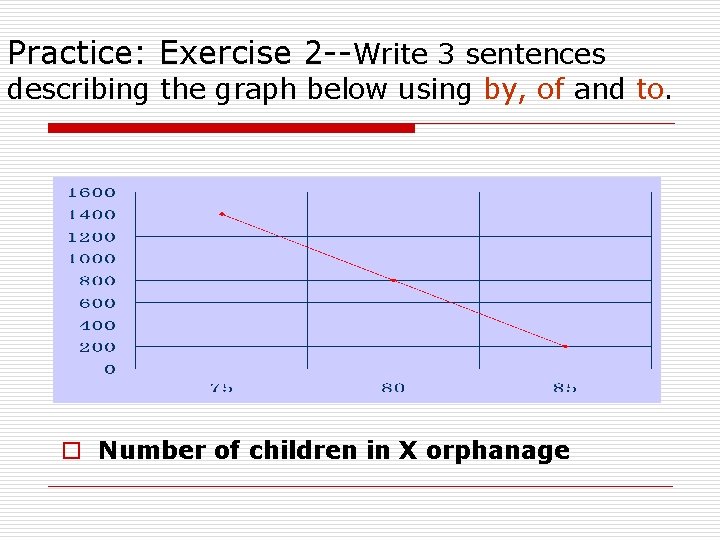
Practice: Exercise 2 --Write 3 sentences describing the graph below using by, of and to. o Number of children in X orphanage
3. 4 Expressing approximation We use words to express approximation when the point we are trying to describe is between milestones on the graph. o just under just over o well under well over o roughly o nearly o approximately o around o about
- Slides: 35