Four indirect measures of TB incidence Incidence prevalence

Four indirect measures of TB incidence Incidence, prevalence, deaths derived by rearranging 4 equations

From infection prevalence 300 incidence falling b > 50 200 incidence ss+/100, 000 300 incidence ss+/100, 000 ES TI M AT IN G From disease prevalence incidence steady b = 50 100 250 200 150 100 50 50 0 1 2 3 4 5 6 weighted duration illness = 2 y ss+/- HIV+/- DOTS+/0 ARI (%/year) TB 600 From HIV prevalence 300 250 incidence ss+/100, 000 300 200 150 100 50 400 prevalence ss+/100, 000 From case notifications incidence ss+/100, 000 IN CI DE N CE 200 proportion detected = 0. 8 0 200 150 100 no HIV 50 0 0 50 100 150 200 250 notification ss+/100, 000 0 0. 1 0. 2 0. 3 prevalence HIV/100, 000 0. 4

• “Proportion detected”: guess from quality of surveillance system e. g. USA probably detects about 95% of cases • More objective e. g. % health units reporting in any year • Beware circular arguments • Method 1 weak with poor surveillance, but strong M&S is the ultimate goal

• Disease prevalence from population surveys e. g. Philippines, China, Cambodia • Duration: time span of the condition measured in prevalence survey e. g. ss+ disease • Duration from e. g. patients and physicians asked about reporting and treatment delays (often underestimated)

Estimating mean duration: Egypt • Proportion ss+ cases treated – DOTS 0. 4 – non-DOTS 0. 5 – untreated 0. 1 • Estimated ss+ durations (years): – DOTS 1. 0 – non-DOTS 1. 5 – untreated 2. 0
 •")
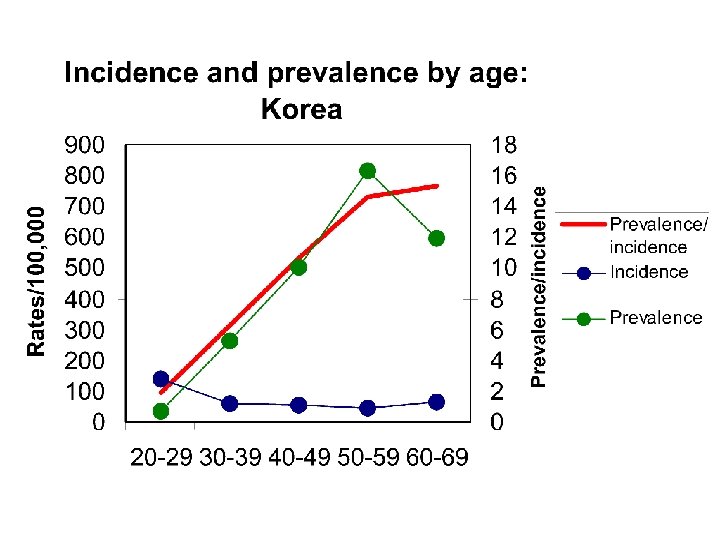
Prevalence vs incidence: Korean civil servants Tubercle and Lung Disease 76, 534 (1995) • Prevalence PTB 1990 • Incidence PTB 1989 -90 241/100 K 84/100 K/yr • Estimated duration = 241/84 = 2. 9 years (bigger ratio for older age groups)
 duration DOTS")
Estimating incidence from prevalence: Cambodia prevalence ss+ incidence DOTS (case notification rate) duration DOTS (questionnaire survey) duration non. DOTS (no treatment) 270/100 K in 2002 141/100 K in 2002 1 year 2 years Therefore: incidence ss+ non. DOTS 64/100 K total incidence (DOTS + non. DOTS) 205/100 K in 2002 NB: usually wide range on estimates
")
• Styblo ratio: 1% ARI to 50 ss+/100, 000 population (range 40 -60) • Accuracy of ARI from tuberculin surveys? • 1: 50 breaks down when TB incidence not stable (gets bigger in decline), and in presence of HIV

Origin of Styblo’s rule Bull IUAT vol 60, 1985


• Accuracy of deaths from vital registration? • Case fatality more accurately measured from observed cohorts (but fate of defaulters, transfers? ) • CFR less accurately from unseen patients, whether treated or untreated

Estimating case fatality rate: Egypt • Proportion ss+ cases treated – DOTS 0. 4 – non-DOTS 0. 5 – untreated 0. 1 • Estimated case fatality ss+ (years): – DOTS 0. 1 – non-DOTS 0. 3 – untreated 0. 7
![Estimating proportion of TB patients infected with HIV T = AR/[1+A(R-1)] T = proportion](http://slidetodoc.com/presentation_image_h2/c8b30287f284fc53606a870f14bcaba8/image-14.jpg "Estimating proportion of TB patients infected with HIV T = AR/[1+A(R-1)] T = proportion")
Estimating proportion of TB patients infected with HIV T = AR/[1+A(R-1)] T = proportion TB patients infected with HIV A = proportion adults infected with HIV R = incidence ratio (TB incidence in HIV+/TB incidence in HIV-)

 TB incidence closely correlated with HIV prevalence")
Estimated TB incidence (per 100, 000 population) TB incidence closely correlated with HIV prevalence in Africa 1000 800 600 400 200 0 0 10 20 30 HIV prevalence, adults 15 -49 y 40

TB incidence weakly related to social and economic variables: infant mortality Ln (estimated TB incidence) 6. 5 6. 0 5. 5 AF AS 5. 0 CA 4. 5 EE SA 4. 0 US WP 3. 5 ME 3. 0 WE Series 10 2. 5 2. 0 1. 5 2. 0 2. 5 3. 0 3. 5 4. 0 Ln (Infant mortality rate 1991) 4. 5 5. 0 5. 5

Association between the rate of TB among country-of-birth-specific groups in Australia and the rate of TB in the country of birth. From Watkins & Plant 2003.

What’s wrong with the estimation process? • Cannot survey the whole world (infection or disease) • Many estimates are based on guesses about case detection • Estimates often too inaccurate or too biased to judge progress to case detection targets • National estimates do not apply sub-nationally value of exploiting surveillance data
- Slides: 19