Traffic Analysis Wireshark CIS 6395 Incident Response Technologies


 Capture only UDP packets with destination port 53 (DNS requests) 1.")
 Capture only packets destined to longwood. eecs. ucf. edu 1. •")


 Display filters (also called post-filters) ◦ Only filter the view of")


 ACK: ACK # valid PSH:")
: ◦ Sub protocol categories inside the")


- Slides: 54
Traffic Analysis– Wireshark CIS 6395, Incident Response Technologies Fall 2016, Dr. Cliff Zou czou@cs. ucf. edu
Acknowledgement http: //ilta. ebiz. uapps. net/Product. Files/ productfiles/672/wireshark. ppt UC Berkley course “EE 122: Intro to Communication Networks” ◦ http: //www. eecs. berkeley. edu/~jortiz/cours es/ee 122/presentations/Wireshark. ppt Other resources: ◦ http: //openmaniak. com/wireshark_filters. p hp 2
Motivation for Network Monitoring Essential for Network Management ◦ Router and Firewall policy ◦ Detecting abnormal/error in networking ◦ Access control Security Management ◦ Detecting abnormal traffic ◦ Traffic log for future forensic analysis 3
Tools Overview Tcpdump ◦ Unix-based command-line tool used to intercept packets Including filtering to just the packets of interest Tshark ◦ Tcpdump-like capture program that comes w/ Wireshark ◦ Very similar behavior & flags to tcpdump Wireshark ◦ GUI for displaying tcpdump/tshark packet traces 4
Tcpdump example • Ran tcpdump on a Unix machine • First few lines of the output: 01: 46: 28. 808262 IP danjo. CS. Berkeley. EDU. ssh > adsl-69 -228 -2307. dsl. pltn 13. pacbell. net. 2481: . 2513546054: 2513547434(1380) ack 1268355216 win 12816 01: 46: 28. 808271 IP danjo. CS. Berkeley. EDU. ssh > adsl-69 -228 -2307. dsl. pltn 13. pacbell. net. 2481: P 1380: 2128(748) ack 1 win 12816 01: 46: 28. 808276 IP danjo. CS. Berkeley. EDU. ssh > adsl-69 -228 -2307. dsl. pltn 13. pacbell. net. 2481: . 2128: 3508(1380) ack 1 win 12816 01: 46: 28. 890021 IP adsl-69 -228 -230 -7. dsl. pltn 13. pacbell. net. 2481 > danjo. CS. Berkeley. EDU. ssh: P 1: 49(48) ack 1380 win 16560 5
Similar Output from Tshark 1190003744. 940437 61. 184. 241. 230 -> 128. 32. 48. 169 SSH Encrypted request packet len=48 1190003744. 940916 128. 32. 48. 169 -> 61. 184. 241. 230 SSH Encrypted response packet len=48 1190003744. 955764 61. 184. 241. 230 -> 128. 32. 48. 169 TCP 6943 > ssh [ACK] Seq=48 Ack=48 Win=65514 Len=0 TSV=445871583 TSER=632535493 1190003745. 035678 61. 184. 241. 230 -> 128. 32. 48. 169 SSH Encrypted request packet len=48 1190003745. 036004 128. 32. 48. 169 -> 61. 184. 241. 230 SSH Encrypted response packet len=48 1190003745. 050970 61. 184. 241. 230 -> 128. 32. 48. 169 TCP 6943 > ssh [ACK] Seq=96 Ack=96 Win=65514 Len=0 TSV=445871583 TSER=632535502 6
Filters We are often not interested in all packets flowing through the network Use filters to capture only packets of interest to us How to write filters? ◦ Refer the tcpdump/tshark man page ◦ Many example webpages on the Internet 7
Example Capture only udp packets 1. • tcpdump “udp” Capture only tcp packets 2. • tcpdump “tcp” 8
Example (contd. ) Capture only UDP packets with destination port 53 (DNS requests) 1. • tcpdump “udp dst port 53” Capture only UDP packets with source port 53 (DNS replies) 2. • tcpdump “udp src port 53” Capture only UDP packets with source or destination port 53 (DNS requests and replies) 3. • tcpdump “udp port 53” 9
Example (contd. ) Capture only packets destined to longwood. eecs. ucf. edu 1. • tcpdump “dst host longwood. eecs. ucf. edu” Capture both DNS packets and TCP packets to/from longwood. eecs. ucf. edu 2. • tcpdump “(tcp and host longwood. eecs. ucf. edu) or udp port 53” 10
Running tcpdump Requires Unix superuser/administrator privileges on ◦ http: //www. tcpdump. org/ ◦ You can do it on your own Unix machine ◦ You can install a Linux OS in Vmware on your windows machine Tcpdump for Windows ◦ Win. Dump: http: //www. winpcap. org/windump/ Free software 11
So What is Wire. Shark? Packet sniffer/protocol analyzer Open Source Network Tool Latest version of the ethereal tool
What is t. Shark? The command-line based packet capture tool Equivalent to Wireshark 13
Network Layered Structure What is the Internet? Application Web, Email, VOIP Application Transport TCP, UDP Transport Network IP Network Data Link Ethernet, cellular Data Link Physical link 14
Wireshark Interface 15
Wireshark Interface 16
Status Bar 17
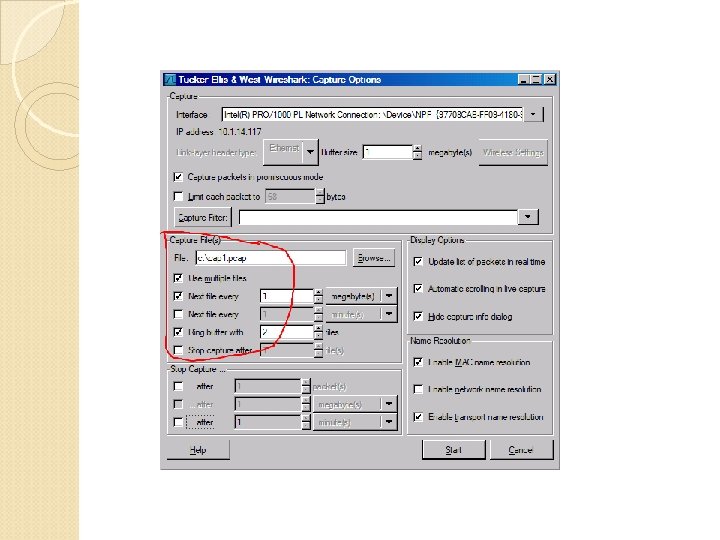
Capture Options Promiscuous mode is used to Capture all traffic In many cases this does not work • Network driver does not suppo • You are on a switch LAN
Capture Filter There are some pre-built capture filters that you can use:
Capture Filter examples host 10. 1. 11. 24 host 192. 168. 0. 1 and host 10. 1. 1 tcp port http ip not broadcast not multicast ether host 00: 04: 13: 00: 09: a 3
Capture Buffer Usage
Display Filters (Post-Filters) Display filters (also called post-filters) ◦ Only filter the view of what you are seeing ◦ All packets in the capture still exist in the trace Display filters use their own format and are much more powerful then capture filters
Display Filter There are some basic pre-built display filters, too
Display Filter Examples ip. src==10. 1. 11. 00/24 ip. addr==192. 168. 1. 10 && ip. addr==192. 168. 1. 20 tcp. port==80 || tcp. port==3389 !(ip. addr==192. 168. 1. 10 && ip. addr==192. 168. 1. 20) && (tcp. port==445 || tcp. port==139) (ip. addr==192. 168. 1. 10 && ip. addr==192. 168. 1. 20) && (udp. port==67 || udp. port==68) tcp. dstport == 80
Display Filter There are thousands of pre-defined protocol fields that You can use in the display filter! 26
TCP segment structure URG: urgent data (generally not used) ACK: ACK # valid PSH: push data now RST, SYN, FIN: connection estab (setup, teardown commands) Internet checksum (as in UDP) 32 bits source port # dest port # sequence number acknowledgement number head not UA P R S F len used checksum Receive window Urg data pnter Options (variable length) application data (variable length) counting by bytes of data (not segments!) # bytes rcvr willing to accept
Display Filter String 1, String 2 (Optional settings): ◦ Sub protocol categories inside the protocol. ◦ Look for a protocol and then click on the "+" character. ◦ Example: ◦ tcp. srcport == 80 ◦ tcp. flags == 2 SYN packet Or use “Tcp. flags. syn==1” ◦ tcp. flags == 18 SYN/ACK ◦ Note of TCP Flag field: 28
Display Filter Expressions snmp || dns || icmp ◦ Display the SNMP or DNS or ICMP traffics. tcp. port == 25 ◦ Display packets with TCP source or destination port 25. tcp. flags ◦ Display packets having a TCP flags tcp. flags. syn == 0 x 02 ◦ Display packets with a TCP SYN flag. If the filter syntax is correct, it will be highlighted in green, otherwise if there is a syntax mistake it will be highlighted in red. Correct syntax Wrong syntax 29
Save Filtered Packets as Text After Using Display Filter We can save all filtered packets in text file for further analysis Operation: File Export packet dissections as “plain text” file 1). In “packet range” option, select “Displayed” 2). In choose “summary line” or “detail” 30
Save Filtered Packets in Wireshark format After Using Display Filter We can also save all filtered packets in the original wireshark format for further analysis Operation: 1. Enter Display filter to show packets you want 2. Go to "Edit>" and choose "Mark all displayed packets“ 3. Go to “File” Export specific packets… 4. Choose the option “Marked packets” to save the file 31
Protocol Hierarchy
Protocol Hierarchy
Follow TCP Stream
Follow TCP Stream red - stuff you sent blue - stuff you get
Filter out/in Single TCP Stream When click “filter out this TCP stream” in previous page’s box, new filter string will contain like: ◦ http and !(tcp. stream eq 5) So, if you use “tcp. stream eq 5” as filter string, you keep this HTTP session 36
Expert Info
Expert Info
Conversations
Conversations
Use the “Copy” button to copy all text into clipboard Then, you can analyze this text file to get what statistics you want 41
Find End. Point Statistics Menu “statistics” “endpoint list” “TCP” You can sort by field 42 “Tx” : transmit “Rx” : receive
Find End. Point Statistics Use the “Copy” button to copy all text into clipboard Then, you can analyze this text file to get what statistics you want 43
Export HTTP
Export HTTP Objects Now you can save all files transmitted in Web traffic!
HTTP Analysis
HTTP Analysis – Load Distribution Click “Create Stat” button You can add “filter” to only Show selected traffic
HTTP Analysis – Packet Counter
HTTP Analysis – Requests
Improving Wire. Shark Performance Don’t use capture filters Increase your read buffer size Don’t update the screen dynamically Get a faster computer Use a TAP Don’t resolve DNS hostnames
Post-Processing Text File For saved text-format packet files, further analysis needs coding or special tools One useful tool on Unix: Grep ◦ On Windows: Power. Grep http: //www. powergrep. com/ ◦ Command-line based utility for searching plain-text data sets for lines matching a regular expression. 51
Basic usage of Grep Command-line text-search program in Linux Some useful usage: ◦ ◦ ◦ Grep ‘word’ filename # find lines with ‘word’ Grep –v ‘word’ filename # find lines without ‘word’ Grep ‘^word’ filename # find lines beginning with ‘word’ Grep ‘word’ filename > file 2 # output lines with ‘word’ to file 2 ls -l | grep rwxrwxrwx # list files that have ‘rwxrwxrwx’ feature grep '^[0 -4]‘ filename # find lines beginning with any of the numbers from 0 -4 ◦ Grep –c ‘word’ filename # find lines with ‘word’ and print out the number of these lines ◦ Grep –i ‘word’ filename # find lines with ‘word’ regardless of case Many tutorials on grep online ◦ http: //www. cyberciti. biz/faq/howto-use-grep-command-in-linux-unix/ 52 ◦ http: //www. thegeekstuff. com/2009/03/15 -practical-unix-grep-command-
On-line Wireshark Trace Files Public available. pcap files: ◦ http: //www. netresec. com/? page=Pcap. File s http: //www. tp. org/jay/nwanalysis/traces/Lab %20 Trace%20 Files/ Wiki Sample capture ◦ https: //wiki. wireshark. org/Sample. Captures 53
Example Trace File and Questions Network Forensic Puzzle Contests ◦ http: //forensicscontest. com/2010/02/03/pu zzle-4 -the-curious-mr-x Shark. Fest'15 Packet Challenge ◦ https: //sharkfest. wireshark. org/assets/pres entations 15/packetchallenge. zip 54