Using Splunk A Case Study Incident Response Technologies


- Slides: 27

Using Splunk – A Case Study Incident Response Technologies Dr. Cliff Zou

Acknowledgement This case study comes from textbook: ◦ Network Forensics: Tracking hackers through cyberspace, by Sherri Davidoff and Jonathan Ham. Prentice Hall; June 23, 2012 2

The Book’s Free Case Study Files They are free to download and use: ◦ https: //lmgsecurity. com/wpcontent/cache/page_enhanced/lmgsecurity. com/nf/_index. html_gzip For self-study or educational use ◦ I have uploaded this lecture’s case study file, ‘Network. Forensics-Ch 8 -Event. Logs. zip’, on web. Course

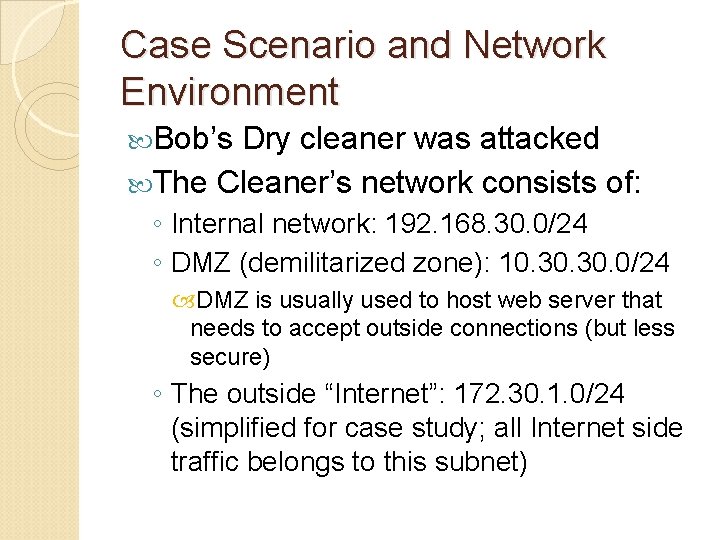
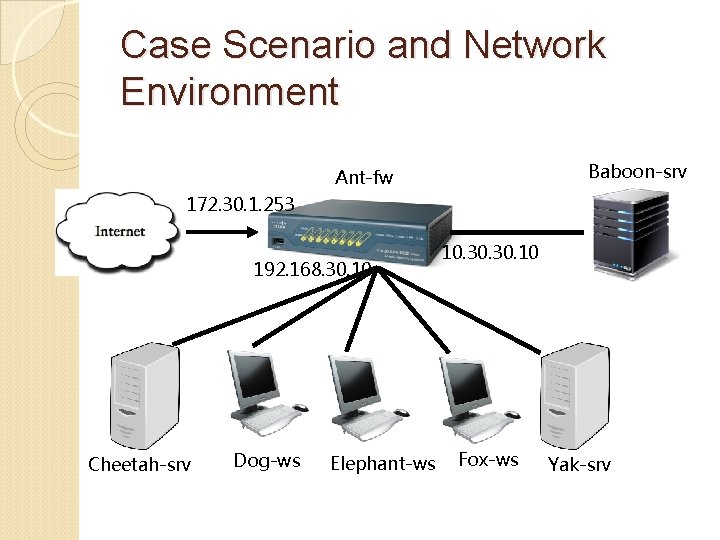
Case Scenario and Network Environment Bob’s Dry cleaner was attacked The Cleaner’s network consists of: ◦ Internal network: 192. 168. 30. 0/24 ◦ DMZ (demilitarized zone): 10. 30. 0/24 DMZ is usually used to host web server that needs to accept outside connections (but less secure) ◦ The outside “Internet”: 172. 30. 1. 0/24 (simplified for case study; all Internet side traffic belongs to this subnet)

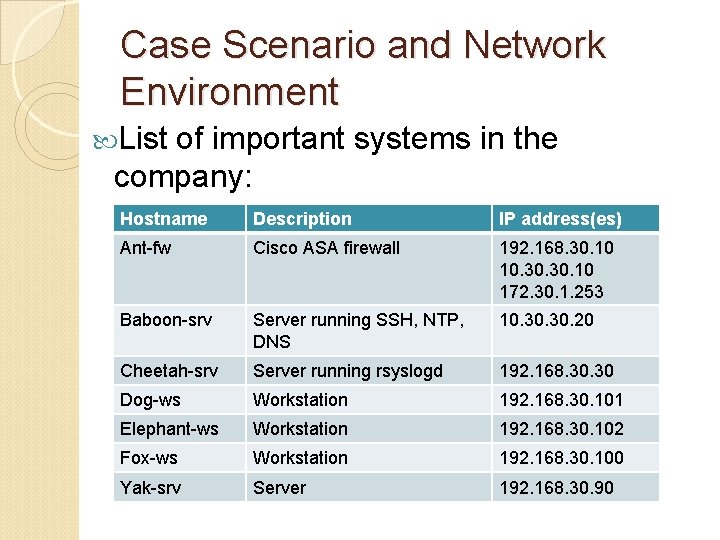
Case Scenario and Network Environment List of important systems in the company: Hostname Description IP address(es) Ant-fw Cisco ASA firewall 192. 168. 30. 10 10. 30. 10 172. 30. 1. 253 Baboon-srv Server running SSH, NTP, DNS 10. 30. 20 Cheetah-srv Server running rsyslogd 192. 168. 30 Dog-ws Workstation 192. 168. 30. 101 Elephant-ws Workstation 192. 168. 30. 102 Fox-ws Workstation 192. 168. 30. 100 Yak-srv Server 192. 168. 30. 90

Case Scenario and Network Environment Baboon-srv Ant-fw 172. 30. 1. 253 192. 168. 30. 10 Cheetah-srv Dog-ws Elephant-ws 10. 30. 10 Fox-ws Yak-srv

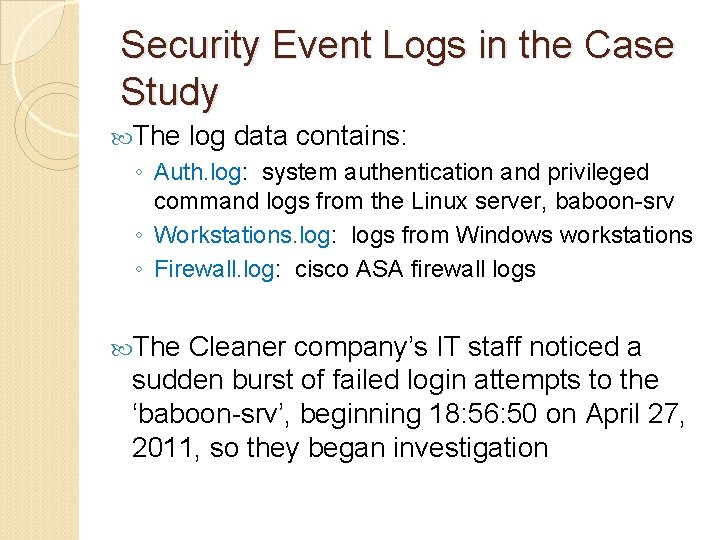
Security Event Logs in the Case Study The log data contains: ◦ Auth. log: system authentication and privileged command logs from the Linux server, baboon-srv ◦ Workstations. log: logs from Windows workstations ◦ Firewall. log: cisco ASA firewall logs The Cleaner company’s IT staff noticed a sudden burst of failed login attempts to the ‘baboon-srv’, beginning 18: 56: 50 on April 27, 2011, so they began investigation

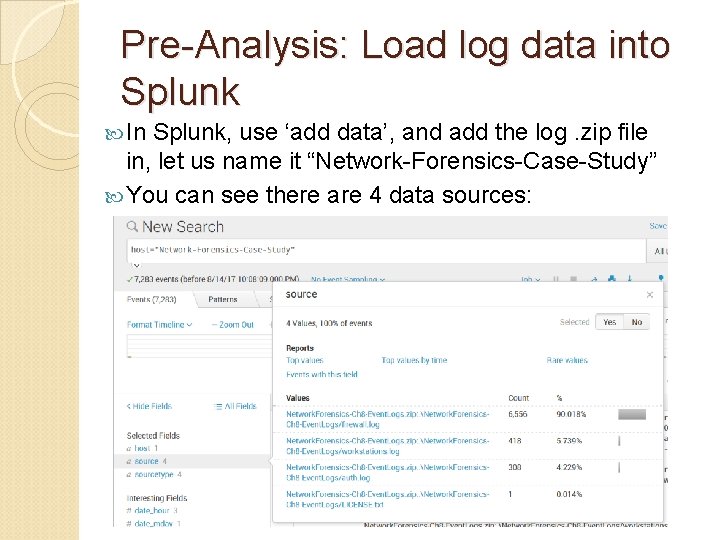
Pre-Analysis: Load log data into Splunk In Splunk, use ‘add data’, and add the log. zip file in, let us name it “Network-Forensics-Case-Study” You can see there are 4 data sources:

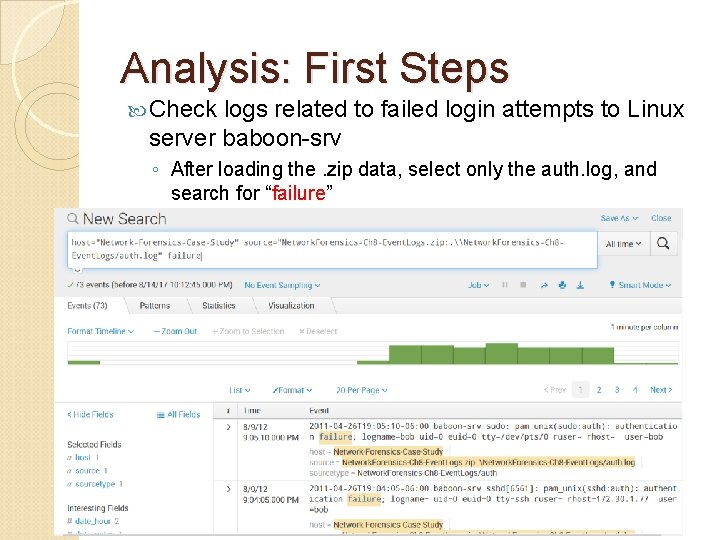
Analysis: First Steps Check logs related to failed login attempts to Linux server baboon-srv ◦ After loading the. zip data, select only the auth. log, and search for “failure”

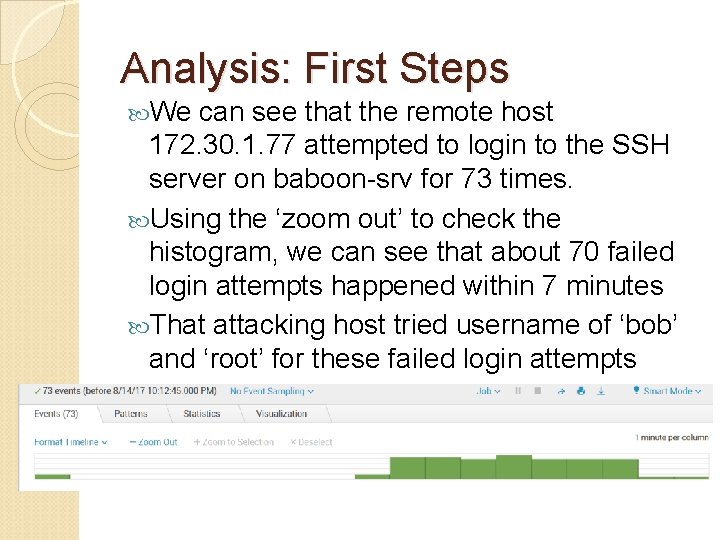
Analysis: First Steps We can see that the remote host 172. 30. 1. 77 attempted to login to the SSH server on baboon-srv for 73 times. Using the ‘zoom out’ to check the histogram, we can see that about 70 failed login attempts happened within 7 minutes That attacking host tried username of ‘bob’ and ‘root’ for these failed login attempts

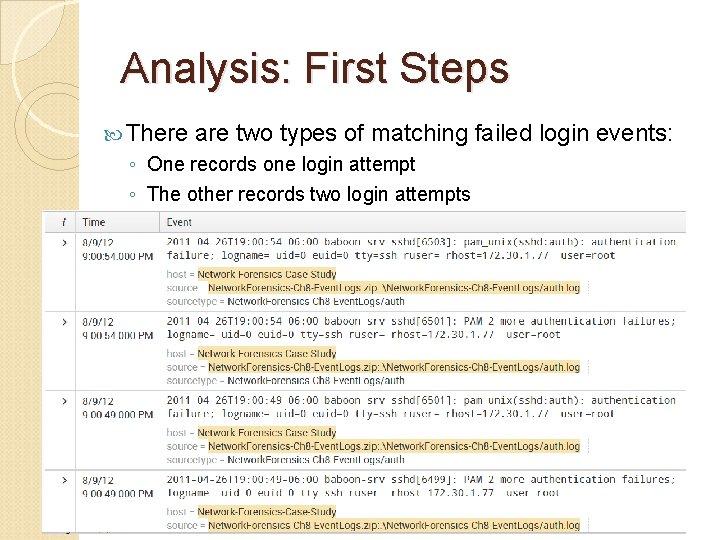
Analysis: First Steps There are two types of matching failed login events: ◦ One records one login attempt ◦ The other records two login attempts

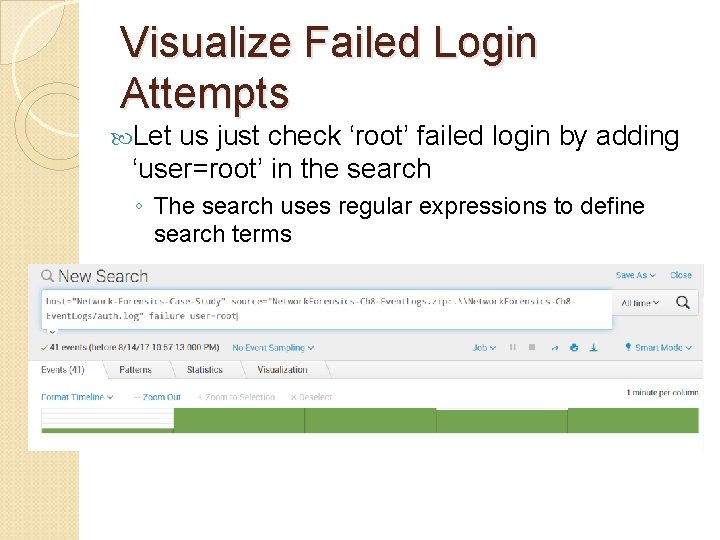
Visualize Failed Login Attempts Let us just check ‘root’ failed login by adding ‘user=root’ in the search ◦ The search uses regular expressions to define search terms

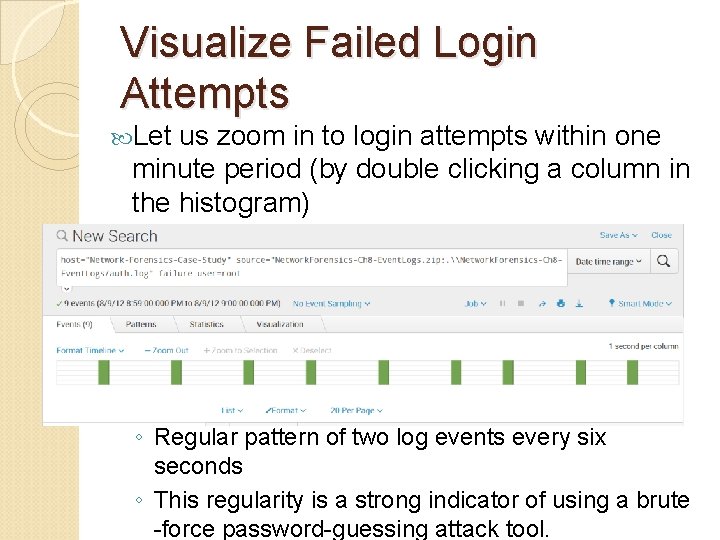
Visualize Failed Login Attempts Let us zoom in to login attempts within one minute period (by double clicking a column in the histogram) ◦ Regular pattern of two log events every six seconds ◦ This regularity is a strong indicator of using a brute -force password-guessing attack tool.

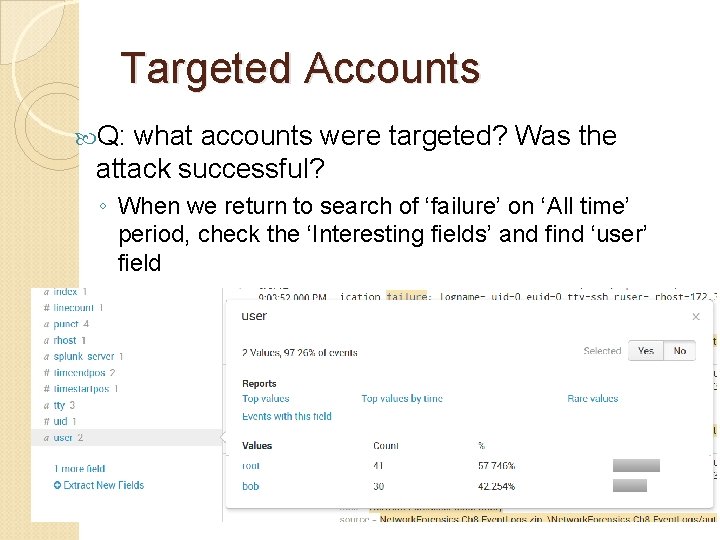
Targeted Accounts Q: what accounts were targeted? Was the attack successful? ◦ When we return to search of ‘failure’ on ‘All time’ period, check the ‘Interesting fields’ and find ‘user’ field

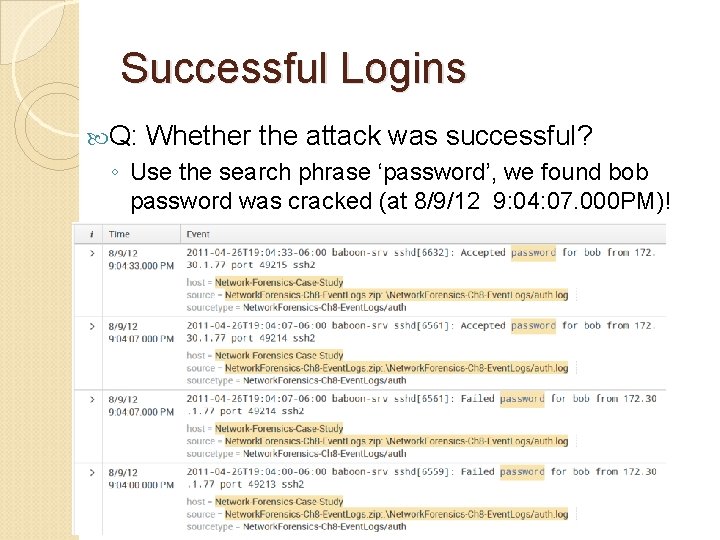
Successful Logins Q: Whether the attack was successful? ◦ Use the search phrase ‘password’, we found bob password was cracked (at 8/9/12 9: 04: 07. 000 PM)!

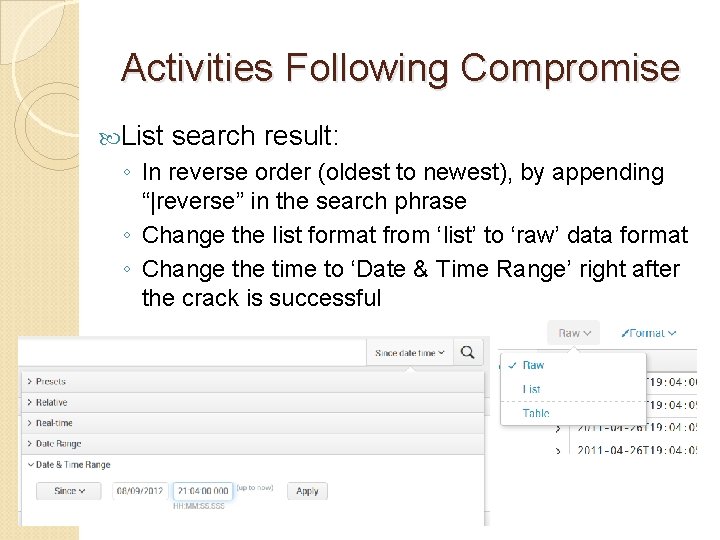
Activities Following Compromise List search result: ◦ In reverse order (oldest to newest), by appending “|reverse” in the search phrase ◦ Change the list format from ‘list’ to ‘raw’ data format ◦ Change the time to ‘Date & Time Range’ right after the crack is successful

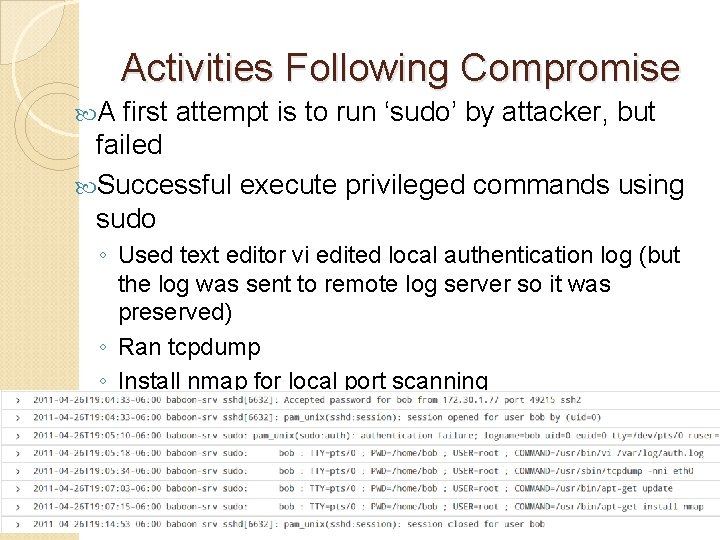
Activities Following Compromise A first attempt is to run ‘sudo’ by attacker, but failed Successful execute privileged commands using sudo ◦ Used text editor vi edited local authentication log (but the log was sent to remote log server so it was preserved) ◦ Ran tcpdump ◦ Install nmap for local port scanning Not all commands are logged in the auth. log file, only privileged commands are logged. ◦ Attacker logged out after 7 minutes (what happened here? )

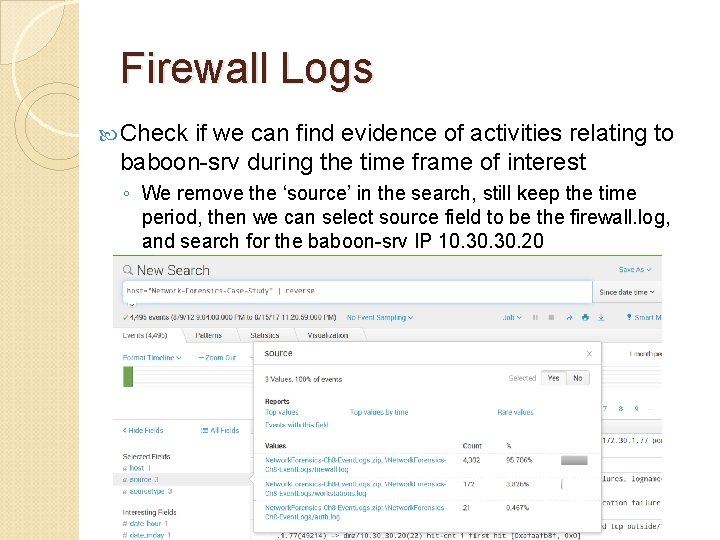
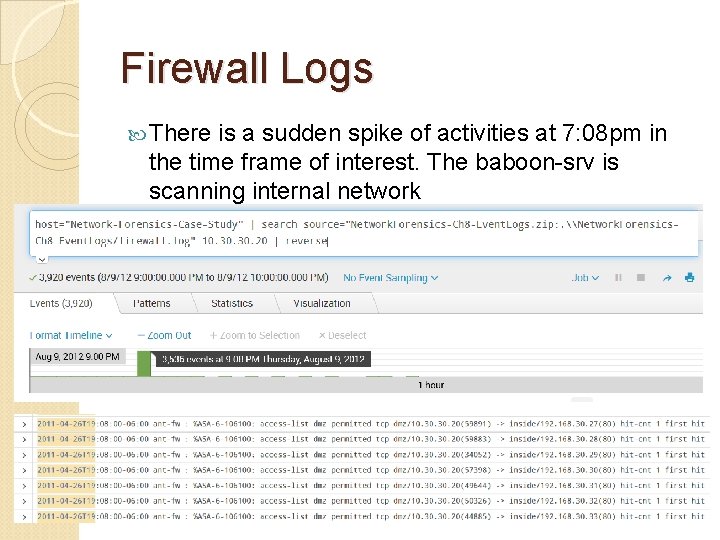
Firewall Logs Check if we can find evidence of activities relating to baboon-srv during the time frame of interest ◦ We remove the ‘source’ in the search, still keep the time period, then we can select source field to be the firewall. log, and search for the baboon-srv IP 10. 30. 20

Firewall Logs There is a sudden spike of activities at 7: 08 pm in the time frame of interest. The baboon-srv is scanning internal network

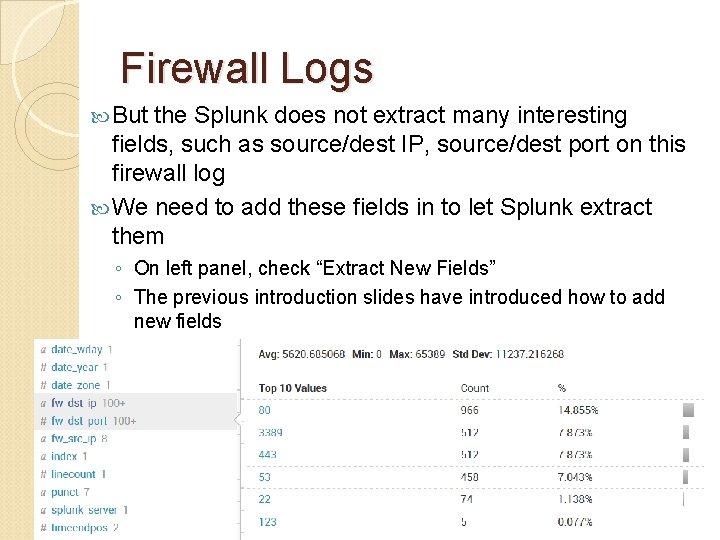
Firewall Logs But the Splunk does not extract many interesting fields, such as source/dest IP, source/dest port on this firewall log We need to add these fields in to let Splunk extract them ◦ On left panel, check “Extract New Fields” ◦ The previous introduction slides have introduced how to add new fields Let us add three fields named as: fw_src_ip, fw_dst_port, you can see they are added to left field panel

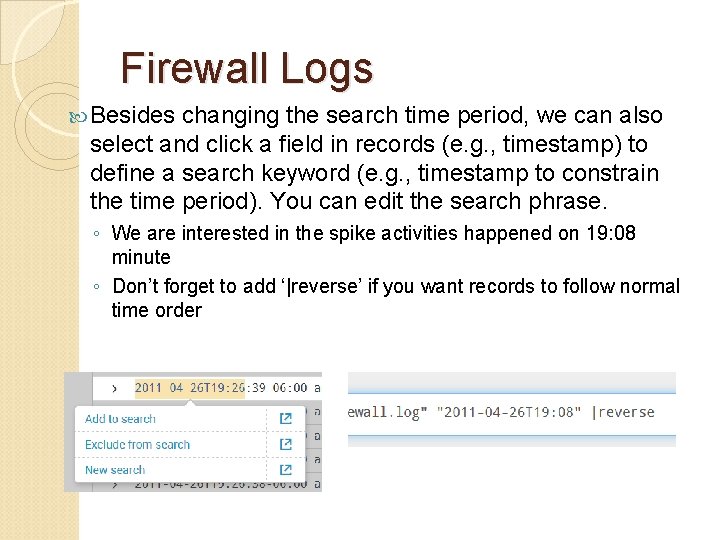
Firewall Logs Besides changing the search time period, we can also select and click a field in records (e. g. , timestamp) to define a search keyword (e. g. , timestamp to constrain the time period). You can edit the search phrase. ◦ We are interested in the spike activities happened on 19: 08 minute ◦ Don’t forget to add ‘|reverse’ if you want records to follow normal time order

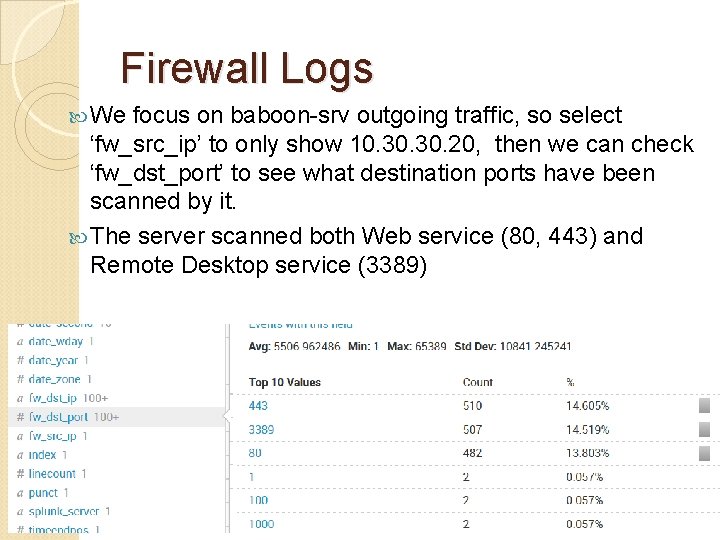
Firewall Logs We focus on baboon-srv outgoing traffic, so select ‘fw_src_ip’ to only show 10. 30. 20, then we can check ‘fw_dst_port’ to see what destination ports have been scanned by it. The server scanned both Web service (80, 443) and Remote Desktop service (3389)

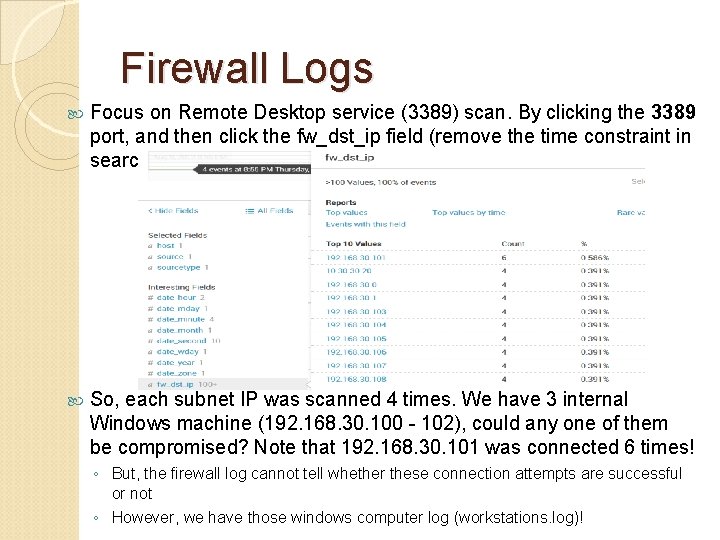
Firewall Logs Focus on Remote Desktop service (3389) scan. By clicking the 3389 port, and then click the fw_dst_ip field (remove the time constraint in search field) So, each subnet IP was scanned 4 times. We have 3 internal Windows machine (192. 168. 30. 100 - 102), could any one of them be compromised? Note that 192. 168. 30. 101 was connected 6 times! ◦ But, the firewall log cannot tell whether these connection attempts are successful or not ◦ However, we have those windows computer log (workstations. log)!

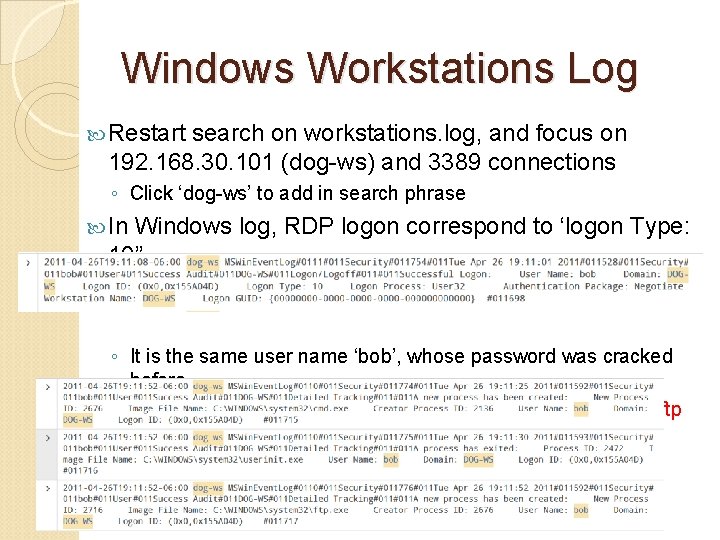
Windows Workstations Log Restart search on workstations. log, and focus on 192. 168. 30. 101 (dog-ws) and 3389 connections ◦ Click ‘dog-ws’ to add in search phrase In Windows log, RDP logon correspond to ‘logon Type: 10” ◦ It is the same user name ‘bob’, whose password was cracked before ◦ And the account runs ‘cmd. exe’, then runs ‘ftp. exe’ (who he ftp with? )

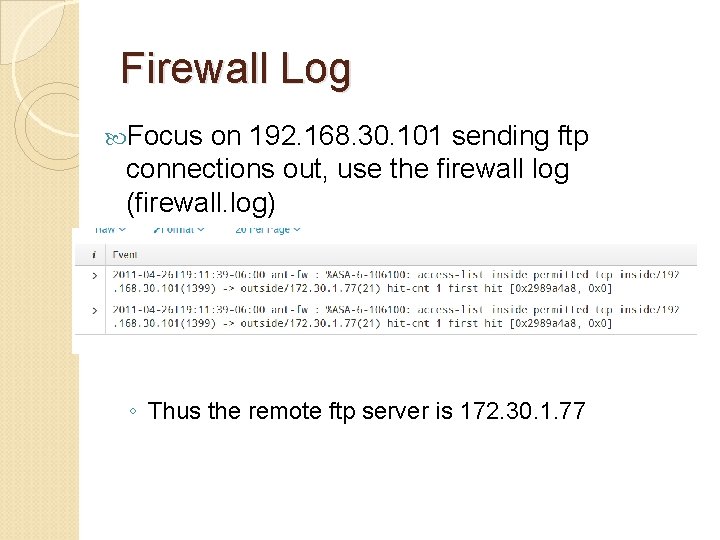
Firewall Log Focus on 192. 168. 30. 101 sending ftp connections out, use the firewall log (firewall. log) ◦ Thus choose fw_src_ip and select 192. 168. 30. 101 ◦ Thus the remote ftp server is 172. 30. 1. 77

Afterwards Response Containment/Eradication: ◦ Rebuild the two compromised machine, 10. 30. 20 (in DMZ) and 192. 168. 30. 101 ◦ Change all passwords related to above two PCs ◦ Limite DMZ access to internal subnet For example, disable RDP from DMZ to internal sub ◦ Block outbound FTP or other not needed ports ◦ Consider two-factor authentication to remove

Additional Sources of Evidence Network flow data ◦ Then we will know what has been transferred in the outgoing FTP connection to attacker’s ftp server Hard drives of the two compromised machines