Healthy Hearts Healthy Lungs Living Longer and Living


 were current")


 Number of cases 78 Rate 50.")


 Ø Obesity (BMI > 30)")
 Ø Obesity (BMI > 30)")


 0.")


- Slides: 91
Healthy Hearts, Healthy Lungs: Living Longer and Living Better Samer Kanaan, M. D.
Goals Ø Understand the Societal impact of Air Pollution and Smoking Ø Specifically, their impact on Lung Cancer Ø Understand the Societal impact of Heart Disease Ø How to have a Healthy Heart with focus on Nutrition and Exercise Ø Introduce Newer Surgical Treatment options available for Lung Disease such as Video-Assisted Thorascopic Surgery (VATS) Lobectomy Ø Introduce Surgical Treatment options available for Heart Disease such as Off-pump Coronary Artery Bypass Grafting (OPCABG), Robotic Surgery and Endoscopic Vein Harvesting (EVH)
Air Pollution
Air Pollution Two types dominate the problem in the US: Ozone and Particle Pollution Ozone Ø Extremely reactive gas molecule Ø Primary ingredient in smog air pollution Ø Very harmful to breathe Ø Attacks lung tissue by reacting chemically with it Ø At risk from breathing Ozone Ø Children and Teens Ø Age 65 and older Ø People who work or exercise outdoors Ø People with existing lung disease (COPD, Asthma) Ø “Responders” who are healthy but react more strongly to ozone Ø Some segments of society (high unemployment, high public transit use, and African Americans) face higher risks from dying prematurely secondary to ozone pollution
Air Pollution Ø Harm to your Health Ø Shortness of breath Ø Chest pain with inhalation Ø Wheezing or Coughing Ø Asthma Ø Increased susceptibility to respiratory infections and pulmonary inflammation Ø Increased need for people with lung disease to go to the hospital Ø Reduced lung function Ø Decreased lung function in college freshman who were lifelong residents of Los Angeles or San Francisco Ø Increased risk or heart attacks, arrhythmias, stroke, and premature death Ø Premature death Ø 3700 deaths / yr with 10 parts per billion increase in ozone level
Particle Pollution Ø Air Pollution EPA regulates particle pollution as PM 2. 5 (fine particles) and PM 10 (all particles 10 micrometers or less in diameter). Ø Prenatal Harm Ø Increased risk of preterm births with chronic exposure to high levels of air pollution during the last 6 weeks of pregnancy Ø Newborn Harm Ø Air pollution may increase the risk of sudden death syndrome (SIDS) Ø May increase risk of babies born with low birth weight Ø Prolonged exposure to Fine Particle Pollution Increases Odds of Severe Infant Bronchiolitis For each 10 ug/m 3 in PM 2. 5, risk of bronchiolitis increased by 9%
Particle Pollution Air Pollution Ø Harm to Children Ø Long term exposure to air pollutants associated with increased risk of asthmatic bronchitis, hay fever, eczema, and allergic sensitization Ø Worsening of Asthma Ø Increased prevalence and incidence of cough and bronchitis Ø Increased risk of upper / lower respiratory infections Ø Exacerbates cystic fibrosis Ø Diesel school buses expose children to four times the diesel exhaust versus car Ø Short and Long-term decreased lung function Ø 1759 children age 10 -18 in Southern California who grew up in more polluted areas had an average drop in lung function 20% below what was expected for the child’s age
Particle Pollution Air Pollution Ø Harm to Adults Ø California Air Resources Board estimates premature deaths in California from particle pollution at 14, 000 – 24, 000 annually with the possibility of as high as 41, 000 annually Ø Dutch and British studies confirm that Long-term exposure to Air Pollution is Deadly and Shortens lives Ø Long term exposure to air pollution, especially from highway traffic appears to increase women’s risk of lower lung function, COPD, and premature death from cardiopulmonary causes Ø Pollution from heavy highway traffic contributes to higher risks for heart attacks, allergies, premature births, and death of newborns Ø Long-term exposure to Air Pollution Increases risk of Developing COPD
Particle Pollution Air Pollution Ø Harm to Adults Ø Truck drivers, dockworkers, and railroad workers face higher risk of death from lung cancer, heart disease, and COPD from breathing diesel emissions on the job. Ø 50, 000 members of Teamsters Union Ø Smoking rates were similar to general population Ø 49% higher death rate from heart disease for truck drivers Ø 32% higher death rate from heart disease for dockworkers Ø 10% higher Lung cancer death rate for both truck drivers and dockworkers
Particle Pollution may increase the risk of Blood Clots in the Legs Italian study of 870 patients with DVT’s compared to 1210 controls Showed that an increase of 10 ug/m 3 increased the risk of blood clots in the legs by 70 percent
Air Pollution Ø Data from Women’s Health Initiative: 36 US cities / 66, 000 women Ø Risk of Fatal and Nonfatal Cardiovascular Events Increases with increasing air pollution levels Ø For every increase of 10 ug/m 3 in PM 2. 5, 76% increased risk of death from cardiovascular disease
Air Pollution
Air Pollution Number of people living in counties with air quality concentrations above the level of the primary National Ambient Air Quality Standards (NAAQS) in 2006.
What to Do about Air Pollution Protect Yourself Ø Ø Ø Pay attention to forecasts for high air pollution days to know when to take precautions Avoid exercising near high-traffic areas Avoid exercising outdoors when pollution levels are high, or substitute an activity that requires less exertion Ø Do not let anyone smoke indoors and support measures to make all places smoke-free Ø Reduce the use of fireplaces and wood-burning stoves. Clean up Pollution Ø Atlanta Georgia during 1996 Olympics Ø Reduced traffic during the Olympics succeeded in not just reducing congestion, but in improving the health of children with asthma Ø City brought in more buses, more subway cars, and encouraged ridesharing and telecommuting during the Summer Olympic Games Ø These measures created a prolonged period of low ozone pollution that resulted in significantly lower rates of childhood asthma events for children aged 1– 16 Ø The number of asthma acute care events (e. g. , treatment and hospitalization) decreased 42 percent in the Georgia Medicaid claims files
Air Pollution Ø Long-term improvement in Air Quality Benefits Lung function Ø Reduction in PM 2. 5 concentrations Would Increase Life Expectancy Ø Harvard Six Cities Study found that the deaths associated with exposure to fine particles occur primarily within two years of exposure, implying that reductions in air pollution levels can be expected to produce rapid improvements in public health Ø Multiple studies and experts agree that reductions in air pollution levels with have an impact in the public health sector in years not decades of the reduction
Smoking
Smoking Facts Ø Smoking is the most important preventable cause of morbidity and premature mortality Worldwide Ø Ø 438, 000 Americans die each year from smoking related diseases Smoking is responsible for more than one in five US deaths About ½ of all regular smokers will die from the addiction Smoking costs the United States $193 billion in 2004 Ø Cigarette smoke contains over 4800 chemicals, of which 69 are known to cause cancer Ø Smoking is directly responsible for 90% of the 161, 000 Lung Cancer deaths Ø Smoking is directly responsible for 80 -90% of the 127, 000 COPD deaths Ø Smoking is major risk factor for Coronary artery disease, stroke, and lower respiratory infections
Smoking Facts Smoking Ø Smoking reduces the normal life expectancy by an average of 13 -15 years Ø 8. 6 million Americans have a smoking related illness Ø This means that for every 1 American who dies from smoking related disease, there are 20 more people who suffer from a smoking related disease
List of diseases caused by smoking COPD Coronary Artery Disease Ø 60 % Higher Risk of dying from heart attack in smokers over 65 than non smokers Stroke Ø Men over 65 who smoke are twice as likely to die from stroke than non smokers Ø Women over 65 who smoke are 1 ½ times as likely to die from stroke than non smokers AAA Acute Myeloid Leukemia Cataracts 2 -3 times the risk higher in smokers Pneumonia Periodontitis Bladder cancer Esophageal cancer Laryngeal cancer Lung cancer Oral cancer Throat cancer Cervical cancer Kidney cancer Stomach cancer Pancreatic cancer Infertility Peptic Ulcer Disease Slow wound healing Dementia / Alzheimer’s Ø Smokers have far greater chance of developing dementia than nonsmokers
Ø Worldwide Smoking Ø Tobacco is leading cause of preventable death worldwide Ø Tobacco kills more than HIV/AIDS, Tuberculosis, and Malaria COMBINED Ø Tobacco responsible for 5 million deaths each year and will increase to 8 million / year in 2030 Ø Tobacco was responsible for 100 million deaths in the 20 th Century Ø With current usage, tobacco could kill 1 billion people in the 21 st Century Ø 48% Men versus 10% Women smoke Ø China: 63% Men versus 3. 8% Women 300 million people smoke in China which is more than the entire US population
Smoking Facts Ø 45. 3 million Americans (20. 6 % of adults) were current smokers in 2006 Ø 45. 7 million Americans were former smokers in 2006 Ø Prevalence of smoking decreased 40% between 1965 and 1990, but has been UNCHANGED since Ø Males Ø Females Ø American Indians/ Alaskan Natives Ø Ø Whites Blacks Hispanics Asians 23. 6% 17. 8% 32. 2% 21. 8% 22. 6% 15. 1% 10. 3%
2007 20% high school students were smokers 6% middle school students were smokers
Smoking Facts Smoking Ø 2005: Advertising by the 5 major tobacco companies totaled $13. 1 billion $35 million / day Ø 90% of adults who smoke start by the age of 21 Ø 50% became regular smokers by the age of 18 Ø Average youth in the US is annually exposed to 559 tobacco ads Ø 617 tobacco ads for every adult female Ø 892 tobacco ads for every adult African American
Smoking Ø Smoking in Pregnancy Ø Smoking accounts for 20 -30% of low birth weight Ø 14% of preterm deliveries Ø 10% of all infant deaths Ø 10. 7% of women smoked during pregnancy in 2005 (down 45% from 1990) Ø Neonatal health-care costs attributed to maternal smoking is $366 million per year Ø Mothers who smoke can pass nicotine to their children through breast milk
Second Hand Smoke Ø Described by the EPA as a known human Group A carcinogen Ø Contains more than 250 toxic or cancer causing chemicals, including formaldehyde, benzene, vinyl chloride, arsenic, ammonia, and hydrogen cyanide Ø Current Surgeon General report concluded that there is NO risk free level of exposure to secondhand smoke Ø Second hand smoke even in short exposures can cause platelets to become stickier, damage blood vessel lining, decrease coronary flow velocity, and reduce heart rate variability all of these can increase the risk of a heart attack Ø 3, 400 lung cancer deaths / year Ø 46, 000 heart disease deaths / year
Second Hand Smoke Ø Smoking by Parents Ø Exacerbation of asthma à 400, 000 – 1, 000 asthma episodes per year Ø Increased frequency of colds and ear infection à 790, 000 ear infections per year Ø Increased risk of respiratory infections 150, 000 - 300, 000 lower respiratory infections per year Ø Increased frequency of Sudden Infant Death Syndrome à 430 cases per year Ø 21 million or 35% of children live with smokers on a regular basis
What to do about Smoking QUIT DO NOT SMOKE AVOID SECOND HAND SMOKE
What to do about Smoking Ø WHO proven policies for effective tobacco control Ø Raising taxes and prices Ø Price of cigarettes has very significant effect on youth smoking every 10% increase in price decreased youth consumption by 7% Ø Ø Ø Banning advertising, promotion and sponsorship Protecting people from secondhand smoke Warning everyone about the dangers of tobacco Offering help to people who want to quit Carefully monitoring the epidemic and prevention policies
Smoking Cessation Smoking Ø Quitting often requires multiple attempts Ø Cutting down on cigarettes but not quitting DOES NOT reduce mortality risks from tobacco related illnesses Ø Only 5% long term success with quitting “cold turkey” Ø Counseling and medication in combination is more effective than either one alone Ø There are 7 FDA approved medications to aid in quitting smoking
Benefits Smoking Ø 20 minutes after last cigarette: blood pressure decreases; pulse rate drops; and body temperature increases Ø 8 hours after quitting: carbon monoxide level in blood drops to normal; oxygen level in blood increases to normal Ø 24 hours after quitting: chance of a heart attack decreases Ø 48 hours after quitting: nerve endings start regrowing; ability to smell and taste is enhanced Ø 2 weeks to 3 months after quitting: circulation improves; walking becomes easier; lung function increases Ø 1 to 9 months after quitting: coughing, sinus congestion, fatigue, shortness of breath decreases
Benefits Smoking Ø 1 year after quitting: excess risk of coronary heart disease is decreased to half that of a smoker Ø 5 to 15 years after quitting: stroke risk is reduced to that of people who have never smoked Ø 10 years after quitting: risk of lung cancer drops to as little as one-half that of continuing smokers risk of cancer of the mouth, throat, esophagus, bladder, kidney, and pancreas decreases risk of ulcer decreases Ø 15 years after quitting: risk of coronary heart disease is now similar to that of people who have never smoked risk of death returns to nearly the level of people who have never smoked
Life Expectancy Benefit Smoking Ø Quit at age 35 years Ø Increase in life expectancy versus those who continue to smoke: Ø 6. 9 to 8. 5 years for men Ø 6. 1 to 7. 7 years for women Ø Quit at age 45 years Ø Increase in life expectancy versus those who continue to smoke: Ø 5. 6 to 7. 1 years for men Ø 5. 6 to 7. 2 years for women Ø Quit at age 55 years Ø Increase in life expectancy versus those who continue to smoke: Ø 3. 4 to 4. 8 years for men Ø 4. 2 to 5. 6 years for women Ø Quit at age 65 years Ø Increase in life expectancy versus those who continue to smoke: Ø 1. 4 to 2. 0 years for men Ø 2. 7 to 3. 7 years for women
Lung Cancer
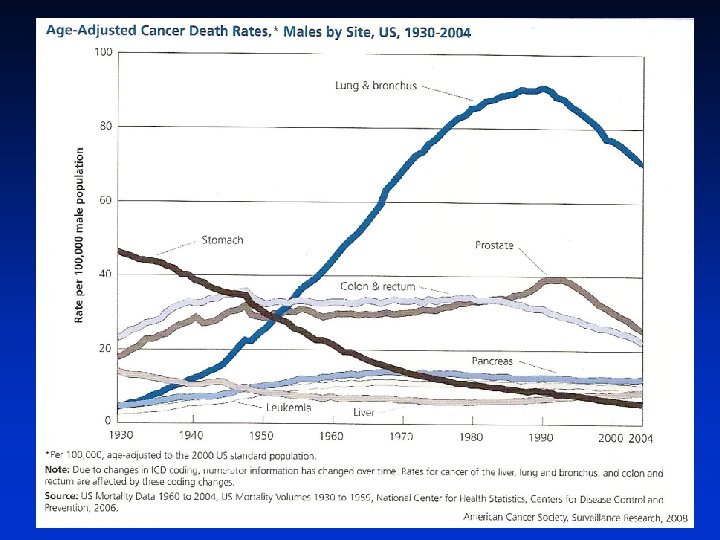
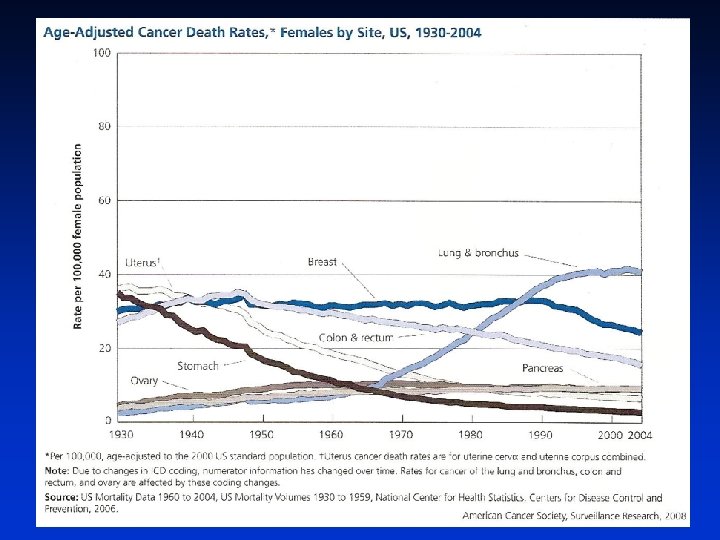
US Epidemiology Ø 215, 020 new cases in the US in 2008 Ø 114, 690 in men Ø 100, 330 in women Ø Accounts for 15% of all new cancer cases Ø Average at diagnosis is 71 Ø Lifetime risk is 1 in 13 for men and 1 in 16 for women Ø 161, 840 deaths in the US in 2008 Ø 90, 810 men Ø 71, 030 women Ø Accounts for 29% of all cancer deaths Lung cancer is the leading cause of cancer death for both men and women
More people die of Lung cancer than of Colon, Breast, and Prostate cancers COMBINED! Lung Cancer Deaths in 2008 161, 840 Colon Cancer Deaths = Breast Cancer Deaths = Prostate Cancer Deaths = 49, 960 40, 480 28, 660 Combined Cancer Deaths = 119, 100
Worldwide Lung Cancer Ø Estimated 1. 5 million new cases of Lung cancer expected each year Ø Accounts for 12% of total cancer diagnoses Ø More than 1. 3 million people expected to die from Lung cancer each year Ø Leading cause of cancer death in Men Ø Second leading cause of cancer death in Women
Ø Smoking Risk Factors Ø Responsible for 87% of Lung Cancer Deaths Annually Ø Latent period of 20 -25 years Ø Dose related Ø (9 -10 fold risk average smoker, 20 fold risk for heavy smoker) Ø Secondhand smoke Ø Non-smoking spouses who live with a smoker have a 20 -30% greater risk Ø Air pollution Ø Worldwide, 5% of deaths from Lung cancer may be due to air pollution
C-STATS Report Age-adjusted lung cancer mortality rates MORTALITY(age-adjusted) Number of cases 78 Rate 50. 4 • SOLANO 198 54. 0 • SONOMA 229 45. 6 • STATEWIDE 13, 168 40. 4 • NAPA
Surgery
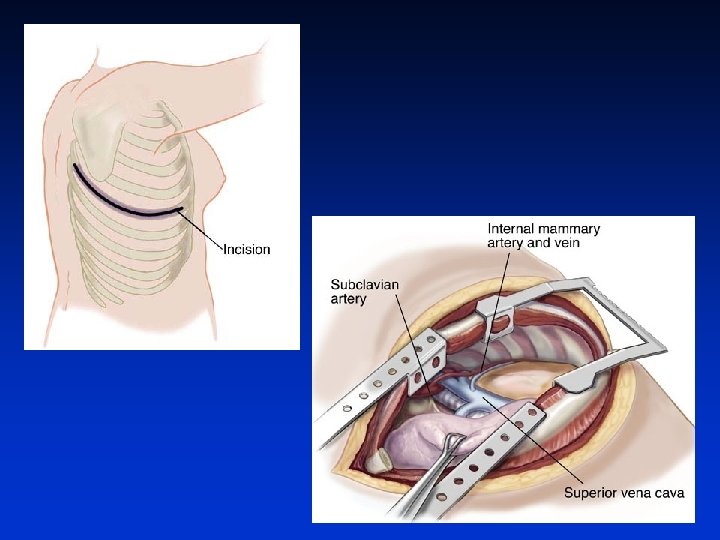
Types of Resection
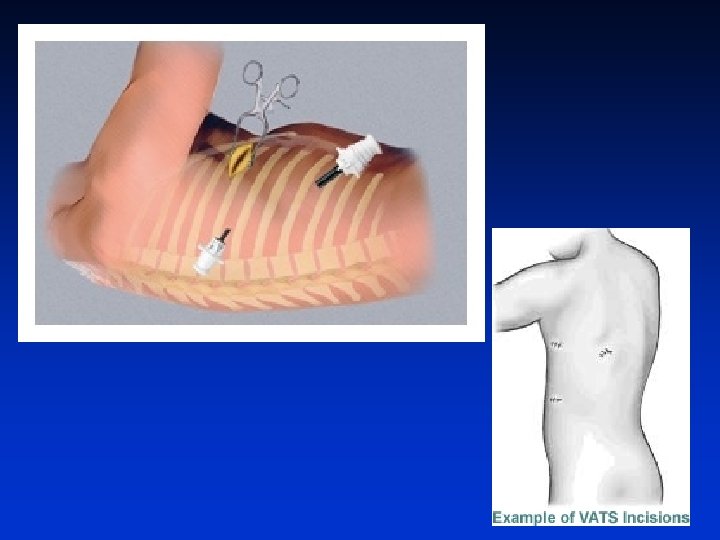
VATS Lobectomy Video Assisted Thorascopic Surgery Ø Standardize the definition of a VATS lobectomy to encompass a true anatomic lobectomy with individual ligation of lobar vessels and bronchus as well as hilar lymph node dissection or sampling using the video screen for guidance, two or three ports, and no retractor use or rib spreading.
Quality of Life: Demmy et al, Ann Thor Surg 2008
Video Clips
VATS Summary Ø Enhanced visualization Ø Decreased trauma to the tissue Ø Decreased postoperative pain Ø Decreased postoperative respiratory and other complications Ø Decreased Hospital Stay Ø Shortened Recovery time, allowing return to work and daily activities sooner Ø Ability to offer surgery to higher risk patients who would not be candidates otherwise
Heart Disease
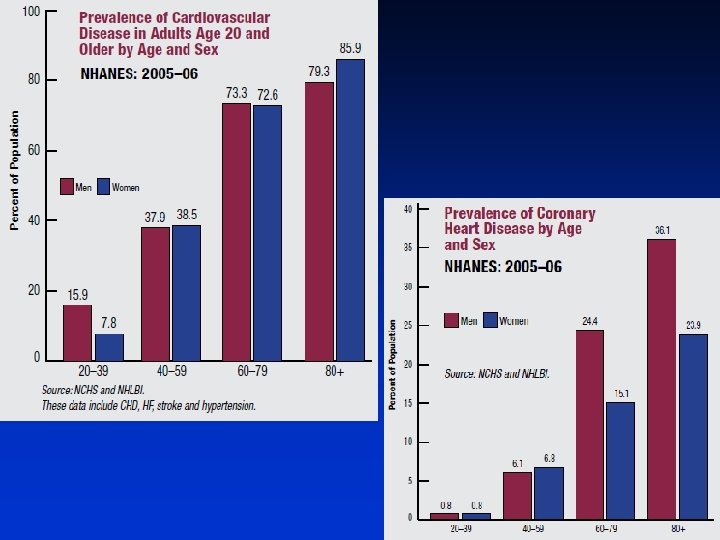
Estimated 80 million Americans have one or more type of Cardiovascular Disease 1 in 3 American Adults
Mortality
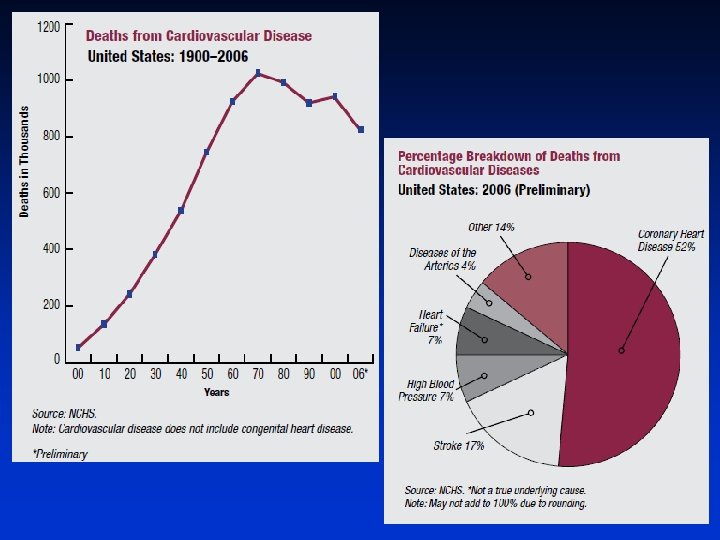
Cardiovascular Disease accounts for 35. 3% of all deaths in 2005, or one of every 2. 8 deaths in the United States. 2, 400 Americans die of CVD each day one death every 37 seconds In every year since 1900 except 1918, CVD accounted for more deaths than any other cause.
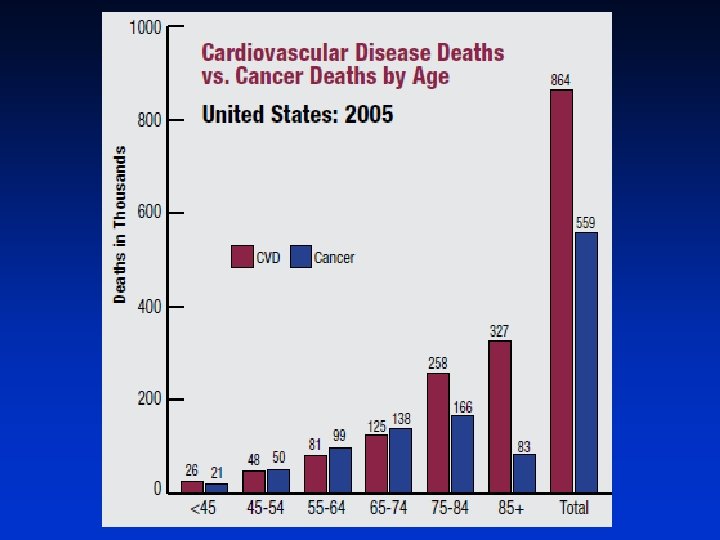
Cardiovascular Disease claims more lives each year than Cancer, Chronic Lower Respiratory Diseases, Accidents, and Diabetes Mellitus COMBINED!
Cost
Cost
Risk Factors Ø Healthy Lifestyle Characteristics Ø Non Smoking 76. 0 % Ø Healthy Weight 40. 1 % Ø Five Fruits & Vegetables per day 23. 3 % Ø Regular Physical Activity 22. 2 % Ø All 4 Above 3. 0 %
Ø Family History Risk Factors Ø CVD in parent or sibling associated with two-fold increase risk of CVD, independent of other risk factors Ø Optimal Risk Factor Profile Ø Ø Ø 7900 men and women Blood pressure below 120/80 mm Hg Total cholesterol below 180 mg/d. L Non smoker No diabetes Median life expectancy was 10 or more years longer than those with 2 or more major risk factors Ø Diet and Activity Ø People age 70 -90 eating Mediterrean-style diet and Greater physical activity 65 -73% lower rate of mortality, including CVD and Cancer
Nutrition “America’s Obesity Problem”
Overweight and Obesity Adults Ø Overweight (BMI > 25) Ø Obesity (BMI > 30) Ø Ø Ø 145 million Americans are Overweight or Obese 71 million Overweight 74 million Obese Ø 1999 to 2003 Ø Overweight ↑ 1. 8% Ø Obesity ↑ 3. 8% Ø Extreme Obesity (BMI >40) Ø ↑ 1. 2% Cost Ø Between $92 - $117 billion annually (2002) Worldwide By 2015, number of overweight people will be 2. 3 billion and obese people will number 700 million 66. 7% of the Adult Population
Overweight and Obesity Youth Ø Overweight (BMI > 25) Ø Obesity (BMI > 30) Ø Ø Ø 23 million children & adolescents are Overweight or Obese 11 million Overweight 12 million Obese Ø 1971 -1974 to 2003 -2006 Ø Overweight ↑ from 4. 0% to 17. 0% (ages 6 -11) Ø Overweight ↑ from 6. 1% to 17. 6% (ages 12 -19) Worldwide In 2005, number of overweight children under the age of 5 was 20 million 31. 9% of the Population
Trends in prevalence of overweight among U. S. children and adolescents by age and survey. (NHANES, 1971 -74, 1976 -80, 1988 -94 and 2001 -2004). Source: Health, United States, 2007. NCHS.
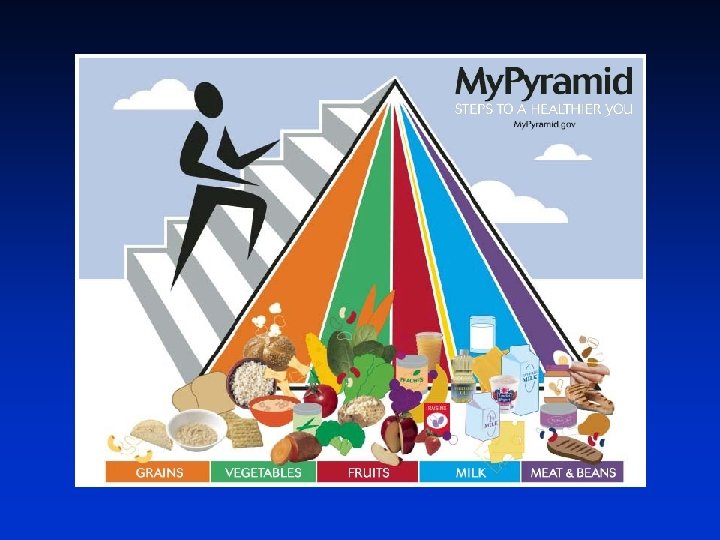
Nutrition
Adults Children Whole Grains 0. 5 to 2. 0 (rec: 6 – 8) 0. 4 to 0. 5 (rec: 6) servings per day Vegetables 1. 2 to 2. 1 (rec: 4 – 5) 0. 8 to 0. 9 (rec: 3 – 4) servings per day Average consumption: Fruits 1. 1 to 1. 8 (rec: 4 – 5) 0. 8 to 0. 9 (rec: 4) servings per day Meat 1. 5 to 3. 7 2. 1 to 3. 4 servings per week Sugar Sweetened Beverages: Adults 6 – 18 servings (8 ounces) per week Children 8 – 23 servings per week Sweets and Bakery Desserts: Adults 4 – 8 servings per day (rec: less than 5 per week) Children 9 – 10 servings per week (rec: 0 per week)
Men Women Figure 16 -1. Age-Adjusted Trends in Macronutrients and Total Calories Consumed by U. S. Adults (20 -74 years), 1971 -2004. Source: National Center for Health Statistics. Health, United States 2007, With Chartbook on Trends in the Health of Americans. Hyattsville, Md: National Center for Health Statistics; 2007
1977 2007 Figure 16 -3. Total U. S. Food Expenditures Away from Home and At Home, 1977 and 2007. Source: United States Department of Agriculture Economic Research Service
Recommendations Ø Choose lean meats and poultry Ø Prepare without added saturated or trans fat Ø Remove visible fat from meat and skin from poultry Ø Choose white meat when eating poultry Ø Grill, bake or broil meats and poultry Ø Select fat-free, 1 percent fat, and low-fat dairy products Ø Reduce trans fat Ø Cut back on foods containing partially hydrogenated vegetable oils Ø Limit cakes, cookies, crackers, pastries, pies, muffins, doughnuts, and French fries Ø Eat less than 300 milligrams of cholesterol each day Ø 200 mg per egg yolk, Shellfish 50 -100 mg per ½ cup, 30 mg per cup whole milk Ø Cut back on beverages and foods with added sugars Ø Eat less than 2, 300 milligrams of sodium per day Ø Drink in moderation Ø one drink per day for women Ø two drinks per day for men
Lipid Goals Ø Total Cholesterol <200 Ø HDL Cholesterol >40 Ø Eliminate Saturated Fat Ø Use Unsaturated Fat instead Ø Reduce alcohol consumption Ø Increase exercise Ø LDL Cholesterol <100 Ø Reduce Fat Decrease Saturated Fat and Eliminate Trans Fat Ø Eat less than 300 milligrams of cholesterol each day Ø Triglycerides < 150 Ø Reduce High Fat foods Ø Reduce High simple sugar foods Ø Reduce red meat intake Ø Reduce or Eliminate alcohol consumption Ø Increase exercise
Ø Trans Fat Hydrogenated Ø Saturated Fat Animal Fat Palm oil / Palm kernel oil Coconut oil Ø Monounsaturated Fat (may decrease LDL) (may maintain HDL) Olive oil Peanut oil Canola oil Avocado, Nuts, Seed Ø Polyunsaturated Fat (may decrease LDL and HDL) Safflower oil Sunflower oil Corn oil Soybean oil Omega 3 and Omega 6
Exercise
Recommendations
Recommendations
Physical Inactivity Ø Adults Ø 2007 Prevalence of regular physical activity is 30. 8% Ø Males 33. 9% Females 28. 9% Ø 66. 3% of Women report NEVER engaging in vigorous physical activity Ø 56. 0% of Men report NEVER engaging in vigorous physical activity
Physical Inactivity Youth Ø 61. 5% of children ages 9 -13 DO NOT participate in any organized physical activity during non-school hours Ø 22. 6% DO NOT engage in any free-time physical activity Ø Girls by the age of 16 or 17: Ø 31% white girls and 56% of black girls have NO habitual leisure-time activity Ø Students grades 9 -12: Ø 24. 9% spent 3 or more hours per day using computers outside of school Ø 35. 4% spent 3 or more hours per day watching television
Prevalence of children ages 6 -19 who attained sufficient moderate-tovigorous physical activity to meet public health recommendations of >60 minutes/day on >5 of 7 days by sex and age. (NHANES: 2003 -04). Source: MSSE 2008; 40: 181 -8. 78
OPCABG / EVH Robotic CABG
Schematic for CPB Aorta Venous Blood From Body Venous Reservoir Cardioplegia CO 2 CPB Console O 2
Complications of CPB Ø Ø Ø Ø Neurological complications Immune system compromise Systemic inflammatory response Bleeding complications Hemolysis Renal system complications Atrial fibrillation
OPCAB Surgical Exposure
OPCAB Surgical Instrumentation CTS/Guidant Access Ultima Stabilizer and Retractor
OPCAB Surgical Instrumentation Medtronic Octopus II Suction Stabilizer System
OPCAB Surgical Procedure
Traditional SVG Harvesting Traditional vessel harvesting has some associated risks: Ø Patients often experience complications and infection as the leg wound heals. Ø Some patients experience more postoperative pain from the leg incision than from the chest incision. Ø Rehabilitation may be delayed if the long leg incision makes it difficult for the patient to stand or walk after surgery
Endoscopic SVG Harvesting Endoscopic vessel harvesting has been shown to: Ø Reduce surgical trauma to the patient Ø Decrease the occurrence of complications and infection as the wound heals Ø Eliminate the long scar associated with traditional vessel harvesting
Endoscopic SVG Harvesting Video-assisted endoscopic technique: Ø Insertion of video endoscope and blunt dissection up along the front and back plane of the Greater Saphenous Vein Ø CO 2 insufflation creates a tunnel Ø Lateral branches and attachments dissected free and divided using bipolar cautery scissors Ø Vein divided proximally and distally, and removed from tunnel
da. Vinci Robotic Surgery System
Robotic CABG Surgery Mobilization of IMA-to-RCA Anastomosis
Take Home Message Ø LOBBY AGAINST AIR POLLUTION AND SUPPORT CLEANER AIR Ø DO NOT SMOKE Ø QUIT TODAY AND LIVE LONGER Ø PROTECT OUR CHILDREN FROM ADVERTISING AND SECOND-HAND SMOKE EXPOSURE Ø EAT LESS Ø EAT BETTER – LESS MEAT, LESS SUGAR, MORE FRUITS AND VEGETABLES Ø EXERCISE Ø ENCOURAGE AND SUPPORT OUR YOUTH TO EAT BETTER AND EXERCISE OUR FUTURE AND THEIRS DEPENDS ON IT