Healthy Hearts Healthy Lungs Living Longer and Living


 were current")


 Systolic BP mm/Hg, no")

 Ø Obesity (BMI > 30)")

 Ø Obesity (BMI > 30)")


- Slides: 62
Healthy Hearts, Healthy Lungs: Living Longer and Living Better Samer Kanaan, M. D.
Goals Ø Understand the Societal impact of Smoking Ø Understand the Societal impact of Heart Disease Ø Review “America’s Obesity Problem” and focus on Nutrition Ø How to have a Healthy Heart with focus on Exercise
Smoking
Smoking Facts Ø Smoking is the most important preventable cause of morbidity and premature mortality Worldwide Ø Ø 438, 000 Americans die each year from smoking related diseases Smoking is responsible for more than one in five US deaths About ½ of all regular smokers will die from the addiction Smoking costs the United States $193 billion in 2004 Ø Cigarette smoke contains over 4800 chemicals, of which 69 are known to cause cancer Ø Smoking is directly responsible for 90% of the 161, 000 Lung Cancer deaths Ø Smoking is directly responsible for 80 -90% of the 127, 000 COPD deaths Ø Smoking is major risk factor for Coronary artery disease, stroke, and lower respiratory infections
Smoking Facts Smoking Ø Smoking reduces the normal life expectancy by an average of 13 -15 years Ø 8. 6 million Americans have a smoking related illness Ø This means that for every 1 American who dies from smoking related disease, there are 20 more people who suffer from a smoking related disease
List of diseases caused by smoking COPD Coronary Artery Disease Ø 60 % Higher Risk of dying from heart attack in smokers over 65 than non smokers Stroke Ø Men over 65 who smoke are twice as likely to die from stroke than non smokers Ø Women over 65 who smoke are 1 ½ times as likely to die from stroke than non smokers AAA Acute Myeloid Leukemia Cataracts 2 -3 times the risk higher in smokers Pneumonia Periodontitis Bladder cancer Esophageal cancer Laryngeal cancer Lung cancer Oral cancer Throat cancer Cervical cancer Kidney cancer Stomach cancer Pancreatic cancer Infertility Peptic Ulcer Disease Slow wound healing Dementia / Alzheimer’s Ø Smokers have far greater chance of developing dementia than nonsmokers
Ø Worldwide Smoking Ø Tobacco is leading cause of preventable death worldwide Ø Tobacco kills more than HIV/AIDS, Tuberculosis, and Malaria COMBINED Ø Tobacco responsible for 5 million deaths each year and will increase to 8 million / year in 2030 Ø Tobacco was responsible for 100 million deaths in the 20 th Century Ø With current usage, tobacco could kill 1 billion people in the 21 st Century Ø 48% Men versus 10% Women smoke Ø China: 63% Men versus 3. 8% Women 300 million people smoke in China which is more than the entire US population
Smoking Facts Ø 45. 3 million Americans (20. 6 % of adults) were current smokers in 2006 Ø 45. 7 million Americans were former smokers in 2006 Ø Prevalence of smoking decreased 40% between 1965 and 1990, but has been UNCHANGED since Ø Males 23. 6% Ø Females 17. 8% Ø American Indians/ Alaskan Natives 32. 2% Ø Whites 21. 8% Ø Blacks 22. 6% Ø Hispanics 15. 1% Ø Asians 10. 3% Ø High school students smoking trend is alarming: data from 2004 Ø Hispanics 26. 2% Ø African Americans 17. 1% Ø Whites 31. 5%
2007 20% high school students were smokers 6% middle school students were smokers
Smoking Facts Smoking Ø 2005: Advertising by the 5 major tobacco companies totaled $13. 1 billion $35 million / day Ø 90% of adults who smoke start by the age of 21 Ø 50% became regular smokers by the age of 18 Ø Average youth in the US is annually exposed to 559 tobacco ads Ø 617 tobacco ads for every adult female Ø 892 tobacco ads for every adult African American
Smoking Ø Smoking in Pregnancy Ø Smoking accounts for 20 -30% of low birth weight Ø 14% of preterm deliveries Ø 10% of all infant deaths Ø 10. 7% of women smoked during pregnancy in 2005 (down 45% from 1990) Ø Neonatal health-care costs attributed to maternal smoking is $366 million per year Ø Mothers who smoke can pass nicotine to their children through breast milk
Second Hand Smoke Ø Described by the EPA as a known human Group A carcinogen Ø Contains more than 250 toxic or cancer causing chemicals, including formaldehyde, benzene, vinyl chloride, arsenic, ammonia, and hydrogen cyanide Ø Current Surgeon General report concluded that there is NO risk free level of exposure to secondhand smoke Ø Second hand smoke even in short exposures can cause platelets to become stickier, damage blood vessel lining, decrease coronary flow velocity, and reduce heart rate variability all of these can increase the risk of a heart attack Ø 3, 400 lung cancer deaths / year Ø 46, 000 heart disease deaths / year
Ø Smoking by Parents Smoking Ø Exacerbation of asthma à 400, 000 – 1, 000 asthma episodes per year Ø Increased frequency of colds and ear infection à 790, 000 ear infections per year Ø Increased risk of respiratory infections 150, 000 - 300, 000 lower respiratory infections per year Ø Increased frequency of Sudden Infant Death Syndrome à 430 cases per year Ø 21 million or 35% of children live with smokers on a regular basis
Smoking Cigar smoking Ø 5. 8% or 12. 8 million Americans were current cigar smokers in 2005 Ø 10. 1% or 10. 6 million of men Ø 1. 7% or 2 million of women Ø 2007: 13. 6% high school students (19. 4% of boys and 7. 6% of girls) Ø 2004: 5. 3% of middle school students Ø Cigars contain the same addictive and carcinogenic compounds as cigarettes Ø A single large cigar can contain as much tobacco as an entire pack of cigarettes Ø Cigar smoking causes Ø Lung Cancer Ø Oral Cavity Cancer Ø Larynx Cancer Ø Esophageal Cancer Ø Pancreatic Cancer Ø COPD
What to do about Smoking Ø WHO proven policies for effective tobacco control Ø Raising taxes and prices Ø Price of cigarettes has very significant effect on youth smoking every 10% increase in price decreased youth consumption by 7% Ø Ø Ø Banning advertising, promotion and sponsorship Protecting people from secondhand smoke Warning everyone about the dangers of tobacco Offering help to people who want to quit Carefully monitoring the epidemic and prevention policies
Smoking Cessation Smoking Ø Quitting often requires multiple attempts Ø Cutting down on cigarettes but not quitting DOES NOT reduce mortality risks from tobacco related illnesses Ø Only 5% long term success with quitting “cold turkey” Ø Counseling and medication in combination is more effective than either one alone Ø There are 7 FDA approved medications to aid in quitting smoking
Benefits Smoking Ø 20 minutes after last cigarette: blood pressure decreases; pulse rate drops; and body temperature increases Ø 8 hours after quitting: carbon monoxide level in blood drops to normal; oxygen level in blood increases to normal Ø 24 hours after quitting: chance of a heart attack decreases Ø 48 hours after quitting: nerve endings start regrowing; ability to smell and taste is enhanced Ø 2 weeks to 3 months after quitting: circulation improves; walking becomes easier; lung function increases Ø 1 to 9 months after quitting: coughing, sinus congestion, fatigue, shortness of breath decreases
Benefits Smoking Ø 1 year after quitting: excess risk of coronary heart disease is decreased to half that of a smoker Ø 5 to 15 years after quitting: stroke risk is reduced to that of people who have never smoked Ø 10 years after quitting: risk of lung cancer drops to as little as one-half that of continuing smokers risk of cancer of the mouth, throat, esophagus, bladder, kidney, and pancreas decreases risk of ulcer decreases Ø 15 years after quitting: risk of coronary heart disease is now similar to that of people who have never smoked risk of death returns to nearly the level of people who have never smoked
Life Expectancy Benefit Smoking Ø Quit at age 35 years Ø Increase in life expectancy versus those who conitnue to smoke: Ø 6. 9 to 8. 5 years for men Ø 6. 1 to 7. 7 years for women Ø Quit at age 45 years Ø Increase in life expectancy versus those who conitnue to smoke: Ø 5. 6 to 7. 1 years for men Ø 5. 6 to 7. 2 years for women Ø Quit at age 55 years Ø Increase in life expectancy versus those who conitnue to smoke: Ø 3. 4 to 4. 8 years for men Ø 4. 2 to 5. 6 years for women Ø Quit at age 65 years Ø Increase in life expectancy versus those who conitnue to smoke: Ø 1. 4 to 2. 0 years for men Ø 2. 7 to 3. 7 years for women
Heart Disease
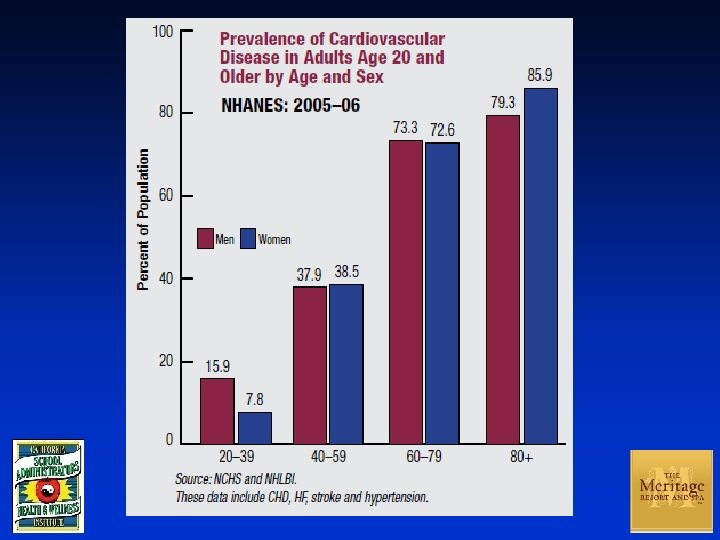
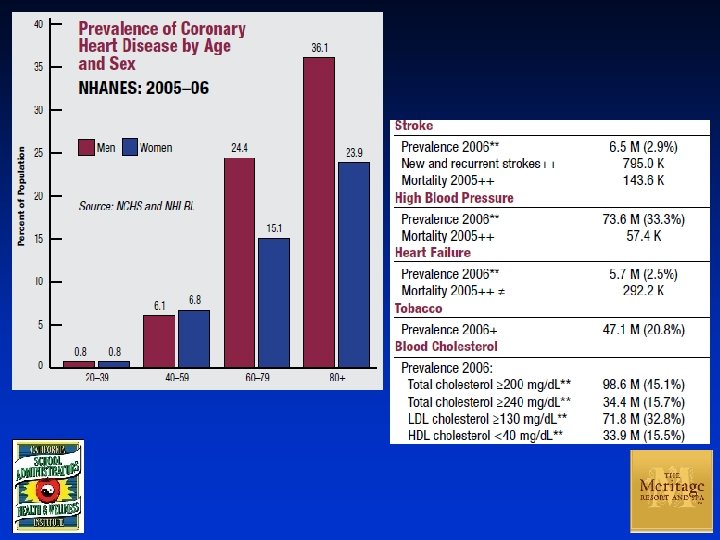
Prevalence Incidence
Estimated 80 million Americans have one or more type of Cardiovascular Disease 1 in 3 American Adults
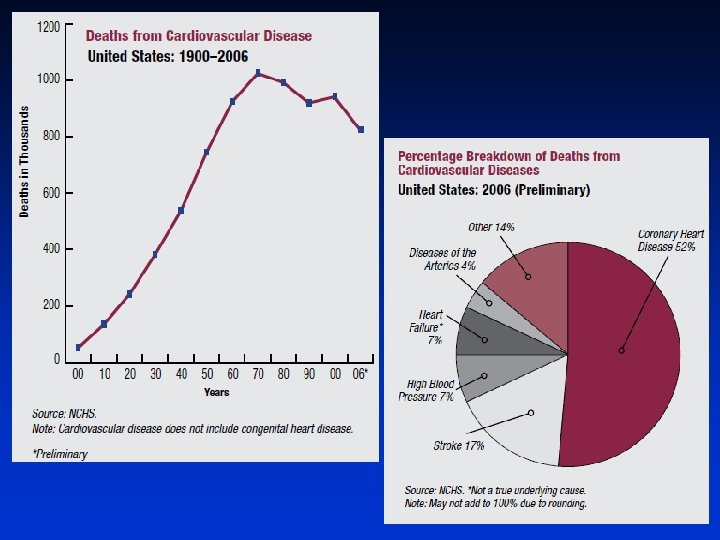
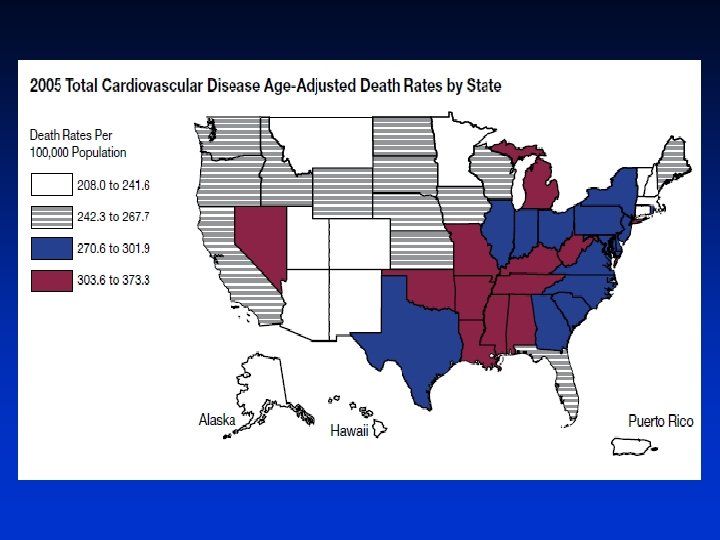
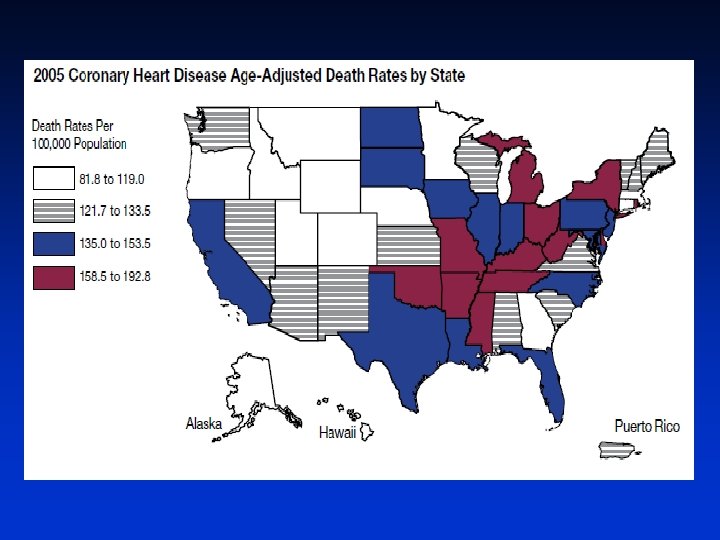
Mortality
Cardiovascular Disease accounts for 35. 3% of all deaths in 2005, or one of every 2. 8 deaths in the United States. 2, 400 Americans die of CVD each day one death every 37 seconds In every year since 1900 except 1918, CVD accounted for more deaths than any other cause.
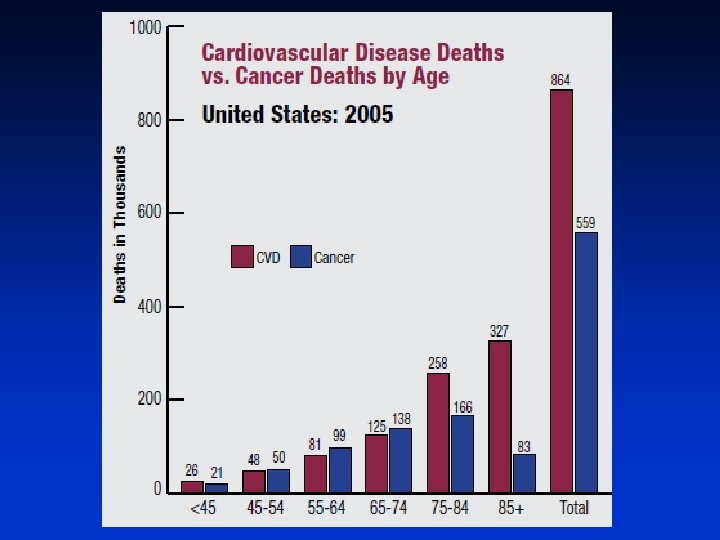
Cardiovascular Disease claims more lives each year than Cancer, Chronic Lower Respiratory Diseases, Accidents, and Diabetes Mellitus COMBINED!
Cost
Cost
Risk Factors
Risk Factors Ø Healthy Lifestyle Characteristics Ø Non Smoking 76. 0 % Ø Healthy Weight 40. 1 % Ø Five Fruits & Vegetables per day 23. 3 % Ø Regular Physical Activity 22. 2 % Ø All 4 Above 3. 0 %
Ø Family History Risk Factors Ø Cardiovascular disease in parent or sibling associated with two-fold increase risk of Cardiovascular disease, independent of other risk factors Ø Optimal Risk Factor Profile Ø Ø Ø 7900 men and women Blood pressure below 120/80 mm Hg Total cholesterol below 180 mg/d. L Non smoker No diabetes Median life expectancy was 10 or more years longer than those with 2 or more major risk factors Ø Diet and Activity Ø People age 70 -90 eating Mediterrean-style diet and Greater physical activity 65 -73% lower rate of mortality including Cardiovascular disease and Cancer
A Age HDL Cholesterol, mg/d. L Total Cholesterol (mg/d. L) Systolic BP mm/Hg, no treat. Smoker Diabetes 50 -54 45 -49 160 -199 120 -129 No No B 50 -54 45 -49 200 -239 130 -139 No No C D 50 -54 35 -44 200 -239 130 -139 No Yes Yes Estimated 10 -Year CVD risk in 50 -54 -year-old adults according to levels of various risk factors (Framingham Heart Study). Source: D’Agostino et al. , Circulation. 2008; 117: 743 -753.
Nutrition “America’s Obesity Problem”
Overweight and Obesity Adults Ø Overweight (BMI > 25) Ø Obesity (BMI > 30) Ø Ø Ø 145 million Americans are Overweight or Obese 71 million Overweight 74 million Obese Ø 1999 to 2003 Ø Overweight ↑ 1. 8% Ø Obesity ↑ 3. 8% Ø Extreme Obesity (BMI >40) Ø ↑ 1. 2% Cost Ø Between $92 - $117 billion annually (2002) Worldwide By 2015, number of overweight people will be 2. 3 billion and obese people will number 700 million 66. 7% of the Adult Population
Age-adjusted prevalence of obesity in Adults ages 20 -74 by sex and survey. (NHES, 1960 -62; NHANES, 1971 -74, 1976 -80, 1988 -94 and 2001 -2004). Source: Health, United States, 2007. NCHS.
Overweight and Obesity Youth Ø Overweight (BMI > 25) Ø Obesity (BMI > 30) Ø Ø Ø 23 million children & adolescents are Overweight or Obese 11 million Overweight 12 million Obese Ø 1971 -1974 to 2003 -2006 Ø Overweight ↑ from 4. 0% to 17. 0% (ages 6 -11) Ø Overweight ↑ from 6. 1% to 17. 6% (ages 12 -19) Worldwide In 2005, number of overweight children under the age of 5 was 20 million 31. 9% of the Population
Trends in prevalence of overweight among U. S. children and adolescents by age and survey. (NHANES, 1971 -74, 1976 -80, 1988 -94 and 2001 -2004). Source: Health, United States, 2007. NCHS.
Prevalence of overweight among students in grades 9 -12 by race/ethnicity and sex (YRBS: 2007). Source: MMWR. 2008 57: No. SS-4. BMI 95 th percentile or higher by age and sex of the CDC 2000 growth chart. NH – non-Hispanic.
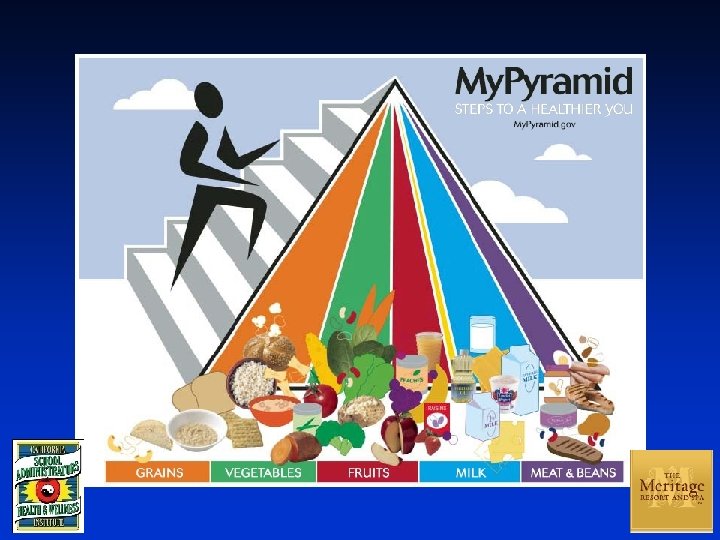
Nutrition
Adults Children Whole Grains 0. 5 -0. 7 to 2. 0 (rec: 6 – 8) 0. 4 to 0. 5 (rec: 6) servings per day Vegetables 1. 2 to 2. 1 (rec: : 4 – 5) 0. 8 to 0. 9 (rec: : 3 – 4) servings per day Average consumption: Fruits 1. 1 to 1. 8 (rec: : 4 – 5) 0. 8 to 0. 9 (rec: : 4) servings per day Meat 1. 5 to 3. 7 2. 1 to 3. 4 servings per week Sugar Sweetened Beverages: Adults 6 – 18 servings (8 ounces) per week Children 8 – 23 servings per week Sweets and Bakery Desserts: Adults 4 – 8 servings per day (rec: less than 5 per week) Children 9 – 10 servings per week ( rec: 0 per week)
Men Women Figure 16 -1. Age-Adjusted Trends in Macronutrients and Total Calories Consumed by U. S. Adults (20 -74 years), 1971 -2004. Source: National Center for Health Statistics. Health, United States 2007, With Chartbook on Trends in the Health of Americans. Hyattsville, Md: National Center for Health Statistics; 2007
1977 2007 Figure 16 -3. Total U. S. Food Expenditures Away from Home and At Home, 1977 and 2007. Source: United States Department of Agriculture Economic Research Service
Recommendations Ø Choose lean meats and poultry Ø Prepare without added saturated or trans fat Ø Remove visible fat from meat and skin from poultry Ø Choose white meat when eating poultry Ø Grill, bake or broil meats and poultry Ø Select fat-free, 1 percent fat, and low-fat dairy products Ø Reduce trans fat Ø Cut back on foods containing partially hydrogenated vegetable oils Ø Limit cakes, cookies, crackers, pastries, pies, muffins, doughnuts, and French fries Ø Eat less than 300 milligrams of cholesterol each day Ø 200 mg per egg yolk, Shellfish 50 -100 mg per ½ cup, 30 mg per cup whole milk Ø Cut back on beverages and foods with added sugars Ø Eat less than 2, 300 milligrams of sodium per day Ø Drink in moderation Ø one drink per day for women Ø two drinks per day for men
Lipid Goals Ø Total Cholesterol <200 Ø HDL Cholesterol > 40 at least Ø Eliminate Saturated Fat Ø Use Unsaturated Fat instead Ø Reduce alcohol consumption Ø Increase exercise
Lipid Goals Ø LDL Cholesterol <100 Ø Reduce Fat Decrease Saturated Fat and Eliminate Trans Fat Ø Eat less than 300 milligrams of cholesterol each day Ø Triglycerides < 150 Ø Reduce High Fat foods Ø Reduce High simple sugar foods Ø Reduce red meat intake Ø Reduce/Eliminate alcohol consumption Ø Increase exercise
Ø Trans Fat Hydrogenated Ø Saturated Fat Animal Fat Palm oil / Palm kernel oil Coconut oil Ø Monounsaturated Fat (may decrease LDL) (may maintain HDL) Olive oil Peanut oil Canola oil Avocado, Nuts, Seed Ø Polyunsaturated Fat (may decrease LDL and HDL) Safflower oil Sunflower oil Corn oil Soybean oil Omega 3 and Omega 6
Exercise
Recommendations
Recommendations
Physical Inactivity Ø Adults Ø 2007 Prevalence of regular physical activity is 30. 8% Ø Males 33. 9% Females 28. 9% Ø 66. 3% of Women report NEVER engaging in vigorous physical activity Ø 56. 0% of Men report NEVER engaging in vigorous physical activity
Physical Inactivity Youth Ø 61. 5% of children ages 9 -13 DO NOT participate in any organized physical activity during non-school hours Ø 22. 6% DO NOT engage in any free-time physical activity Ø Girls by the age of 16 or 17: Ø 31% white girls and 56% of black girls have NO habitual leisure-time activity Ø Students grades 9 -12: Ø 24. 9% spent 3 or more hours per day using computers outside of school Ø 35. 4% spent 3 or more hours per day watching TV
Prevalence of students in grades 9 -12 who met currently recommended levels of physical activity during the past 7 days by race/ ethnicity and sex (YRBS: 2007). Source: MMWR. 2008; 57: No. SS-4. NH – non-Hispanic. Note: “Currently recommended levels” is defined as activity that increased their heart rate and made them breathe hard some of the time for a total of at least 60 minutes/day on 5 or more of 58 the 7 days preceding the survey.
Prevalence of children ages 6 -19 who attained sufficient moderate-tovigorous physical activity to meet public health recommendations of >60 minutes/day on >5 of 7 days by sex and age. (NHANES: 2003 -04). Source: MSSE 2008; 40: 181 -8. 59
Summary Ø Smoking is the most important preventable cause of morbidity and premature mortality Worldwide Ø Smoking reduces the normal life expectancy by an average of 13 -15 years Ø 20% high school students were smokers Ø 6% middle school students were smokers Ø 2, 400 Americans die of Cardiovascular disease each day one death every 37 seconds
Summary Ø 145 million Americans are Overweight or Obese 66. 7% of the Adult Population Ø 23 million children & adolescents are Overweight or Obese 31. 9% of the Population Ø 66. 3% of Women report NEVER engaging in vigorous physical activity Ø 56. 0% of Men report NEVER engaging in vigorous physical activity Ø 61. 5% of children ages 9 -13 DO NOT participate in any organized physical activity during non-school hours
Take Home Message Ø DO NOT SMOKE Ø Eat a Heart Healthy Diet Ø Eat and Drink in Moderation Ø Be ACTIVE – for you, for your heart, and for your children!